


Abstract
We present an experimental and theoretical study which compares the phonon anomalies and the electronic gap features in the infrared response of the weakly coupled two-leg-ladders in Sr CaxCu24O41 (SCCO) with those of the underdoped high-Tc superconductor YBa2Cu3O
 (YBCO) and thereby reveals some surprising analogies. Specifically, we present a phenomenological model that describes the anomalous doping- and temperature-dependence of some of the phonon features in the a-axis response (field along the rungs of the ladders) of SCCO. It assumes that the phonons are coupled to charge oscillations within the ladders. Their changes with decreasing temperature reveal the formation of a crystal (density wave) of hole pairs that are oriented along the rungs. We also discuss the analogy to a similar model that was previously used to explain the phonon anomalies and an electronic plasma mode in the c-axis response (field perpendicular to the CuO2 planes) of YBCO. We further confirm that an insulator-like pseudogap develops in the a-axis conductivity of SCCO which closely resembles that in the c-axis conductivity of YBCO. Most surprisingly, we find that the c-axis conductivity (field along the legs of the ladders) of SCCO is strikingly similar to the in-plane one (field parallel to the CuO2 planes) of YBCO. Notably, in both cases a dip feature develops in the normal state spectra that is connected with a spectral weight shift toward low frequencies and can thus be associated with precursor superconducting pairing correlations that are lacking macroscopic phase coherence. This SCCO–YBCO analogy indicates that collective degrees of freedom contribute to the low-energy response of underdoped high Tc cuprates and it even suggests that the charges in the CuO2 planes tend to segregate forming quasi-one-dimensional structures similar to the two-leg ladders, as predicted for the stripe-scenario or certain intertwinned states.
Export citation and abstract BibTeX RIS
1. Introduction
The mechanism of the high-Tc
superconductivity in the layered cuprates remains a subject of controversial debate. More than three decades of intensive research have shown that not only the superconducting (SC) pairing but also the origin of the anomalous electronic properties in the normal state need to be understood before this mystery can be resolved [1]. The most prominent feature of these anomalous normal state properties is the so-called pseudogap (PG) phenomenon which gives rise to a partial, gap-like suppression of the low-energy electronic excitations [2–9]. This PG prevails on the underdoped side of the phase diagram of temperature versus hole doping, p, where its energy scale, Epg
, and its onset (or crossover) temperature,  , increase steeply as p is reduced, contrary to the SC critical temperature, Tc
, and the SC condensate density which both decrease and finally vanish as the Mott-Hubbard insulating state is approached.
, increase steeply as p is reduced, contrary to the SC critical temperature, Tc
, and the SC condensate density which both decrease and finally vanish as the Mott-Hubbard insulating state is approached.
A variety of models has been proposed attempting to explain the PG phenomenon. They include precursor SC pairing correlations [10, 11], resonating valence bond states [12, 13], and different orders competing with superconductivity such as a charge density wave (CDW) order [14–16], a spontaneous flux phase [17], or a toroidal order [18]. Likewise, various entangled states have been discussed, like the so-called stripe order [19], for which charge and spin order develop concurrently and superconductivity emerges from a quasi-one-dimensional electronic state, or the so-called pair density wave (PDW) order [20], i.e. a SC state in which the order parameter varies periodically as a function of position in such a way that its spatial average vanishes. Nevertheless, the origin of the order underlying the PG state and its relationship with SC have remained elusive. A likely reason is that multiple interactions and orders are at play and give rise to a complex quantum state with short-ranged and fluctuating charge and/or spin orders that are difficult to detect and identify experimentally [20].
In this context, it is of great interest to compare the electronic properties of the planar high-Tc
cuprates with those of related quasi-one-dimensional (1D) materials, like the copper-oxygen chain or ladder compounds [21, 22]. A particularly interesting material is the so-called telephone number compound Sr Cax
Cu24O41 which contains layers of weakly coupled two-leg ladders that bridge the range between a quasi-one-dimensional and a two-dimensional electronic state [23, 24]. Figure 1(a) shows a schematic representation of the crystal structure of SCCO which consists of alternating layers of CuO2 chains and of weakly coupled Cu2O3 two-leg ladders that are separated by Sr/Ca layers. The distribution of the nominally six holes per formula unit between the chain and the ladder layers depends on the Sr:Ca ratio and it varies as a function of temperature and external pressure. With increasing Ca concentration, the number of doped holes per ladder Cu at room temperature increases from about 0.07 for x = 0 to about 0.20 for x = 12 [25] (somewhat higher values are reported in [26]). The two-leg ladders dominate the charge transport which is strongly anisotropic with the highest conductivity along the legs of the ladders (c-axis), an intermediate one along the rungs of the ladders (a-axis), and by far the lowest one along the b axis, that is perpendicular to the layers of chains and ladders. Figure 1(b) shows for comparison the structure of the planar high-Tc
cuprate YBa2Cu3O7 for which the conductivity is metal-like within the quasi-two-dimensional CuO2 layers (along the a- and b-axis) whereas the conductivity out of the planes (along the c-axis) is much lower and exhibits an unusual temperature and frequency dependence that is insulator-like in the underdoped regime (as is further discussed in section 1.1).
Cax
Cu24O41 which contains layers of weakly coupled two-leg ladders that bridge the range between a quasi-one-dimensional and a two-dimensional electronic state [23, 24]. Figure 1(a) shows a schematic representation of the crystal structure of SCCO which consists of alternating layers of CuO2 chains and of weakly coupled Cu2O3 two-leg ladders that are separated by Sr/Ca layers. The distribution of the nominally six holes per formula unit between the chain and the ladder layers depends on the Sr:Ca ratio and it varies as a function of temperature and external pressure. With increasing Ca concentration, the number of doped holes per ladder Cu at room temperature increases from about 0.07 for x = 0 to about 0.20 for x = 12 [25] (somewhat higher values are reported in [26]). The two-leg ladders dominate the charge transport which is strongly anisotropic with the highest conductivity along the legs of the ladders (c-axis), an intermediate one along the rungs of the ladders (a-axis), and by far the lowest one along the b axis, that is perpendicular to the layers of chains and ladders. Figure 1(b) shows for comparison the structure of the planar high-Tc
cuprate YBa2Cu3O7 for which the conductivity is metal-like within the quasi-two-dimensional CuO2 layers (along the a- and b-axis) whereas the conductivity out of the planes (along the c-axis) is much lower and exhibits an unusual temperature and frequency dependence that is insulator-like in the underdoped regime (as is further discussed in section 1.1).
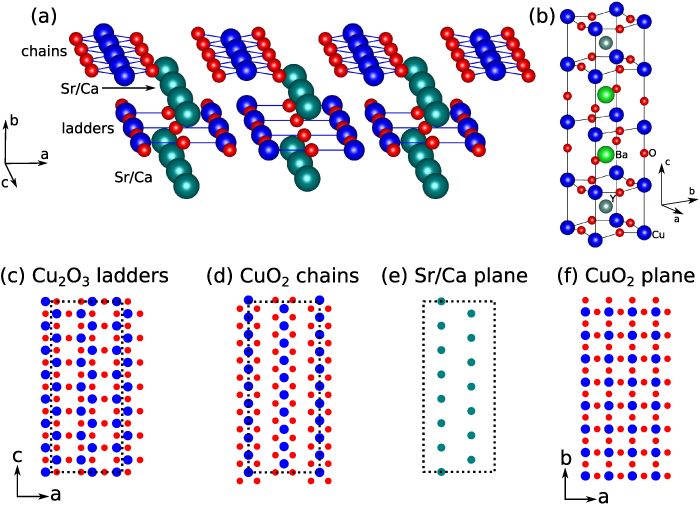
Figure 1. Crystal structure of (a) Sr Cax
Cu24O41 (SCCO) and (b) YBa2Cu3O7 (YBCO). Panels (c)–(e) show the structure of the layer of Cu2O3 ladders, of CuO2 chains and the Sr/Ca plane, respectively. The dotted rectangles of (c)–(e) are stacked on top of each other. Panel (f) shows the structure of a CuO2 plane of YBCO.
Cax
Cu24O41 (SCCO) and (b) YBa2Cu3O7 (YBCO). Panels (c)–(e) show the structure of the layer of Cu2O3 ladders, of CuO2 chains and the Sr/Ca plane, respectively. The dotted rectangles of (c)–(e) are stacked on top of each other. Panel (f) shows the structure of a CuO2 plane of YBCO.
Download figure:
Standard image High-resolution imageIt is believed that essential physical properties of the Cu2O3 ladders of SCCO can be described and understood in terms of models of hole doped spin-1/2 ladders. The latter models are known to display (a) purely short-range spin correlations and an energy gap in the spin excitations (the so-called spin gap) [27, 28]; (b) binding of doped holes into pairs [27, 28]; (c) short-range SC pairing correlations [27–29], with pairs in a state of approximate d-wave symmetry, that compete with (d) a tendency toward the formation of a CDW that involves a crystalline order of hole pairs [27, 28, 30, 31]. In agreement with these predictions, SCCO has been found to exhibit signatures of a spin gap [32–36], of a static CDW order [37–44], and even superconductivity (for x > 10) if a high pressure is applied [45, 46].
A dome-shaped Tc
versus pressure phase diagram emerges here with an onset of superconductivity near 3 GPa, a maximum Tc
of up to 13 K around an optimal pressure popt
of 4–5 GPa (depending on x) and a gradual decrease of Tc
toward higher pressures [47, 48], that is reminiscent of the Tc
versus hole doping phase diagram of the planar cuprates. Indeed, the external pressure enhances the transfer of holes from the chain layer to the ladders [48]. It also increases the electronic coupling between the ladders and thus somewhat reduces the anisotropy of the conductivity in the ladder planes [49, 50] which helps the development of a macroscopically coherent SC state. Similar to the planar cuprates, a spin gap due to a liquid of spin singlets has been observed in SCCO with nuclear magnetic resonance (NMR) and inelastic neutron scattering [32–36]. At ambient pressure, this spin gap has an onset temperature Tsg
of about 200 K that is almost independent of x [36, 39, 51]. Under external pressure (at x > 10) it has been shown with NMR that the spin gap decreases in magnitude and finally vanishes around popt
giving way to a more Fermi-liquid type behavior at  [48, 52]. This coincidence of the Tc
maximum and the suppression of the spin gap around popt
has been interpreted in terms of a crossover from a strong coupling scenario at
[48, 52]. This coincidence of the Tc
maximum and the suppression of the spin gap around popt
has been interpreted in terms of a crossover from a strong coupling scenario at  , with preformed singlet pairs on the individual ladders and a SC state that is induced by the tunneling between the ladders, to a more conventional BCS-type weak coupling state at
  [52]. This scenario shares essential aspects with the stripe picture of the planar high Tc
cuprates [19] for which the strong correlations promote a charge and spin segregation within the CuO2 planes and a self-organized formation of a quasi-one-dimensional electronic structure. Superconductivity is limited here by the phase coherence rather than by the local pair-formation in the underdoped regime, and the highest Tc
value occurs at the crossover toward a homogenous electronic state in the overdoped regime. However, alternative interpretations of the dome-shaped Tc
versus pressure curve of SCCO have been proposed in terms of a maximum in the density of holes states at the Fermi-level that arises at popt
due to the balancing effects of the pressure-induced transfer of holes from the chain layer to the ladder layer and the increase of the bandwidth due to the enhanced electronic coupling between the ladders [48].
[52]. This scenario shares essential aspects with the stripe picture of the planar high Tc
cuprates [19] for which the strong correlations promote a charge and spin segregation within the CuO2 planes and a self-organized formation of a quasi-one-dimensional electronic structure. Superconductivity is limited here by the phase coherence rather than by the local pair-formation in the underdoped regime, and the highest Tc
value occurs at the crossover toward a homogenous electronic state in the overdoped regime. However, alternative interpretations of the dome-shaped Tc
versus pressure curve of SCCO have been proposed in terms of a maximum in the density of holes states at the Fermi-level that arises at popt
due to the balancing effects of the pressure-induced transfer of holes from the chain layer to the ladder layer and the increase of the bandwidth due to the enhanced electronic coupling between the ladders [48].
Besides superconductivity and the spin gap, the ladders in SCCO also host charge orders. For x = 0, the order has been identified by several experimental techniques, in particular by transport measurements [37, 38], low-frequency dielectric spectroscopy [37, 38, 40], low-frequency Raman scattering [40], microwave and millimeter wave spectroscopy [42], optical spectroscopy [37, 38] and by resonant x-ray scattering [43]. This charge order has a period of five ladder lattice parameters along the c-axis and it is rather long-ranged with a correlation length of about 60 lattice parameter along the c-axis [43]. Its onset temperature  210 K is close to that of the spin gap. At low temperatures the charge order gives rise to an insulator-like suppression of the electronic conductivity with a gap magnitude of about 100 meV [37, 39]. Motivated by theoretical predictions [27, 28, 30, 31], it has been proposed that this charge order involves a crystal of hole pairs that reside (approximately) on the rungs and order along the legs of the ladder. A resonant x-ray study has confirmed that the charge order is not accompanied by pronounced structural modulations and thus may be driven by electronic correlations rather than by electron-phonon coupling [43]. Such a crystal of hole pairs has been considered as a phase competing with superconductivity, whereby the latter might emerge once the pairs become mobile and undergo a Bose condensation [27–30]. As the Ca-content increases, the charge order as seen in transport and infrared spectroscopy gets gradually suppressed, i.e. the onset temperature decreases and no sign of a static order is observed at x > 9 [37–39]. Nevertheless, a quasi-elastic longitudinal mode of the low-frequency Raman spectra, that reflects a short-ranged and/or slowly fluctuating order of the hole pairs, persists up to x = 12 [41]. Moreover, a resonant x-ray diffraction study reported that a static hole crystal with a period of three ladder units develops at the specific Ca content of x = 11, whereas at lower and higher Ca concentrations only signs of a fluctuating charge order have been detected [44]. Accordingly, it has been claimed that the static hole crystal can only develop at the specific values of x for which the hole count of the ladders supports a charge order that is commensurate with the lattice [26, 44]. These somewhat contradictory results call for further research on the nature of the charge order occurring for higher values of x and its relation to superconductivity.
These above considerations have motivated the comparative study of the infrared response of the telephone number compound and the strongly underdoped planar high-Tc cuprates that is reported here. In the following, we recall the relevant previous results on the infrared response of the underdoped high-Tc cuprates (section 1.1) and of SCCO crystals with a high Ca content (x > 10) that are at the verge of becoming bulk superconductors (under high external pressure) (section 1.2). Subsequently, we present in section 2 a detailed experimental study of the phonon anomalies and the electronic gap features in the a-axis conductivity of the ladders in SCCO. In section 3 we discuss a model that allows us to reproduce and understand the essential features of the phonon anomalies. Section 4 contains a discussion of the experimental data of the c-axis conductivity of the ladders in SCCO with a high Ca content and a comparison with the a-axis response in underdoped YBCO. Finally, in section 5 we provide a comprehensive discussion of our main findings and our conclusions are given in section 6.
1.1. Underdoped 2D cuprates
1.1.1. c-axis response.
The low-energy electronic response of the planar high-Tc
cuprates has been extensively studied with infrared spectroscopy [53]. It exhibits a strong anisotropy between a metal-like response for the electric field along the CuO2 planes and an insulator-like one for the field along the c-axis direction perpendicular to the CuO2 planes [54]. Especially for underdoped samples, the normal state electronic c-axis conductivity tends to be very low and almost frequency independent, characteristic of an incoherent charge transport across the insulating spacer layers that separate the CuO2 layers. Nevertheless, for the so-called bilayer compounds, like YBa2Cu3O or Bi2Sr2CaCu2O8, which have pairs of closely spaced CuO2 layers (so-called CuO2 bilayers) with a somewhat stronger intra-bilayer electronic coupling, the c-axis spectra exhibit characteristic spectral features that provide valuable information about two phase transitions (or crossover phenomena) that occur in the normal state well above Tc
. A partial gap develops here below a temperature that coincides (within experimental error) with the PG temperature
or Bi2Sr2CaCu2O8, which have pairs of closely spaced CuO2 layers (so-called CuO2 bilayers) with a somewhat stronger intra-bilayer electronic coupling, the c-axis spectra exhibit characteristic spectral features that provide valuable information about two phase transitions (or crossover phenomena) that occur in the normal state well above Tc
. A partial gap develops here below a temperature that coincides (within experimental error) with the PG temperature  that was mentioned above and occurs, e.g. in NMR Knight shift, where it was interpreted in terms of an onset of spin-singlet formation. The spectral weight (SW) that is missing at low energies due to this PG is shifted to higher energies where it gives rise to a broad overshoot band in the mid-infrared (MIR) range [55]. The energy scale of this c-axis PG, defined as the frequency below which the conductivity becomes suppressed, increases toward the underdoped side and extrapolates to a value of
  meV [55, 56] that matches the magnitude of 2J where J is the in-plane superexchange coupling as measured, e.g. with inelastic neutron scattering [57, 58]. This coincidence of the energy scales, predicted by resonating valence bond theory [13], corroborates the interpretation that the PG phenomenon in the c-axis conductivity is also related to the formation of spin singlet pairs.
There is yet another transition or crossover that shows up in the c-axis conductivity at a temperature Tons
that is lower than  but still well above Tc
[59, 60]. It is most evident for samples with a bilayer structure where it gives rise to the formation of a so-called transverse plasma mode (tPM) [61, 62]. The latter originates from resonant oscillations of the charge density on the CuO2 planes of the bilayer units that occur due to the mismatch between the local conductivity within the bilayer units,
but still well above Tc
[59, 60]. It is most evident for samples with a bilayer structure where it gives rise to the formation of a so-called transverse plasma mode (tPM) [61, 62]. The latter originates from resonant oscillations of the charge density on the CuO2 planes of the bilayer units that occur due to the mismatch between the local conductivity within the bilayer units,  , and the local conductivity between the bilayers,
  , with
  . This simple model involving the two local conductivities will be called multilayer model (MLM) in the following. It accounts for a tPM that is very sensitive to changes of the density and/or the scattering rate of the charge carriers on the individual CuO2 planes and, in particular, becomes more pronounced (sharper and/or stronger) in the SC state. Notably, since this tPM has a typical eigenfrequency on the order of 10 THz (that grows as p increases) and involves a length scale on the order of several Angstrom (thickness of the bilayer unit), it is very sensitive to short-ranged SC fluctuations. Accordingly, the transition at Tons
has been interpreted in terms of the onset of short-ranged and slowly fluctuating SC correlations [59].
. This simple model involving the two local conductivities will be called multilayer model (MLM) in the following. It accounts for a tPM that is very sensitive to changes of the density and/or the scattering rate of the charge carriers on the individual CuO2 planes and, in particular, becomes more pronounced (sharper and/or stronger) in the SC state. Notably, since this tPM has a typical eigenfrequency on the order of 10 THz (that grows as p increases) and involves a length scale on the order of several Angstrom (thickness of the bilayer unit), it is very sensitive to short-ranged SC fluctuations. Accordingly, the transition at Tons
has been interpreted in terms of the onset of short-ranged and slowly fluctuating SC correlations [59].
The formation of the tPM is connected with a modification of the dynamical local electric field which affects the response of the infrared active phonons in a very characteristic way [63]. Depending on the spacing between the individual CuO2 layers and their effective charging, the local electric fields can be very different from the externally applied one (due to the incident IR radiation) and also vary between the intra- and inter-bilayer regions. The response of the infrared active phonon modes thus depends on the location of the ions that get displaced and oscillate around their equilibrium position. Accordingly, the spectral structures due to the infrared active phonon modes exhibit characteristic changes ('phonon anomalies') that are connected with the temperature dependence of  ,
,  and the local fields. With decreasing temperature the anomalies occur gradually below Tons
and they become more pronounced below Tc
. In underdoped YBCO, the strongest related phonon anomaly occurs for the so-called bond-bending mode located around 320 cm−1 which, depending on whether the eigenfrequency of the tPM is higher (or lower) exhibits a characteristic SW loss (gain), a narrowing (broadening), and a strong red-shift (blue-shift) [64–66]. The onset of the anomaly of this phonon mode has been used to detail the doping dependence of Tons
throughout the hole doping phase diagram of YBCO. Moreover, this phonon anomaly has been used as a marker to show that a large magnetic field weakens the tPM that causes the underlying local electric field effects [59]. This finding supports the interpretation that Tons
marks the onset (or at least a rapid slowing down) of SC pairing fluctuations. Note, in contrast, that the alternative ordering phenomena, like CDW orders, are enhanced by the magnetic field or at least are insensitive to it [67]. This does not exclude the possibility that the SC fluctuations are linked to other orders, e.g. to the CDW that occurs in a similar temperature range, i.e. below about 150 K at p ≈ 0.1 [68, 69]. The development of a short-ranged CDW order may indeed enhance the slowing down of the SC fluctuations, even though it competes with the bulk SC order that emerges below Tc
. Finally, note that the formation of a tPM and of the related phonon anomalies with the onset of superconductivity is well reproduced by the multilayer-model, both in its phenomenological version of [63] and its microscopic version based on Green's function techniques [70, 71] (without any need for anomalous electron–phonon coupling or structural effects).
and the local fields. With decreasing temperature the anomalies occur gradually below Tons
and they become more pronounced below Tc
. In underdoped YBCO, the strongest related phonon anomaly occurs for the so-called bond-bending mode located around 320 cm−1 which, depending on whether the eigenfrequency of the tPM is higher (or lower) exhibits a characteristic SW loss (gain), a narrowing (broadening), and a strong red-shift (blue-shift) [64–66]. The onset of the anomaly of this phonon mode has been used to detail the doping dependence of Tons
throughout the hole doping phase diagram of YBCO. Moreover, this phonon anomaly has been used as a marker to show that a large magnetic field weakens the tPM that causes the underlying local electric field effects [59]. This finding supports the interpretation that Tons
marks the onset (or at least a rapid slowing down) of SC pairing fluctuations. Note, in contrast, that the alternative ordering phenomena, like CDW orders, are enhanced by the magnetic field or at least are insensitive to it [67]. This does not exclude the possibility that the SC fluctuations are linked to other orders, e.g. to the CDW that occurs in a similar temperature range, i.e. below about 150 K at p ≈ 0.1 [68, 69]. The development of a short-ranged CDW order may indeed enhance the slowing down of the SC fluctuations, even though it competes with the bulk SC order that emerges below Tc
. Finally, note that the formation of a tPM and of the related phonon anomalies with the onset of superconductivity is well reproduced by the multilayer-model, both in its phenomenological version of [63] and its microscopic version based on Green's function techniques [70, 71] (without any need for anomalous electron–phonon coupling or structural effects).
1.1.2. In-plane response.
The corresponding in-plane conductivity has also been extensively studied and analyzed to identify anomalous changes in the normal state above Tc
[53]. A so-called dip feature, which can be associated with the formation of a partial gap, has been identified here in the conductivity spectra of strongly underdoped YBCO [72], Hg-2201 [73] and Bi-2212 [74]. Its onset temperature is significantly lower than the  of the c-axis PG that has been described above and rather coincides with Tons
connected with the tPM and the related phonon anomalies in the c-axis response [59, 75]. Accordingly, this dip feature has been interpreted in terms of the precursor SC pairing correlations that were addressed in the previous paragraph. This assignment has been confirmed by an ellipsometry study which established that the missing SW due to the dip formation in
of the c-axis PG that has been described above and rather coincides with Tons
connected with the tPM and the related phonon anomalies in the c-axis response [59, 75]. Accordingly, this dip feature has been interpreted in terms of the precursor SC pairing correlations that were addressed in the previous paragraph. This assignment has been confirmed by an ellipsometry study which established that the missing SW due to the dip formation in  is shifted to the low-frequency side, similarly as upon formation of the bulk SC state where it gives rise to a delta function at zero frequency, that describes the loss-free response of the SC condensate [59]. In contrast, for the CDW and SDW orders [76] (and also a PDW order with a finite momentum vector [77]), the missing SW (or at least a major part of it) is shifted to higher frequencies. As discussed above, such a blue-shift of SW has been observed in the c-axis conductivity when the PG develops below
  [55]. For the in-plane response, despite extensive searches and various data modeling approaches [78], such a blue-shift of SW with decreasing temperature has never been directly observed. Finally, we note that the onset energy of the dip feature of the in-plane conductivity hardly changes below Tc
, in agreement with the precursor SC correlation scenario but contrary to models with a distinct order parameter in the normal state for which the overall gap energy (and thus also the onset energy) would be expected to increase below Tc
[75].
[55]. For the in-plane response, despite extensive searches and various data modeling approaches [78], such a blue-shift of SW with decreasing temperature has never been directly observed. Finally, we note that the onset energy of the dip feature of the in-plane conductivity hardly changes below Tc
, in agreement with the precursor SC correlation scenario but contrary to models with a distinct order parameter in the normal state for which the overall gap energy (and thus also the onset energy) would be expected to increase below Tc
[75].
1.2. Sr Cax
Cu24O41 (SCCO)
Cax
Cu24O41 (SCCO)

1.2.1. a-axis response along the rungs of the ladders.
In comparison, there exist relatively few infrared spectroscopy studies of the telephone number compound Sr Cax
Cu24O41 (SCCO). This is particularly true for samples with a large Ca content (x > 10) for which the chemical pressure gives rise to a transfer of a sizeable amount of holes from the chains to the ladders [39, 79, 80]. Here the infrared conductivity along the a-axis, with the electric field polarized along the rungs of the ladders, is rather weak and reveals an insulator-like behavior [39, 79, 80]. At temperatures above 200 K, the electronic contribution to the conductivity is almost frequency independent throughout the FIR and MIR ranges. Below 200 K, a PG develops that has features similar to that of the c-axis conductivity (perpendicular to the CuO2 planes) of strongly underdoped YBCO [80]. The a-axis PG of SCCO has the same type of spectral shape, with a gradual suppression of the conductivity below the gap edge, Epg
, and a corresponding increase at higher energies due to a broad overshoot band that forms right above Epg
. Moreover, the magnitudes of Epg
and
Cax
Cu24O41 (SCCO). This is particularly true for samples with a large Ca content (x > 10) for which the chemical pressure gives rise to a transfer of a sizeable amount of holes from the chains to the ladders [39, 79, 80]. Here the infrared conductivity along the a-axis, with the electric field polarized along the rungs of the ladders, is rather weak and reveals an insulator-like behavior [39, 79, 80]. At temperatures above 200 K, the electronic contribution to the conductivity is almost frequency independent throughout the FIR and MIR ranges. Below 200 K, a PG develops that has features similar to that of the c-axis conductivity (perpendicular to the CuO2 planes) of strongly underdoped YBCO [80]. The a-axis PG of SCCO has the same type of spectral shape, with a gradual suppression of the conductivity below the gap edge, Epg
, and a corresponding increase at higher energies due to a broad overshoot band that forms right above Epg
. Moreover, the magnitudes of Epg
and  compare quite well with those in the c-axis conductivity of YBCO.
The a-axis spectra of SCCO also contain several IR-active phonons some of which exhibit anomalous spectral shapes and strong temperature dependent changes [39, 79, 80]. These phonon anomalies have not been studied in detail and therefore have not yet been understood. Several phonon modes possess asymmetric line shapes and undergo anomalous changes in the vicinity of  . Most notable is a mode around 400 cm−1 that is rather weak at
  but becomes a very pronounced feature below
  . One may be tempted to speculate that this mode has the same origin as the tPM of underdoped YBCO, since it has a similar peak frequency and it almost vanishes at high temperatures. However, unlike the 400 cm−1 mode in SCCO, which is well developed already at 150 K, the tPM of underdoped YBCO remains rather weak and broad in the normal state and becomes a prominent feature only in the bulk SC state below Tc
. Moreover, in SCCO there exists an additional mode around 700 cm−1 of unknown origin that exhibits a similar anomaly. Alternatively, the modes at 400 and 700 cm−1 thus may be due to phonons that are activated in the PG state by an order that breaks (modifies) the translational symmetry of the underlying ladder lattice and thus gives rise to a Brilluoin-zone backfolding.
. One may be tempted to speculate that this mode has the same origin as the tPM of underdoped YBCO, since it has a similar peak frequency and it almost vanishes at high temperatures. However, unlike the 400 cm−1 mode in SCCO, which is well developed already at 150 K, the tPM of underdoped YBCO remains rather weak and broad in the normal state and becomes a prominent feature only in the bulk SC state below Tc
. Moreover, in SCCO there exists an additional mode around 700 cm−1 of unknown origin that exhibits a similar anomaly. Alternatively, the modes at 400 and 700 cm−1 thus may be due to phonons that are activated in the PG state by an order that breaks (modifies) the translational symmetry of the underlying ladder lattice and thus gives rise to a Brilluoin-zone backfolding.
1.2.2. c-axis response along the legs of the ladders.
The reported c-axis IR spectra for samples with x > 10 are composed of a rather narrow electronic band at low-frequencies and a much broader band that spans the MIR range (the so-called MIR-band) [39, 79, 80]. The low-frequency band gains a sizeable amount of SW and sharpens at low temperature. It appears to be peaked at a low but finite frequency which suggests that it arises from weakly localized, rather than from itinerant charge carriers. A charge localization is also suggested by the comparison with the dc resistivity data which show a characteristic upturn below about 50 K and yield dc conductivity values that are much lower than those at the peak of the low-frequency band [80]. The authors of [80] interpret the PG in the a-axis conductivity in terms of hole pairing and the low-frequency electronic band in the c-axis conductivity in terms of a collective oscillation of an ordered array of hole pairs, but the origin of the SW of the mode and its relation to the phonon anomalies have not been discussed.
2. Experimental
2.1. Sample preparation and experimental techniques
High-quality Sr2Ca12Cu24O41 single crystals were grown at PSI using a modified mirror floating zone furnace (Model: FZ-T-10 000-HVI-VP-PC, Crystal Systems Corp. Japan) with oxygen pressure up to 35 bar as described in [81]. The crystals were oriented with an x-ray Laue diffractometer and millimeter-sized ac- and ab-surfaces cut with a diamond wire-saw. These surfaces have been polished to optical grade using oil-based diamond paste. The Sr Cax
Cu24O41 crystals with a lower Ca content of x = 0 and 8 were grown as described in [82], their surfaces were also cut and polished as described above.
Cax
Cu24O41 crystals with a lower Ca content of x = 0 and 8 were grown as described in [82], their surfaces were also cut and polished as described above.
The oxygen isotope exchange of the SCCO crystal with x = 12 was performed using an experimental set-up as reported previously [83]. The exchange was performed in 98% enriched 18O2 gas (1.2 bar) at 550 ∘C for 200 h, followed by cooling with a rate of 20 ∘C h−1 down to room temperature. The same crystal was first measured in its pristine state with 16O, was subsequently exchanged with 18O and measured, and finally back exchanged to 16O and remeasured.
A pair of strongly underdoped YBa2Cu3O6.5 crystals with either 16O or 18O isotopes was prepared by annealing under identical conditions in isotope enriched oxygen gas atmosphere. The samples were taken through six cycles of 24 h annealing in 0.9 atm of either 98% enriched 18O2 or natural 16O2 at 786 ∘C, corresponding to an equilibrium oxygen content of x = 0.5 [84]. After each annealing step, the sample chamber was air quenched and the 98% enriched 18O2 gas was replaced. At the end of the final annealing treatment the sample chamber was rapid-quenched in water to avoid any further oxygen uptake. The overall mass change of the 18O crystal, before and after the 18O treatment, was consistent with a 95% exchange of all oxygen sites.
For the Sr Cax
Cu24O41 single crystals with x = 0, 8 and 12 the infrared reflectivity spectra were measured at a near-normal incidence angle with a Bruker VERTEX 70v Fourier-transform infrared (FTIR) spectrometer. The incident light was polarized with a free-standing wire grid polarizer, that was oriented either along the a-, b-, or c-axis direction, and the reflectivity spectra were normalized with an in situ gold overfilling technique [85]. The spectra from 30 to 20 000 cm−1 were collected at temperatures between 5 and 300 K with the sample mounted in an ARS-Helitran cryostat. In the near-infrared to ultraviolet range (4000–50 000 cm−1) the complex optical response function at room temperature was measured with a commercial ellipsometer (Woollam VASE). The optical conductivity and related response functions and constants were obtained by performing a Kramers–Kronig analysis of the
Cax
Cu24O41 single crystals with x = 0, 8 and 12 the infrared reflectivity spectra were measured at a near-normal incidence angle with a Bruker VERTEX 70v Fourier-transform infrared (FTIR) spectrometer. The incident light was polarized with a free-standing wire grid polarizer, that was oriented either along the a-, b-, or c-axis direction, and the reflectivity spectra were normalized with an in situ gold overfilling technique [85]. The spectra from 30 to 20 000 cm−1 were collected at temperatures between 5 and 300 K with the sample mounted in an ARS-Helitran cryostat. In the near-infrared to ultraviolet range (4000–50 000 cm−1) the complex optical response function at room temperature was measured with a commercial ellipsometer (Woollam VASE). The optical conductivity and related response functions and constants were obtained by performing a Kramers–Kronig analysis of the  spectra [76]. For the low-frequency extrapolation below 30 cm−1, we used a Hagen-Rubens function (
 ) for the conducting samples and a constant for the insulating ones. On the high-frequency side, the extrapolation was anchored with the room-temperature ellipsometry data.
The measurements of the far-infrared c-axis response (100–650 cm−1) of the pair of strongly underdoped YBa2Cu3O6.5 crystals with either 16O or 18O oxygen isotopes ( K) were performed at the infrared beamline of the KARA (formerly ANKA) synchrotron at the Karlsruhe Institute of Technology (KIT) using a homebuilt ellipsometer that is attached to a Bruker 66v Fourier transform infrared (FTIR) spectrometer as described in [86]. The ellipsometric response was measured on an ac-plane of the plate-like crystals with the plane of incidence of the infrared light parallel to the c-axis and the incidence angle set to 75 degree. The obtained spectra of the c-axis pseudo-dielectric function have not been corrected for anisotropy effects, since they are known to cause only small changes to the absolute values of the c-axis response and, in particular, not to cause artificial spectroscopic features [86].
The a-axis response of a detwinned YBa2Cu3O6.6 single crystal with  K was measured with reflectivity using the reflectivity setup described above for the Sr
 Cax
Cu24O41 crystals. For the Kramers–Kronig analysis of the measured
Cax
Cu24O41 crystals. For the Kramers–Kronig analysis of the measured  spectra we used the reffit program [87]. In addition, its complex a-axis dielectric function was determined with infrared ellipsometry at the infrared beamline of the KARA Synchrotron in the range from 100 to 4000 cm−1 at an incidence angle of 80 degree.
The SC transition temperatures of the YBa2Cu3O crystals were determined from dc susceptibility measurements where Tc
was defined as the midpoint of the onset of the diamagnetic signal.
crystals were determined from dc susceptibility measurements where Tc
was defined as the midpoint of the onset of the diamagnetic signal.
2.2. Experimental data
We start with the discussion of the optical response of the Sr2Ca12Cu24O41 crystal (x = 12) along the a-axis parallel to the rungs of the two-leg ladders. Figure 2(a) shows, for representative temperatures, the spectra of the measured reflectivity,  . Figure 2(b) displays the corresponding spectra of the real part of the optical conductivity,
  , that have been derived with a Kramers–Kronig transformation, as described in the experimental section above.
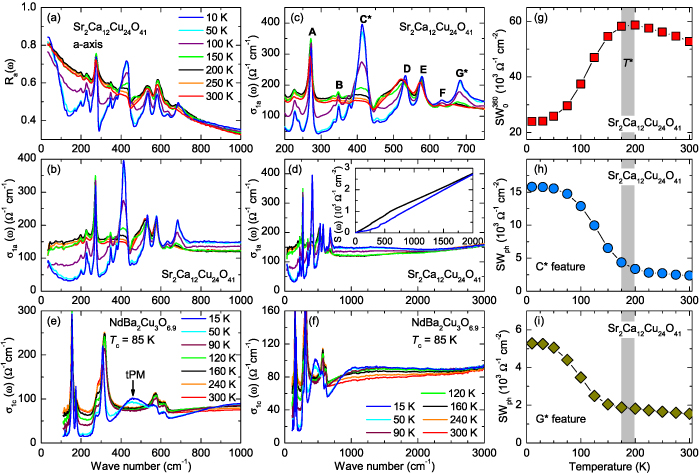
Figure 2. Infrared response along the a-axis (parallel to the rungs) of Sr2Ca12Cu24O41. Temperature dependence of the spectra of (a) the measured reflectivity,  , and (b) the derived real part of the optical conductivity
  . (c) Magnified view of the sharp features in the
  spectra due to infrared-active modes showing the anomalous temperature dependence of some of them. The assignment of the modes A to G is discussed in the text. (d) Conductivity spectra shown over a wider frequency range that captures the PG-like redistribution of the electronic SW from frequencies below
  cm−1 to a broad overshoot band above Epg
that extends to about 2200 cm−1. Inset: Frequency dependence of the integrated SW,
cm−1 to a broad overshoot band above Epg
that extends to about 2200 cm−1. Inset: Frequency dependence of the integrated SW,  , at 200 K slightly above the onset temperature
  and at 10 K. Panels (e) and (f) show, for comparison, the c-axis conductivity spectra of weakly underdoped NdBa2Cu3O6.9 with
  K (reproduced from [55]). They reveal a similar PG effect that sets in at temperatures far above Tc
and gives rise to a suppression of the conductivity below
K (reproduced from [55]). They reveal a similar PG effect that sets in at temperatures far above Tc
and gives rise to a suppression of the conductivity below  cm−1 and a transfer of the missing low-frequency SW to a broad overshoot band above Epg
. The c-axis spectra of NdBa2Cu3O6.9 also show an anomalous temperature dependence of some of the phonon modes and the transverse plasma mode (tPM) around 450 cm−1 that becomes very pronounced below Tc
. (g) Temperature dependence of the low-frequency SW,
cm−1 and a transfer of the missing low-frequency SW to a broad overshoot band above Epg
. The c-axis spectra of NdBa2Cu3O6.9 also show an anomalous temperature dependence of some of the phonon modes and the transverse plasma mode (tPM) around 450 cm−1 that becomes very pronounced below Tc
. (g) Temperature dependence of the low-frequency SW,  , in the a-axis response of Sr2Ca12Cu24O41, which reveals that the partial gap in the electronic response has an onset (or crossover) temperature of
  –200 K. (h) and (i) Temperature dependencies of the SW of the features C* and G* around 400 cm−1 and 700 cm−1, respectively.
Download figure:
Standard image High-resolution imageFigure 2(c) shows a magnified view of the spectral range of the narrow infrared active modes some of which exhibit a very anomalous temperature dependence. The modes, whose origin is further discussed in sections 2.3 and 3, are labeled from A to G* in the order of increasing frequency. The modes near 400 and 700 cm−1 are especially marked as C* and G* since they exhibit a very anomalous temperature dependence, i.e. they are very weak above 200 K and become pronounced features only in the PG state below  . These anomalous modes were previously noted in [80], but their origin remained unclear. In particular, it is not known whether they are due to infrared-active phonons or rather related to some electronic excitations. The overall electronic contribution to the
  spectra is almost frequency independent and featureless between 300 and 200 K. This changes below an onset temperature
  –200 K where a partial suppression of the conductivity develops at low frequencies (
 600 cm−1). Figure 2(d) shows the conductivity spectra for the frequency range up to 3000 cm−1 which reveal that the SW loss below the PG energy
  cm−1 is compensated by a broad overshoot band above Epg
that extends to about 2200 cm−1. This is evident from the inset of figure 2(d) which displays the integrated SW,
cm−1 is compensated by a broad overshoot band above Epg
that extends to about 2200 cm−1. This is evident from the inset of figure 2(d) which displays the integrated SW,  , at 200 K and 10 K and confirms that they are matched above 2200 cm−1.
Figures 2(e) and (f) show the corresponding c-axis conductivity spectra of a weakly underdoped NdBa2Cu3O6.9 crystal that have been adopted from [55]. They highlight that the electronic conductivity spectra have a surprisingly similar shape and exhibit the same kind of PG phenomenon with a suppression of the conductivity below  cm−1 and a transfer of the missing low-frequency SW to a broad overshoot band above Epg
that develops already far above Tc
. The c-axis spectra of NdBa2Cu3O6.9 also contain infrared-active phonon modes some of which exhibit an anomalous temperature dependence and a transverse plasma mode (tPM) around 450 cm−1. The latter becomes a pronounced feature only below Tc
and seems to have a resemblance to the C* feature at 400 cm−1 in the a-axis response of Sr2Ca12Cu24O41, which is also strongest at low temperature and becomes very weak toward high temperatures.
cm−1 and a transfer of the missing low-frequency SW to a broad overshoot band above Epg
that develops already far above Tc
. The c-axis spectra of NdBa2Cu3O6.9 also contain infrared-active phonon modes some of which exhibit an anomalous temperature dependence and a transverse plasma mode (tPM) around 450 cm−1. The latter becomes a pronounced feature only below Tc
and seems to have a resemblance to the C* feature at 400 cm−1 in the a-axis response of Sr2Ca12Cu24O41, which is also strongest at low temperature and becomes very weak toward high temperatures.
Figure 2(g) details the temperature dependence of the PG-like, partial suppression of the electronic a-axis conductivity of Sr2Ca12Cu24O41 in terms of the integrated low-energy SW,  . Whereas
  increases slightly between 300 and 200 K, it exhibits a pronounced decrease below an onset temperature
  –200 K. Figures 2(h) and (i) show the temperature dependencies of the oscillator strengths of the features C* and G*, respectively, that were obtained by fitting the spectral structures with Lorentzian oscillators as detailed in the appendix
  . This coincidence suggests that the modes C* and G*, if of phononic origin, are activated by the coupling to some electronic excitations that appear (or are strongly enhanced) in the PG state below
  .
.
Figure 3 shows the corresponding a-axis infrared spectra of a Sr6Ca8Cu24O41 (x = 8) crystal for which the hole doping of the two-leg ladders is slightly reduced as compared with Sr2Ca12Cu24O41 (x = 12) [39]. The spectra in figure 3(b) reveal the same kind of PG effect as those of the x = 12 sample in figures 2(b) and (d). The onset frequency of the gap-like suppression, Epg
, and the growth of the broad overshoot band above the gap edge are somewhat obscured here by an overall decrease of the electronic conductivity that starts already at 300 K and is weakly frequency dependent. The latter is likely related to a redistribution of some of the holes from the ladder layers to the chain layers that occurs as the temperature is reduced, as discussed, e.g. in [39]. In order to highlight the characteristic PG features, we have normalized the conductivity spectra to the value at  cm-1, a frequency that is above the energy scale of the PG. The result shown in figure 3(c) reveals an onset of the conductivity suppression at
  cm−1 and a clear overshoot band that starts above the gap edge and extends up to about 2300 cm−1. Figure 3(d) displays the temperature dependence of the PG effect in terms of the low-frequency SW,
  . It reveals an onset of the conductivity suppression around
  ≈ 200–220 K. The temperature and energy scales of the PG,
  and Epg
, thus tend to increase as the hole doping of the ladders is reduced. Note that this parallels the trend of the PG in the c-axis response of underdoped YBCO for which the onset temperature and gap energy are also increasing toward the underdoped side of the hole doping phase diagram [55, 56]. Figures 3(e) and (f) display the corresponding temperature dependencies of the oscillator strengths of the features C* and G* around 400 cm−1 and 700 cm−1, respectively, that were obtained by fitting the spectral structures with Lorentzian oscillators as detailed in appendix
and Epg
, thus tend to increase as the hole doping of the ladders is reduced. Note that this parallels the trend of the PG in the c-axis response of underdoped YBCO for which the onset temperature and gap energy are also increasing toward the underdoped side of the hole doping phase diagram [55, 56]. Figures 3(e) and (f) display the corresponding temperature dependencies of the oscillator strengths of the features C* and G* around 400 cm−1 and 700 cm−1, respectively, that were obtained by fitting the spectral structures with Lorentzian oscillators as detailed in appendix  .
.
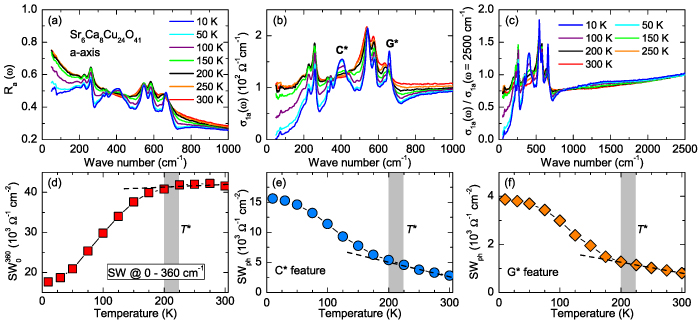
Figure 3.
a-axis infrared response of a Sr6Ca8Cu24O41 single crystal. Panels (a) and (b) show the temperature dependence of the reflectivity,  , and of the real part of the optical conductivity,
  , respectively. Panel (c) displays the
  spectra up to higher frequencies and normalized to the value at 2500 cm−1 to highlight the PG features in the broad electronic background, i.e. the suppression of SW below
  820 cm−1 and a corresponding growth of a broad overshoot band between about 820 and 2300 cm−1. (d) Temperature dependence of the PG in terms of the low-frequency SW,
  . The onset of the PG at
  ≈ 200–220 K is marked by a shaded bar. (e) and (f) Corresponding temperature dependencies of the oscillator strengths of the features C* and G* around 400 cm−1 and 700 cm−1, respectively. Both modes can be seen to exhibit an anomalous increase that sets in the vicinity of
  .
.
Download figure:
Standard image High-resolution imageFigure 4 shows a comparison of the far-infrared active modes that appear in the a-axis conductivity spectra at 300 K for the Sr Cax
Cu24O41 crystals with x = 0, 8 and 12. Similar spectra have been obtained in earlier studies [39, 79, 80, 88]. The notation of the features for the spectrum at x = 12 has been adopted from figure 2(c). The peaks A and B are strongly blue-shifted upon Ca substitution, as indicated by the dotted lines, and are therefore assigned to phonon modes that involve mainly vibrations of the Sr/Ca ions. The phonon modes with a predominant contribution of the oxygen ions are expected at considerably higher frequencies in the range from about 500–650 cm−1. The lattice-dynamical calculations for the ladder plane of [89] predict two a-axis polarized oxygen modes, the leg oxygen mode at 570 cm−1 and the rung oxygen mode at 640 cm−1, respectively. For the corresponding displacement patterns, see figure 5. A corresponding chain oxygen mode, that is not included in the calculations of [89], is expected at an intermediate frequency. Accordingly, we preliminarily assign the structures D, E, and F to the leg-oxygen, chain-oxygen, and rung-oxygen modes, respectively. The splitting between the peaks D and E is the largest at x = 12. For x = 0 the coupling between the oscillations of the leg oxygens and those of the chain oxygens seems to give rise to only one pronounced peak around 555 cm−1. Especially for the peaks D and F, it can be seen that their oscillator strengths, positions and asymmetries exhibit a strong variation as a function of the Ca content. In particular, the rung-oxygen mode F is a sharp and pronounced feature at x = 0 whereas it becomes broadened and much weaker at x = 12. Likewise, the leg-oxygen mode D for x = 12 is strongly red-shifted and highly asymmetric as compared to x = 0. In section 3 we will show that these trends can be understood in terms of a coupling of these phonons to electronic excitations within the ladders.
Cax
Cu24O41 crystals with x = 0, 8 and 12. Similar spectra have been obtained in earlier studies [39, 79, 80, 88]. The notation of the features for the spectrum at x = 12 has been adopted from figure 2(c). The peaks A and B are strongly blue-shifted upon Ca substitution, as indicated by the dotted lines, and are therefore assigned to phonon modes that involve mainly vibrations of the Sr/Ca ions. The phonon modes with a predominant contribution of the oxygen ions are expected at considerably higher frequencies in the range from about 500–650 cm−1. The lattice-dynamical calculations for the ladder plane of [89] predict two a-axis polarized oxygen modes, the leg oxygen mode at 570 cm−1 and the rung oxygen mode at 640 cm−1, respectively. For the corresponding displacement patterns, see figure 5. A corresponding chain oxygen mode, that is not included in the calculations of [89], is expected at an intermediate frequency. Accordingly, we preliminarily assign the structures D, E, and F to the leg-oxygen, chain-oxygen, and rung-oxygen modes, respectively. The splitting between the peaks D and E is the largest at x = 12. For x = 0 the coupling between the oscillations of the leg oxygens and those of the chain oxygens seems to give rise to only one pronounced peak around 555 cm−1. Especially for the peaks D and F, it can be seen that their oscillator strengths, positions and asymmetries exhibit a strong variation as a function of the Ca content. In particular, the rung-oxygen mode F is a sharp and pronounced feature at x = 0 whereas it becomes broadened and much weaker at x = 12. Likewise, the leg-oxygen mode D for x = 12 is strongly red-shifted and highly asymmetric as compared to x = 0. In section 3 we will show that these trends can be understood in terms of a coupling of these phonons to electronic excitations within the ladders.
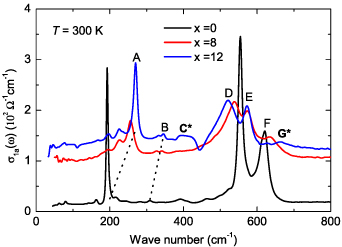
Figure 4. Comparison of the far-infrared spectra of the a-axis conductivity at 300 K of the Sr Cax
Cu24O41 crystals with x = 0, 8 and 12. The notation of the features at x = 12 with the letters A to G has been adopted from figure 2(c).
Cax
Cu24O41 crystals with x = 0, 8 and 12. The notation of the features at x = 12 with the letters A to G has been adopted from figure 2(c).
Download figure:
Standard image High-resolution image
Figure 5. (a) Schematic representation of the atomic structure of a single ladder plane consisting of Cu2O3 ladders. The blue and red circles denote copper and oxygen atoms, respectively. The blue lines represent the legs and rungs of the ladders. Displacement patterns associated with the infrared active rung- and leg-oxygen phonon modes are shown in (b) and (c), respectively.
Download figure:
Standard image High-resolution image2.3. Assignment of the anomalous peaks C* and G*
This leaves us with the assignment of the modes C* and G* that are very weak at 300 K but increase anomalously in strength below  . The lattice origin of these anomalous modes has been confirmed by a study of the oxygen isotope-effect on the a-axis infrared conductivity spectra for which the result is displayed in figure 6(a). Here the modes C* and G* can be seen to exhibit an oxygen-isotope shift on the order of 10 cm−1 (indicated by the dashed lines) that is of a similar magnitude as that of the regular, ladder-related phonon modes D and F. The circumstance that the magnitudes of these isotope shifts of about 10 cm−1 or 1.5%–2% are considerably lower than the maximal theoretical value (for which we neglect the contributions of the cations that are expected to be small for such high-frequency modes) of
  can be understood in terms of an only partial (about 50%) substitution of 18O for 16O. The somewhat smaller isotope shift of the chain related phonon mode E of about 6 cm−1 may indicate that the 16O to 18O exchange rate in the chain layers is even somewhat lower than in the ladder layers. Irrespective of these partial exchange rates of the oxygen isotopes, the similar isotope shifts of the anomalous C* and G* modes on one hand and those of the regular D and F phonons on the other hand, establish that the former modes are also predominantly of phononic origin. While they cannot be assigned to regular infrared active phonon modes from the Brillouin-zone center, we outline in section 3 that they correspond to off-center phonon modes that are activated by a strong coupling to electronic excitations of a charge ordered state that develops below
  within the two-leg ladders. Note that the very weak structures above
  are likely activated by the disorder due to the randomly distributed Ca and Sr ions.

Figure 6. (a) Oxygen isotope effect on the a-axis conductivity (along the rungs of the ladders) of a Sr2Ca12Cu24O41 crystal. The spectra show a clear oxygen-isotope shift (as indicated by the dashed lines) not only for the regular phonon modes D, E and F but also for the anomalous modes C* and G*. (b) Oxygen isotope effect on the c-axis infrared conductivity (perpendicular to the CuO2 planes) of YBa2Cu3O6.5. The spectra reveal that the oxygen-isotope effect on the broad mode around 400 cm−1 is negligible as compared to the one of the regular phonon modes.
Download figure:
Standard image High-resolution imageFigure 6(b) shows the result of a corresponding oxygen isotope effect study for the c-axis conductivity of strongly underdoped YBa2Cu3O6.5. Here the highest IR-active phonon mode exhibits an isotope shift of about 30 cm−1 that is close to the theoretical value for a 100% exchange rate and a pure oxygen character of the phonon mode. Despite the large oxygen isotope shifts of the high energy infrared-active phonon modes of about 30 cm−1, it is evident that the broader mode around 410 cm−1 shows no sign of a corresponding isotope shift. This lack of an oxygen isotope effect highlights that this mode has a predominantly electronic origin, in agreement with its assignment to an electronic transverse plasma mode (tPM) [61–63]. Its similar location to the C* mode of SCCO at x = 12, which is a feature clearly due to a phonon, thus appears to be accidental.
3. Interpretation and modeling of the phonon anomalies in the a-axis response of SCCO
In section 3.1 we introduce a qualitative picture of the relevant aspects of the charge dynamics of the ladder planes of SCCO that culminates in the proposed interpretation of the anomalous peaks C* and G*. In sections 3.2 and 3.3 we present phenomenological models, which allow us to reproduce and understand essential features of the phonon anomalies. Corresponding fits of the high- and low-temperature data are shown in section 3.4.
3.1. Preliminary interpretation of peaks C* and G*
For the interpretation of the peaks C* and G*, we adopt the following rough picture of the charge dynamics of the ladder planes that is based on model calculations and supported by experimental data (for reviews, see [28, 39, 90]).
We assume that at high temperatures and low hole concentrations the holes behave approximately independently. The a-axis charge dynamics involves effective intra-ladder and inter-ladder hoppings, see figure 3 of [91] for a schematic representation. The inter-ladder hopping matrix elements are considerably smaller than the main intra-ladder one,  in the notation of Müller et al [91]. In a first approximation, the inter-ladder matrix elements thus can be neglected. The matrix element
  gives rise to two bands—bonding and antibonding—with the energy difference (at the simplest tight binding level) of 2
  and the corresponding electronic transitions from the bonding to the antibonding band. However, the correlation effects are known to strongly reduce the magnitude of the interband splitting and thus the energy of the interband transitions. For example, recent density matrix renormalization group (DMRG) calculations for the problem of one doped hole in a two-leg t-J ladder performed by White et al [92] yield values of the interband splitting which are an order of magnitude lower than 2
  . We therefore assume that for concentrations of 10%–25% doped holes, i.e. in the range that is relevant to the Ca doped ladders, the bonding–antibonding interband transition occurs at a rather low energy and is overdamped. Accordingly, at high temperatures the a-axis conductivity is codetermined by this overdamped transition and by an incoherent or weakly coherent inter-ladder hopping.
At low temperatures, the holes are expected to form vertical pairs [27, 93–96], i.e. pairs with one hole in the bottom leg of a ladder and the other hole nearby in the upper leg. For a schematic representation of the hole pair of a t-J ladder, see figure B.1. The spins will be ordered accordingly, in the limit of weak inter-rung coupling they form rung singlets. The PG in the a-axis conductivity, i.e. the decrease of  at low frequencies with decreasing temperature, that results in a (partial) gap feature, is most likely determined by the hole pairing and/or by the spin correlations.
Note that a PG of comparable size occurs also in the low-temperature a-axis conductivity spectra computed using the t-J model. Figure 7 shows our calculated spectra of the a-axis (along-the-rung) conductivity of a single ladder and of the a-axis inter-ladder conductivity. The latter has been computed assuming a weak inter-ladder coupling. Both of them can be seen to display a PG of about 0.2 eV. The macroscopic a-axis conductivity can be expressed as a weighted average of the two components with model- and frequency-dependent weights. For details of the calculations and the relation between the PG and the quasiparticle spectral function, see appendix B.3.
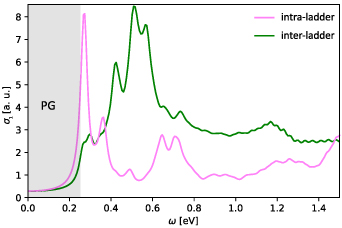
Figure 7. Spectra of the real part of the intra-ladder (along-the-rung) conductivity and of the inter-ladder conductivity calculated using the t-J model for a ladder of 10 rungs and 4 doped holes, the values of the essential input parameters are  eV,
eV,  eV,
eV,  eV,
eV,  eV. Details are given in appendix B.3. The shaded area marks the PG region.
Download figure:
Standard image High-resolution imageThe experimental finding, that the infrared active modes C* and G* originate from off-zone-center lattice vibrations strongly suggests that the hole pairs develop an ordered pattern. This conclusion agrees with earlier resonant soft x-ray scattering [43, 44] and Raman scattering [97] experiments which indicate that the hole pairs form a crystal with a spacing (along the legs) of five or three lattice parameters. To some extent, the pair ordering can also be identified in hole correlation functions, see appendix B.2.
The origin of the peaks C* and G* can now be qualitatively understood using the schematic representation of the hole pattern shown in figure 8. The thick blue lines indicate the locations of the hole pairs. The electromagnetic radiation induces (hole) charge oscillations between the legs. The resulting dynamic charge redistribution is indicated by the ± signs in the figure. It modifies the electric field driving the lattice vibrations, such that the leg-oxygen phonon mode with the displacement pattern represented by the red arrows is excited. The same coupling mechanism applies to the analogous rung-oxygen phonon mode. According to the calculations by Nunner et al [89], the frequency of the relevant leg (rung) oxygen mode is considerably lower (slightly higher) than the corresponding zone-center frequency. We thus propose that the off-center leg and rung modes correspond to the peaks C* and G*, respectively, in figures 2(c), 3(b), 4 and 6(a).

Figure 8. Schematic representation of the considered ordering pattern of the hole pairs. The thick blue lines indicate the locations of the holes and the corresponding areas of charge redistribution in response to the external field. The red arrows show the displacement pattern of the leg-oxygen mode that is activated by the (dynamical) charge modulation as discussed in the text. The color coding is the same as in figure 5 with atom sizes reduced for visual clarity.
Download figure:
Standard image High-resolution image3.2. Model of the phonon anomalies in the high-temperature state above with a homogeneous charge distribution

In the high-temperature state above  the hole density of the ladder planes can be expected to be uniform. As discussed in section 3.1, the matrix element of the intra-ladder hopping (along-the-rungs) is considerably larger than the inter-ladder hopping matrix elements. For this reason, electromagnetic radiation polarized along the a-axis brings about a charging of the legs. In order to describe the related physics in simple terms, we approximate the legs by homogeneously charged cylinders of radius c, c = 0.8 Å, for a schematic representation of the geometry of the model, see figure 9(a). Note that the results are not significantly affected by moderate changes of c. The field-induced (linear) charge densities are denoted by
  . They are related to the intra-ladder and inter-ladder current densities (defined as currents per unit area perpendicular to the rungs),
  and
and  , respectively, via the continuity equation:

here  is the distance between neighboring ladder planes, see figure 9(a).
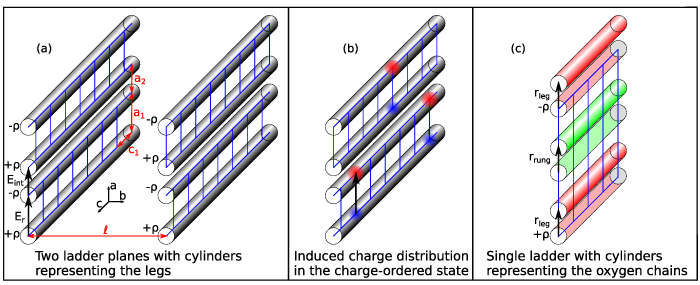
Figure 9. (a) Schematic representation of the model used to describe the high-temperature state with a homogeneous hole distribution on the ladders. Shown are segments of two neighboring ladder planes. Legs of the ladders are approximated by homogeneously charged cylinders. (b) For the model used to describe the charge ordered state at low temperature (below  ) it is assumed that induced charges reside in a set of spheres (red and blue denoting opposite signs). Panel (c) shows the cylinders representing the chains of the leg-oxygens (in red) and the cylinder representing the chain of the rung-oxygens (in green) of a ladder in their equilibrium and displaced positions. For the sake of simplicity, the induced (hole) charge densities
  are assumed to be bound to the copper sites and not to participate in the vibrations; their displacement is not taken into account. Note that the figures are not to scale, for visual clarity, the inter-ladder distances
  are doubled, and a1 is increased in (c). The other symbols are explained in the text.
Download figure:
Standard image High-resolution imageThe current densities are assumed to be proportional to the a-axis-components  and
and  of the intra-ladder and inter-ladder local electric fields
  and
and  :
:

The quantities  and
and  will be denoted as local conductivities. The local fields
  and
and  are defined as the averages of the total electric field over the lines connecting the centers of the cylinders, that are represented by the thick arrows in figure 9(a). The densities
  influence both the average electric field
  (a-axis-component labeled
  ) and the fields
  and
and  ,
,
here  is the a-axis component of the part of the average internal field that is not due to the effects of
  , and α,
  ,
,  are model parameters. Their numerical values have been obtained using electrostatic calculations described in appendix
  describes the screening by high-energy excitations that are not included explicitly in the present effective model. Finally, the macroscopic conductivity σa
is given by:
describes the screening by high-energy excitations that are not included explicitly in the present effective model. Finally, the macroscopic conductivity σa
is given by:

where  are lattice parameters, see figure 9(a). The expression on the right hand side represents the volume average of the a-axis current density. This closed set of equations [98, 99] allows us to express
  in terms of the local conductivities
  and
and  .
.
Table 1. Numerical values of the parameters entering the model equations of section 3.2 ('homogeneous model') and of section 3.3 ('dipole model'). They have been obtained by electrostatic calculations described in appendices  , and
, and  are model independent. For fitting the experimental data, different values of some of the parameters were used. They are given in the brackets. For the present setup (i.e.
 ), the values of
  have no impact on the results, those of the dipole model are therefore not included. The values of the lattice parameters used in our calculations are
  Å,
Å,  Å,
Å,  Å.
Å.
| α = 0.685 |

|

| |
|---|---|---|---|
| homog. model |

|

|
|

|

|

| |

|
| ||
| dipole model |

|

|

|
[ used in figure 12] used in figure 12] |

|

| |

|

| ||

|
|
Next, we present an extension of the above equations that includes the rung-oxygen mode and the leg-oxygen mode. For the sake of simplicity, the chains of rung oxygens belonging to one ladder and the chains of leg oxygens belonging to one leg are approximated by solid cylinders of radius c that are homogeneously charged, see figure 9(c). The advantage of the above approximations is that all contributions to the internal electric field, that are induced by the incoming a-axis polarized electromagnetic radiation, are also a-axis polarized and depend on the a-axis coordinate only. Whereas the (a-axis components of the) fields driving the oxygen ions, i.e. the cylinders in figure 9(c),  and
and  , are influenced by
  , the oxygen displacements have impact on the fields
  ,
,  , and
, and  . The dynamics of the combined system of holes and lattice vibrations is described by the following set of equations:

Here  and
and  are the macroscopic polarizations due to the rung and the leg mode, respectively, that are connected to the fields
  and
and  as follows:
  ,
,  . The symbols ri
, ni
, Qi
, χi
denote the a-axis displacements of the cylinders representing the oxygen chains (see figure 9(c)), densities of the (rung/leg) oxygens, effective charges of the (rung/leg) oxygens, and the phonon polarizabilities, respectively. The polarizabilities have been expressed in terms of Lorentzian functions:
. The symbols ri
, ni
, Qi
, χi
denote the a-axis displacements of the cylinders representing the oxygen chains (see figure 9(c)), densities of the (rung/leg) oxygens, effective charges of the (rung/leg) oxygens, and the phonon polarizabilities, respectively. The polarizabilities have been expressed in terms of Lorentzian functions:  . The values of Qi
have been set to
. The values of Qi
have been set to  , where e is the elementary charge, and the values of oxygen plasma frequencies
  have been obtained as
  , where
  is the oxygen mass. Appendix
  . Their numerical values are given in table 1. In our calculations we do not consider direct coupling between the leg-oxygen and the rung-oxygen vibrations, i.e. we set λ = 0.
Next, we demonstrate that the model allows us to reproduce and interpret the doping-induced suppression of the rung-oxygen phonon peak (feature F in figures 2(c), 4 and 6(a)) and the asymmetry and broadening of the leg-oxygen phonon peak (feature D in figures 2(c), 4 and 6(a)). Figure 10 shows the spectra of the real part of the macroscopic conductivity  , calculated using the model equations with
  ,
,  given by a frequency independent constant (details of the ω-dependence were found to be of minor importance) and
  =3.5. Panels (a)–(c) present results of the calculations which take into account only the rung-oxygen mode (
 ,
,  cm−1,
cm−1,  cm−1), only the leg-oxygen mode (
 ,
,  cm−1,
cm−1,  cm−1), or both phonon modes, respectively.
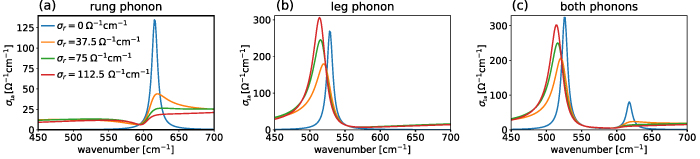
Figure 10. Spectra of the real part of  calculated with
  and
and  given by a frequency independent constant. In panel (a) only the rung oxygen phonon is considered, in panel (b) only the leg oxygen one, and in panel (c) both phonon modes are included. The latter panel reveals a noticeable interaction between the two phonons that is mediated via
  .
.
Download figure:
Standard image High-resolution imagePanel (a) shows that the SW of the rung-oxygen resonance decreases strongly with increasing  . This trend agrees with the doping dependence of the phonon feature F in the experimental spectra of figure 4 which becomes much weaker as the Ca content (and thus the conductivity) increases. This behavior can be qualitatively interpreted using figure 9(c). Here the (hole) charge oscillations between the legs (
 in the figure) give rise to a pronounced suppression of the phonon driving field
  [determined by the second term on the right hand side of equation (8)] that can be expected to decrease the SW of the phonon-related structure. This interpretation is supported by our analysis of the spectra of
  in Figure 11(a) that shows, for the case of
  cm−1, the spectra of the real part of
  (solid blue line), the corresponding hole- and phonon-contributions (solid orange and green lines, respectively), and, as a reference, the corresponding spectrum of
  for
for  (dotted red line). Figure 11(b) displays the real and imaginary components of the ratio
  . It confirms that the magnitude of the local field is suppressed and that its maximum is shifted below the frequency of the resonance in the polarizability
  .
.
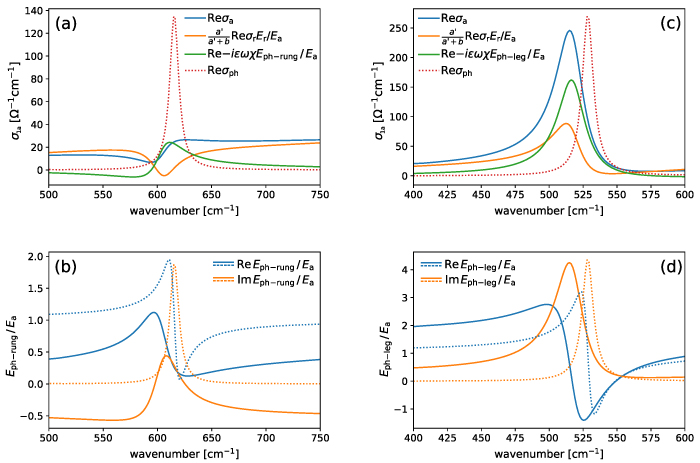
Figure 11. Spectra of (a) the real part of  calculated with
  cm−1 and only the rung-oxygen phonon (feature (F) included (blue line), the hole component (orange line), the phonon component (green line). Also shown is the reference spectrum for
  (dotted line). (b) Corresponding spectra of the real and imaginary parts of the ratio
  (solid lines) and the reference spectra for
  (dotted lines). (c) and (d) The same for the leg-oxygen phonon (feature (D).
Download figure:
Standard image High-resolution imageFor the leg phonon peak (D) the following changes are predicted to take place with increasing  (see figure 10(b)): A shift toward lower frequencies, a SW increase, and an increased broadening and asymmetry. The redshift as well as the increase of the broadening and the asymmetry are consistent with the observed doping dependence reported in figure 4. The origin of these changes can be understood in terms of the change of the phonon-driving local field that is documented in figure 11(d).
3.3. Model of the phonon anomalies in the charge ordered state below ('dipole model')

As discussed in section 3.1, the large SWs of the phonon peaks C* and G* in the low-temperature conductivity spectra indicate that the ground state exhibits a charge ordering. Based on results of previous theoretical [100, 101] and experimental studies [41, 43, 44, 97], we conjecture that at low temperatures holes are forming vertical pairs that develop a pattern as shown in figure 8. The lattice spacing of these hole pairs may differ, they may also fluctuate both in space and in time (at time scales longer than those of the phonons). For concreteness and for the sake of simplicity, we adopt here the order of figure 8 with a period of five lattice spacings along the legs. Accordingly, we have modified the model presented in section 3.2 for the high-temperature phase with a homogeneous charge distribution, as described in the following.
- (1)The field-induced charge densities reside on spheres of radius c, see figure 9(b). The spheres are assumed to be homogeneously charged. The corresponding (linear, averaged over a leg) charge densities are denoted by, as in the homogeneous case. The intra-ladder current density is assumed to be concentrated on the rungs surrounded by the charged spheres, and the driving field is obtained as the average of the total electric field over the line connecting the sphere centers, that is represented by the black arrow in figure 9(b). The contribution of the two spheres to includes a self-interaction component to be discussed below.
- (2)Leg-oxygen- and rung-oxygen-phonons with wave vector components, are included. The displacement pattern of the leg-oxygen phonon under consideration is shown in figure 8. The displacement of the oxygens at the nc
-th rung, in the na
-th ladder is given by
. The pattern of the rung-oxygen mode is analogous. Modulation along the b direction (perpendicular to the ladder planes) does not affect the results significantly. The modes are excited due to the charge modulation by the relevant Fourier components , , of the total electric field. The modes do not contribute to the macroscopic polarization. In order to simplify the notation, however, we define the corresponding auxiliary polarizations as .
- (3)In order to clarify the notation, the quantities related to the zone-center phonons, originally Pi ,, χi
, etc , will be denoted with the superscript +, i.e. , , , etc. The quantities related to the off-center modes will be denoted with the superscript −.
- (4)The values of the model parameters γd ,, , etc. have been obtained using electrostatic calculations involving the present geometry (see appendix
D for details) and are given in table 1.


![$(a_1+a_2)]$](https://content.cld.iop.org/journals/0034-4885/86/4/044502/revision2/ropacbe4fieqn204.gif)


This system is described by the following set of equations for the rung direction components of the vectors:
where i runs over {rung, leg} and j over  ; the quantities
  stand for averages over the c-axis. The continuity equation (1) is formally unchanged. In this model, the intra-ladder conductivity will be denoted by a superscript
  ('dipole'),
  , to avoid confusion.
The value of the parameter  of equation (12) is very high and almost entirely due to the contribution of the two spheres mentioned in (1). This contribution to the field, however, should not be included (at least not fully) because it is due (at least partially) to an unphysical self-interaction term. If we exclude this contribution, we obtain the very small and negative value of
  presented in table 1. The parameter
  is sensitive to many details that are, within the present model, not under control (extent of the pairs, degree of modulation, etc). We have, therefore, adjusted the value of this particular parameter considering the experimental data. A reasonable qualitative agreement with the data is obtained for
  (see appendix
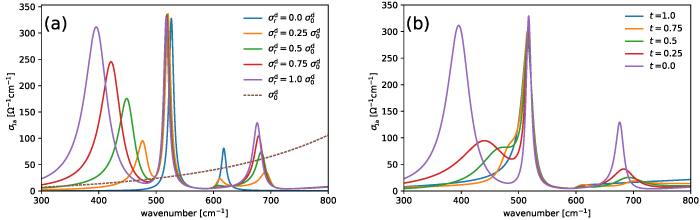
Figure 12. (a) Spectra of the real part of  calculated using our model of the low-temperature (
 ) ordered phase with
  and a Lorentzian
  of various magnitudes. The full frequency dependence of
  is shown in figure D.1(e). (b) Spectra of the real part of
  calculated using the combined model described in the text that reproduces to some extent the temperature dependence of the experimental data.
Download figure:
Standard image High-resolution imageFigure 12(a) shows the spectra of the real part of the macroscopic conductivity  , calculated using the model equations with
  and
and  given by
  . Here t is a real constant, and
  is a broad Lorentzian with a resonance in the mid-infrared, for which the real part is shown as the brown line in figure 12(a). The following values of the parameters of
  and
and  have been used:
  and
and  , both consistent with the oxygen charge of
  ,
,  ,
,  and
and  . It can be seen that in the presence of a nonzero spatially modulated component
  of the intra-ladder conductivity, the spectra display additional peaks due to the off-zone-center oxygen vibrations. Moreover, it is evident that the SWs of the peaks increase with increasing magnitude of
  , reaching values comparable to those of the experimental data for
  .
.
In order to reproduce (at a qualitative level) the temperature dependence of the spectra, we combine the two models. The total intra-ladder conductivity is then given by  , with homogeneous and modulated components in the form
  and
and  , respectively. The temperature is represented by a real parameter t, equal to 1 and 0 for the high-temperature normal state and the low-temperature ordered state, respectively. The equations of the combined model are presented in appendix
  and
and  of figure 12(a).
The behavior of the off-zone-center modes can be explained as follows: Consider first the case of a purely imaginary local conductivity  and a single phonon mode. The accumulated charge density ρ can be shown, by combining equations (1), (12) and (15), to follow the Lorentzian profile of the phonon with the resonance frequency shifted to
  and the SW rescaled by a factor
  . In the calculation of the conductivity, ρ acts (up to a geometric factor) exactly as a phonon polarization would, i.e.
  . For a nonzero real part of
  , the Lorentzian profile of ρ gets broadened, and deviations from the form
  cause an asymmetry. Adding a second phonon mode affects the original response similarly to a change in
  , as long as the frequencies of the phonon peaks are sufficiently far from each other.
3.4. Fits of the high- and low-temperature data
The results presented in sections 3.2 and 3.3 demonstrate that (a) The model of the homogeneous charge distribution allows one to reproduce and interpret the observed doping-induced suppression of the rung-oxygen mode as well as the broadening and asymmetry of the leg-oxygen mode; (b) The model of the charge ordered case clarifies the origin of the pronounced peaks C* and G* in the low-temperature conductivity data and provides values of SW of these peaks that are comparable to those of the data. Here we show that it is even possible to achieve reasonable fits of the data by tuning the input values of the conductivities, the phonon polarizabilities, and some of the model parameters, including the chain oxygen mode and an additional component  of the electronic conductivity, that describes an incoherent inter-ladder transport. So far we have considered two local current densities, the intra-ladder one
  and the inter-ladder one
  , and the corresponding local conductivities,
  and
and  , see equation (2). The former current density is determined by intra-ladder hopping terms of the single particle Hamiltonian (matrix elements
  ,
,  , and
, and  of figure 3 of [91]), and the latter by hopping terms between the nearby legs of neighboring ladders (
 ,
,  of figure 3 of [91]). The interladder transport, however, is complicated, involving significant longer-range hopping terms, e.g. between the bottom leg of a bottom ladder and the bottom leg of the upper ladder (
 ,
,  of figure 3 of [91]), and its description in terms of
  is thus not sufficient. In order to improve the present phenomenological approach, we consider a component of the electronic current density
  that is driven by the average field
  , rather than by the local fields, and denote the corresponding conductivity as
  :
:  . The current density
  does not interfere with
  and the phonons, it is simply added to the right-hand side of equations (10) and (16).
Figure 13(a) compares the measured 300 K spectrum with the fit obtained using the model of section 3.2 and figure 13(b) the measured 10 K spectrum with the fit obtained using the model of section 3.3. The dashed green and the dash-dotted violet lines represent the spectra of the real parts of  and
and  , respectively. Since the fitting with variable
  ,
,  , and
, and  yields highly correlated results, we have set
  for simplicity. The chain mode is included in such a way that it is driven by the average field (not including the depolarization field due to the mode itself), given by equation (11). This corresponds to
  and
and  (the meaning of the parameter
  follows from the structure of equations (8) and (9)). The off-zone-center chain mode is not considered. The effective charge of the chain oxygen is set to
  (those of the leg- and rung-oxygens are fixed at
  as above). The obtained values of the input phonon frequencies are 655 (720) cm−1, 562 (550) cm−1, and 598 cm−1 for the rung, leg, and chain zone-center (off-zone-center) phonons, respectively. Note that in the two fits (300 K and 10 K) the same values of the zone-center-phonon frequencies were used. The broadening parameters were fixed at 10 cm−1 for the rung- and leg-oxygen phonons (both zone-center and off-zone-center) and at 30 cm−1 for the chain-oxygen phonon. The values of the following model parameters have also been tuned:
  , γh
,
, γh
,  ,
,  ,
,  .
.
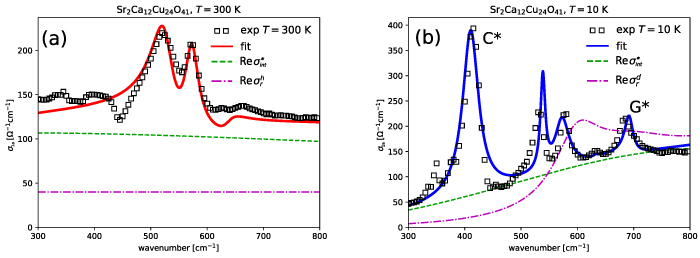
Figure 13. Comparison of the experimental spectra (open symbols) and the fits based on the models described in the text (solid lines) of the real part of the a-axis conductivity of SCCO with x = 12 (a) in the homogeneous state at 300 K and (b) in the charge ordered state at 10 K. The dash-dotted and dashed lines represent the spectra of the real part of intra-ladder conductivity σr
and of the inter-ladder conductivity  , respectively, that are introduced in the text.
Download figure:
Standard image High-resolution imageThe superscripts  and
and  refer to the homogeneous and the charge modulated (dipole) cases, respectively. The corresponding values of the parameters
  were obtained using the relation
  resulting from Newton's third law. The values of the parameters are given in table 1, except for the high frequency dielectric constant,
  . It can be seen that the models are capable of reproducing the frequency shift of the leg-oxygen mode when going from the high-temperature to the low-temperature phase and the shapes of the additional peaks C* and G*, except for the dip at the high-frequency side of C*. Some discrepancies in the central part of the figure, including the dip, might be due to the simplified way of incorporating the chain mode.
Overall, we conclude that the main features of the phonon anomalies in the a-axis response of the highly Ca-doped SCCO can be understood and rather well reproduced with a relatively simple model that involves charge oscillations along the rungs of the ladders and their coupling to the phonons via modulations of the local electric fields driving the phonons. In particular, the model explains the drastic increase of SW of the features C and G
and G , that occurs below
  : Below this temperature, the holes start to form pairs and develop an ordered state that gives rise to an activation of off-center phonon modes, the leg- (rung-) oxygen one corresponds to C
 (G
(G ).
).
4. Comparison of the c-axis spectra of SCCO with the a-axis spectra of underdoped YBCO
So far, we have discussed and analyzed in detail the gap features and the phonon anomalies in the a-axis response of SCCO. In the following, we turn to the corresponding features in the c-axis response of SCCO.
Figure 14 displays the spectra of the c-axis infrared conductivity (along the legs of the ladders) of the Sr2Ca12Cu24O41 crystal at representative temperatures between 300 and 10 K. The conductivity spectrum at 300 K is rather broad and featureless, apart from some weak features around 340, 470, and 540 cm−1 that are due to the infrared active phonon modes. The electronic conductivity decreases rather gradually as a function of frequency and exhibits a long tail that extends to the near-infrared regime. As the temperature is reduced below 300 K, a pronounced low-frequency peak starts to develop below about 250 cm−1 that sharpens and gains SW with decreasing temperature. Unlike a Drude peak of mobile charge carriers, the low-frequency peak has a maximum at a small but finite frequency, which indicates that it is due either to weakly localized charge carriers or to excitations of some collective electronic mode. This interpretation is corroborated by the dc resistivity measurements on crystals with a similar Ca content [39] for which the values of the dc conductivity are more than an order of magnitude lower than the maximum of this low-frequency peak (especially below 50 K where the dc resistivity exhibits an insulator-like upturn toward low temperature).
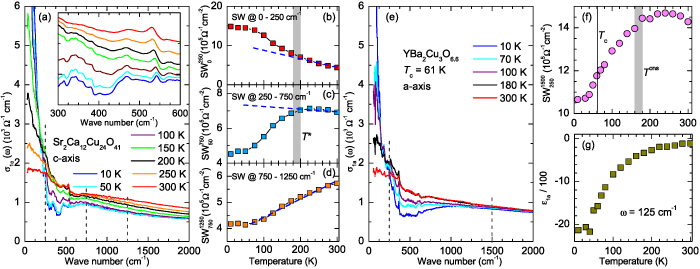
Figure 14. (a) Temperature-dependent spectra of the c-axis conductivity parallel to the legs of the ladders of Sr Cax
Cu24O41 with x = 12. The inset shows an enlarged view of the phonon features in the c-axis conductivity (with offsets to avoid overlap of the spectra). (b)–(d) Temperature dependence of the integrated spectral weights for the low energy peak below 250 cm−1, the dip feature between 250 and 750 cm−1, and the broad MIR band from 750 to 1250 cm−1, respectively, as indicated by the dashed lines in (a). The gray bar indicates the
Cax
Cu24O41 with x = 12. The inset shows an enlarged view of the phonon features in the c-axis conductivity (with offsets to avoid overlap of the spectra). (b)–(d) Temperature dependence of the integrated spectral weights for the low energy peak below 250 cm−1, the dip feature between 250 and 750 cm−1, and the broad MIR band from 750 to 1250 cm−1, respectively, as indicated by the dashed lines in (a). The gray bar indicates the  region of the PG transition in the a-axis response of the same crystal. The dashed blue lines show linear extrapolations of the trends above 200 K. (e) Temperature dependent spectra of the a-axis conductivity of a detwinned, underdoped YBa2Cu3O6.6 single crystal with
  K (reproduced from the supporting online material of [59]). (f) Evolution of the integrated spectral weight in the dip region from 250 to 1500 cm−1 as a function of temperature. (g) Corresponding temperature dependence of the real part of the dielectric function at 125 cm−1 as measured with ellipsometry.
Download figure:
Standard image High-resolution imageThe growth and sharpening of the low-frequency peak is accompanied by the gradual formation of a dip-like feature in the frequency range from about 250 to 750 cm−1, with a minimum around 400 cm−1. Figures 14(b) and (c) detail the temperature dependence of the SW of the low-frequency peak below 250 cm−1 and that in the range of the dip feature between 250 and 750 cm−1, respectively. Figure 14(c) shows that the dip feature starts to develop below  –200 K. Figure 14(b) reveals that the missing SW due to the dip-formation is transferred to the low-frequency peak for which the rate of the SW gain with decreasing temperature increases below
  –200 K. For comparison, figure 14(d) displays the temperature dependence of the SW above 750 cm−1 which shows no sign of an anomaly around
  and thus appears to be unaffected by the formation of the dip feature below 750 cm−1. The overall SW loss above 750 cm−1 is partially compensated by the SW gain of the peak below 250 cm−1, which also starts from 300 K, and a significant part is likely due to a redistribution of some of the holes from the ladder to the chain layers, as discussed in [39].
The above described observations reveal an important difference between the dip feature in the c-axis response and the PG in the a-axis conductivity (along the rungs of the ladders) in figure 2. While these partial gap features have very similar onset temperatures of  –200 K, their underlying correlations have opposite effects on the charge dynamics and the subsequent SW redistribution. Whereas for the a-axis PG, the missing SW is blue-shifted to a broad band above Epg
, for the dip feature in the c-axis response it is shifted to lower frequencies where it contributes to the peak below 250 cm−1. Note finally, that the phonon features in the c-axis conductivity spectra of SCCO, that are detailed in the inset of figure 14(a), exhibit splittings below about 200 K that are broadly consistent with a symmetry breaking due to the charge ordering along the legs of the ladders that has been discussed in the previous sections. A detailed fitting and analysis of the temperature dependence of these relatively weak phonon features, however, is beyond the scope of the present paper.
–200 K, their underlying correlations have opposite effects on the charge dynamics and the subsequent SW redistribution. Whereas for the a-axis PG, the missing SW is blue-shifted to a broad band above Epg
, for the dip feature in the c-axis response it is shifted to lower frequencies where it contributes to the peak below 250 cm−1. Note finally, that the phonon features in the c-axis conductivity spectra of SCCO, that are detailed in the inset of figure 14(a), exhibit splittings below about 200 K that are broadly consistent with a symmetry breaking due to the charge ordering along the legs of the ladders that has been discussed in the previous sections. A detailed fitting and analysis of the temperature dependence of these relatively weak phonon features, however, is beyond the scope of the present paper.
Figures 14(a) and (e) compare the c-axis conductivity (along the legs of the ladders) of Sr2Ca12Cu24O41 with that of the a-axis conductivity of a strongly underdoped YBa2Cu3O6.6 single crystal with  K [59]. Their conductivity spectra are amazingly similar in their overall shapes as well as in the absolute values. Notably, both exhibit a dip feature, that is consistent with an interpretation in terms of precursor SC pairing correlations without long range phase coherence (abbreviated as pairing correlations in the following), since the related missing SW is shifted to the low-frequency side. Of course, YBCO at T = 10 K displays the long range SC phase coherence. Figure 14(f) shows for the YBCO crystal the integrated SW in the dip region, from 250 to 1500 cm−1. It reveals that the suppression of the conductivity sets in below
  K and becomes faster below the macroscopic SC transition at
  K. The red-shift of the related missing SW is evident from figure 14(g) which shows the corresponding temperature dependence of the dielectric function
  at 125 cm−1. The latter has been determined with ellipsometry which independently measures the real and imaginary parts of the optical response function. Based on the Kramers–Kronig relation,
the T-dependence of the spectra of  thus provides reliable information about the corresponding changes of
  , even about those at frequencies below the measured range. For example, a SC transition and the related formation of a δ-function at the origin in
  (or
(or  ), due to the loss-free response of the SC condensate, gives rise to a characteristic decrease of
  toward larger negative values. Generally, such a decrease of
  is a reliable indicator of a red-shift of SW from higher frequencies (within or above the measured spectral range) to frequencies below the measured spectral range. Accordingly, the overall decrease of
  at 125 cm−1 with reduced temperature in figure 14(g) highlights that a corresponding increase of
  or, likewise, of the SW occurs below 125 cm−1. The relatively weak decrease of
  between 300 and 200 K is due to a SW transfer from the high-frequency band in the MIR and NIR to the Drude peak that is also seen in optimally doped YBa2Cu3O7 [102]. The increasing slope of the decrease of
  below
below  –180 K is related to the dip feature and the related red-shift of the SW that is likely caused by the pairing correlations.
5. Discussion
Our study has revealed some amazing parallels between the infrared spectra of SCCO and YBCO concerning the electronic gap features. Moreover, it has clarified the origin of the phonon-related anomalies some of which exhibit important differences. The phonon anomalies of SCCO have been explained in terms of the specific lattice structure and charge order in the weakly coupled Cu2O3 ladders. In the following, we summarize our main observations and discuss the implications that are relevant to understanding the physics of the high-Tc cuprates.
5.1. Pseudogap
The comparison of the a-axis spectra (field polarized along the rungs) of SCCO with the c-axis spectra (field perpendicular to the CuO2 planes) of underdoped YBCO has confirmed that in both cases the PG has very similar features. The similarities include the spectral shape of the gap, its energy scale (frequency range of the conductivity suppression), and the characteristic blue-shift of SW from the gapped region to a broad band above the gap edge. For the underdoped YBCO, it was previously shown that the PG energy scale increases with decreasing doping, and a linear extrapolation toward zero doping yields a value close to 2J [55, 56, 104]. Furthermore, the PG is weakened by (nonmagnetic) Zn substitution and enhanced by (magnetic) Ni substitution [105, 106]. These findings suggest that the PG is caused by short range antiferromagnetic spin correlations, most likely connected with the formation of spin singlets. The spin singlet scenario provides indeed a transparent qualitative interpretation of the PG effect: a transfer of an electron from one CuO2 plane to another necessitates the breaking of a singlet which requires an energy proportional to J [107]. The observation that the ladders, with a different crystal structure but with similar spin excitation spectra [39, 108–111], exhibit a corresponding PG provides additional support for the spin-correlation-based explanation of the PG.
5.2. Phonon anomalies and charge order
The anomalous temperature dependence of several phonon modes in the a-axis response of SCCO has been investigated in detail for samples with x = 8 and 12. As compared to the sample with x=0, the rung-oxygen mode (peak F in figures 2 and 4) is strongly suppressed and hardly visible. The leg-oxygen mode (peak D in figures 2 and 4) has an anomalous spectral shape that changes drastically below the PG temperature  . Even more spectacular is the temperature dependence of the modes C* and G* that are only very weak features at high temperatures but acquire a large SW concurrently with the opening of the PG below
  . This raises the question of how these phonon anomalies are related to the ones in the c-axis conductivity of underdoped YBCO. Recall that in the latter, several phonon modes, in particular the bond-bending mode at 320 cm−1, exhibit drastic changes that start at the temperature Tons
and have been associated with the onset (or rapid slowing down) of short-ranged SC pairing correlations. Simultaneously, a transverse plasma mode (tPM) develops that involves charge density fluctuations between the CuO2 planes of the bilayer units due to the pairing correlations.
. This raises the question of how these phonon anomalies are related to the ones in the c-axis conductivity of underdoped YBCO. Recall that in the latter, several phonon modes, in particular the bond-bending mode at 320 cm−1, exhibit drastic changes that start at the temperature Tons
and have been associated with the onset (or rapid slowing down) of short-ranged SC pairing correlations. Simultaneously, a transverse plasma mode (tPM) develops that involves charge density fluctuations between the CuO2 planes of the bilayer units due to the pairing correlations.
We have shown that the anomalies of the regular phonon modes D and F can be accounted for in terms of a model that is conceptually analogous to the one used for the planar cuprate YBCO. For SCCO the model involves charge oscillations between the legs of the ladders, instead of those between the closely spaced CuO2 planes in YBCO. However, in contrast to the case of YBCO, where the additional mode (the tPM) is of electronic origin, in SCCO the additional modes C* and G* have a strong lattice character. This has been verified by our study of the oxygen isotope effect on the optical spectra of both compounds (see figure 6). The lack of an electronic tPM mode in the low-temperature a-axis spectra of the ladders can be qualitatively understood as follows. In YBCO, the singlet pairs form in individual CuO 2 planes and the tPM mode arises from the interplane hopping of the pairs (which unlike the hopping of individual electrons does not lead to broken singlet pairs). In the ladders of SCCO, however, the pairs form along the rungs rather than the legs of the ladders such that a purely electronic excitation comparable to the tPM in YBCO is not possible.
The C* and G* modes in the a-axis spectra of SCCO are instead explained in terms of a (short-ranged) ordering of the pairs of the doped holes along the legs of the ladders which gives rise to a crystal of hole pairs of the type discussed in previous experimental and theoretical studies [43, 44, 97, 100, 101]. This kind of charge ordering activates the off-center leg-oxygen and rung-oxygen phonons. What is surprising and has required further explanation is the extraordinarily large SW of these modes, in particular, that of the C* mode. Our calculations, based on a phenomenological model of the a-axis charge dynamics of a hole crystal, have demonstrated that the modes can gain such a large amount of SW from the electronic excitations of the hole crystal. Accordingly, the C* and G* modes can be viewed as hybrids with a mixed lattice and electronic character. The success of this simple model in accounting for the pronounced phonon anomalies implies that even the highly doped ladders at  (present data and [39, 80]) exhibit a short-range hole ordering that likely involves a crystal of hole pairs. Note that this interpretation is consistent with the absence of the anomalous C* and G* modes in weakly Ca-doped samples with
  . The latter exhibit a static and more long-ranged CDW order that gives rise to an insulator-like gap and thus an almost suppression of the charge excitations in the frequency range of the phonons [39, 79]. In return, our observations suggest that the anomalous phonon features C* and G* are sensitive indicators of the slowly fluctuating short-range order of the hole pairs in the highly doped ladders. For example, they can be used to study the evolution of this charge order under high external pressure, in particular, to find out whether it coexists with the SC order that develops above 3 GPa [45–48].
5.3. c-axis conductivity of SCCO and pairing correlations
Essential information about the possible presence of SC pairing correlations in SCCO with x = 12 at ambient pressure has been obtained by analyzing the c-axis response (field polarized along the legs of the ladders) of SCCO and comparing it with the a-axis response (field polarized in the CuO2 planes, perpendicular to the CuO chains) of underdoped YBCO. Figure 14 reveals that the IR-spectra of these two materials are amazingly similar. For both of them, the conductivity spectra exhibit a dip feature which develops below an onset temperature of about 160–180 K. The formation of this dip feature is connected with a shift of the gapped SW toward the low-frequency side, that is characteristic of an increase of coherence of the electronic response. The only qualitative difference between YBCO and SCCO is that the low-frequency conductivity maximum is centered at zero frequency (or below the low-frequency limit of the measurements) in the former and at a well-resolved finite frequency in the latter.
For underdoped YBCO, we have previously discussed the evidence that the dip feature arises from pairing correlations which set in at a temperature much higher than the bulk SC transition temperature Tc
[59], similar conclusions have been reported for underdoped Hg-1201 [75]. The SCCO-YBCO analogy suggests that such pairing correlations occur equally well in SCCO below  –200 K. The pair formation in SCCO seems to be very local and essentially take place within the individual two-leg ladders. The development of a macroscopic SC order appears to be hindered by the reduced dimensionality of the system, due to weak coupling between the ladders. Recall that in purely 1D systems a long-range SC order is prohibited by the Hohenberg-Mermin-Wagner theorem [112–115]. Accordingly, in SCCO a bulk SC state can only occur if the coupling between the ladders and thus the effective dimensionality is increased, e.g. by applying external pressure [45].
The above described arguments that rely on the SCCO-YBCO analogy are also consistent with results of calculations based on the t-J model. Doped t-J ladders are known to exhibit short-range pairing correlations [90, 116–119]. The c-axis conductivity spectra of these ladders display a zero-frequency peak with a SW that is larger (for common values of t and J) than that at finite frequencies [120, 121]. The peak is believed to correspond to a collective motion of the system of hole pairs or, in other words, to a collective motion of electrons with short-range pairing correlations [120, 121]. It is thus natural to attribute the low-frequency conductivity maximum in the c-axis response of SCCO to the zero-frequency peak of the t-J ladders that is shifted toward a finite frequency by effects due to the density wave that remain to be further explored.
Irrespective of the SCCO-YBCO analogy and of the insights gained from the comparison with results of the t-J model, the high SW of the low-frequency maximum in the c-axis conductivity of SCCO indicates that the pattern of holes (probably the crystal of hole pairs) is quite mobile along the c-axis, very likely as a result of short-range SC pairing correlations.
5.4. Implications of the SCCO-YBCO analogy for understanding the physics of high Tc cuprates
So far, we have used the SCCO-YBCO analogy to understand the physics of SCCO. However, the similarities indicate as well that the collective degrees of freedom of a charge ordered and/or (precursor) SC pairing state, that are manifestly present in the case of SCCO, provide an important contribution to the a-axis conductivity of YBCO below Tons , and to the in-plane response of underdoped high-Tc cuprates in general. This challenges the various attempts to interpret the low-energy charge dynamics of the high-Tc cuprates solely based on Fermi-liquid-based models [53, 73, 122–125]. The SCCO-YBCO analogy is so pronounced that it even points toward a scenario of a spontaneous charge segregation in the CuO2 planes of the high-Tc cuprates that gives rise to quasi-1D electronic and magnetic structures, such as predicted early on for stripe-like orders [19] and more recently addressed in the context of a pair-density wave order [20]. The hole pairing in the charge stripes may have the same origin as that in the ladders of SCCO [19].
5.5. Temperature scales
Finally, we address the temperature scales of the PG, the charge ordering and the SC pairing correlations, and their mutual relationships. Notably, in SCCO with x = 12 the PG, the charge order and the precursor SC pairing correlations have the same (or very similar) onset temperatures of  –200 K, that further coincide with the onset temperature of the spin gap as seen with inelastic neutron scattering and NMR [32–36]. To the contrary, in the underdoped YBCO these various orders have clearly different onset (or crossover) temperatures. This can be seen from figure 15 which gives an overview of the doping dependence of the various onset temperatures in YBCO. The values of Tpg
, Tons
, and Tc
are reproduced from [59] and those of TCDW
from [68, 69]. It is evident that Tpg
exceeds Tons
throughout the entire underdoped regime. The CDW transition temperature, deduced from the x-ray diffraction experiments of [68, 69], on the other hand, is close to Tpg
in the weakly underdoped regime but then levels off and saturates at about 160 K around p = 0.12, before it declines rapidly toward lower doping and vanishes around p = 0.07–0.08. Note that it may not be accidental that the maximum of Tons
coincides with the putative quantum critical point at which the static CDW order vanishes [68, 69]. Whereas the static CDW order has been shown to compete with macroscopic superconductivity [67, 126], collective charge fluctuations may well contribute to the local SC pairing [14, 15, 127, 128].
–200 K, that further coincide with the onset temperature of the spin gap as seen with inelastic neutron scattering and NMR [32–36]. To the contrary, in the underdoped YBCO these various orders have clearly different onset (or crossover) temperatures. This can be seen from figure 15 which gives an overview of the doping dependence of the various onset temperatures in YBCO. The values of Tpg
, Tons
, and Tc
are reproduced from [59] and those of TCDW
from [68, 69]. It is evident that Tpg
exceeds Tons
throughout the entire underdoped regime. The CDW transition temperature, deduced from the x-ray diffraction experiments of [68, 69], on the other hand, is close to Tpg
in the weakly underdoped regime but then levels off and saturates at about 160 K around p = 0.12, before it declines rapidly toward lower doping and vanishes around p = 0.07–0.08. Note that it may not be accidental that the maximum of Tons
coincides with the putative quantum critical point at which the static CDW order vanishes [68, 69]. Whereas the static CDW order has been shown to compete with macroscopic superconductivity [67, 126], collective charge fluctuations may well contribute to the local SC pairing [14, 15, 127, 128].
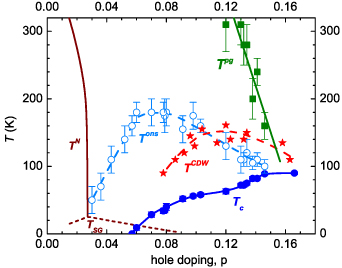
Figure 15. Hole doping phase diagram of the various transition temperatures of the cuprate high-Tc
superconductor YBa 2Cu3O . The evolution of the antiferromagnetic state below TN
and a so-called spin glass state below TSG
has been taken from [103]. The onset temperatures of the PG state Tpg
(dark green squares), of the pairing correlations Tons
(light blue open circles), and of the bulk SC transition temperatures Tc
(solid blue circles) have been adopted from [59]. The corresponding transition temperatures of the charge density wave order, TCDW
, have been reproduced from [68, 69].
. The evolution of the antiferromagnetic state below TN
and a so-called spin glass state below TSG
has been taken from [103]. The onset temperatures of the PG state Tpg
(dark green squares), of the pairing correlations Tons
(light blue open circles), and of the bulk SC transition temperatures Tc
(solid blue circles) have been adopted from [59]. The corresponding transition temperatures of the charge density wave order, TCDW
, have been reproduced from [68, 69].
Download figure:
Standard image High-resolution imageFor SCCO, to the contrary, the three ordering phenomena are found to set on simultaneously. Moreover, the common transition temperature of  –200 K is close to the maximum value of Tons
in strongly underdoped YBCO. This behavior suggests that in this quasi-1D material the underlying correlations and the subsequent orders are somehow more rigidly coupled than in the planar cuprates. For example, in the ladders the unpaired holes may well be more detrimental to the spin correlations than in the planar cuprates such that the spin singlet correlations underlying the PG can only develop in parallel with the hole ordering and pairing. Clearly, more detailed theoretical and experimental work is required to understand this important difference which may provide new insights into the relationship between the various spin and charge orders and the nature of the anomalous normal state properties of the planar cuprates.
–200 K is close to the maximum value of Tons
in strongly underdoped YBCO. This behavior suggests that in this quasi-1D material the underlying correlations and the subsequent orders are somehow more rigidly coupled than in the planar cuprates. For example, in the ladders the unpaired holes may well be more detrimental to the spin correlations than in the planar cuprates such that the spin singlet correlations underlying the PG can only develop in parallel with the hole ordering and pairing. Clearly, more detailed theoretical and experimental work is required to understand this important difference which may provide new insights into the relationship between the various spin and charge orders and the nature of the anomalous normal state properties of the planar cuprates.
6. Summary and conclusions
Our comparative study of the infrared responses of highly Ca-doped SCCO and of underdoped YBCO has revealed some surprising similarities with respect to the electronic gap features. It has also provided an explanation for the anomalous temperature and doping dependence of some of the a-axis phonon modes in SCCO. In the first place, our study has confirmed the striking similarity between the PG feature in the a-axis conductivity of the ladder compound SCCO and that in the c-axis conductivity of underdoped YBCO and thus provides support for theories that attribute the PG to superexchange driven spin-singlet correlations. Moreover, it has clarified the origin of some phonon structures in the a-axis conductivity of SCCO which exhibit very anomalous changes with doping and temperature. We have shown that they can be accounted for by a coupling of the phonons to intra-ladder charge oscillations. In particular, the activation of two additional phonon peaks around 400 and 700 cm−1 in the PG state below  has been explained in terms of a coupling of off-center phonons to charge fluctuations across the rungs of a crystal of hole pairs, that was previously predicted to occur in the ladders and indeed observed with resonant x-ray scattering for x = 0 and x = 11. Notably, these anomalous phonon peaks at 400 and 700 cm−1 do not occur at low values of x where the CDW order is static and more long-ranged and gives rise to an energy gap of about 800 cm−1 that suppresses the charge fluctuations in the relevant phonon frequency range. On the other hand, the peaks are present for all studied samples with
  . In conceptual analogy to the tPM in the c-axis response of the underdoped YBCO and the related anomalies of some of the IR-active phonons, the anomalous C* mode thus can be used as a sensitive indicator of the strength of the density fluctuations of the pattern of hole pairs.
Moreover, evidence for precursor pairing correlations in the ladders of SCCO has been obtained from the observation that the c-axis infrared response of SCCO is remarkably similar to the a-axis response of underdoped YBCO. Notably, we discovered that in both cases the conductivity spectra display a dip feature due to the formation of a partial gap for which the missing SW is shifted toward the low-frequency side. Such a red-shift of the gapped SW signifies an increase of coherence of the electronic response and for the underdoped planar cuprates, like YBCO [59] or Hg-1201 [75], it has been previously explained in terms of pairing correlations. The SCCO-YBCO analogy strongly suggests that the weakly coupled ladders are subject to similar pairing correlations.
Finally, a notable difference between underdoped YBCO and SCCO concerns the onset temperatures of the gaps and phonon anomalies due to the above described spin and charge ordering phenomena. In SCCO they develop (almost) simultaneously below a common onset temperature  . In the underdoped YBCO, however, the transitions (or crossovers) have different onset temperatures with the PG due to spin-singlet correlations developing at a considerably higher temperature (around 300 K) than the onset of the SC pairing correlations (around 160 K) or that of the short-ranged CDW order. This implies that the underlying charge and spin correlations are more strongly coupled in the ladders of SCCO than in the planar cuprates.
Our findings open up new perspectives and raise important questions along the following lines.
- (1)Our results call for a revision of the phase diagram of the charge order in the ladders. According to the review [39], the density wave is very weak or absent at x > 9. On the other hand, the resonant x-ray study of [44] reported that a pronounced charge order occurs only for very specific values of x, whereas for others it is melted. The present experimental data, in conjunction with earlier optical data and the model of the phonon anomalies, suggest, that a hole density wave is present in the entire range of x from 8 to 12 and its strength and onset temperature are only weakly x dependent (with K). These seemingly contradictory results should encourage further resonant x-ray diffraction studies to search for traces of the order, and also theoretical work to understand the surprising persistence of the density wave and the weak doping dependence of its onset temperature.
- (2)The high sensitivity of the anomalous C* and G* modes to intra-ladder charge fluctuations connected with the (short range) order of the hole pairs could be used to study how the charge correlations evolve as a function of external pressure and whether they coexist with the bulk SC state above 3 GPa. In particular, it would be interesting to find out whether the charge correlations exhibit a similar pressure and temperature dependence as the spin-gap [48] and continue to share a common onset temperature. A better understanding of the interplay between the correlated hole pairs, the singlet correlations, and superconductivity can also provide new insights into the role of the charge and pair-density-wave states in the physics of underdoped planar cuprates.
- (3)The origin of the pronounced low-frequency mode in the c-axis response of the ladders, that forms below, is not yet understood. It has been discussed in terms of a collective mode of a pinned CDW [80] or as a feature corresponding to the opening of the CDW gap [39]. The former interpretation is difficult to reconcile with the fairly low values of the pinning frequency reported for the less-doped SCCO samples. According to the latter interpretation, its SW should arise from the gapped low frequency region below the mode. Our data for x = 12, however, show that the SW of the mode comes mainly from the frequency range above the mode. The development of the mode and of the dip above it is fairly similar to that of the low-frequency maximum and the dip feature of underdoped YBCO. We can only speculate that the mode is codetermined by pairing correlations, manifesting themselves in the formation of the dip, and the density wave, fixing its frequency. Clearly, this calls for a theoretical description involving both pairing correlations and the density wave.
- (4)The strikingly similar infrared responses along the c-axis of SCCO with x = 12 and along the a-axis in underdoped YBCO suggest that the low-energy charge response of YBCO has an important (and possibly even predominant) contribution from collective degrees of freedom. For the case of SCCO this is well established but for underdoped YBCO this puts a new perspective on the interpretation of the low-energy response. The latter has been so far discussed mainly in the framework of quasi-particle models assuming a Drude-like in-plane response with modified power-laws for the scattering rate and effective mass (models of marginal Fermi-liquids [17], Planckian dissipation [124], proximity to a quantum critical point [122], two-fluids [123], etc). Eventually, this might also provide more information about the CDW and PDW in the planar cuprates and their relationship with SC. Note, however, that for the metallic and SC in-plane response of the planar cuprates, it is quite a challenging technical task to identify and quantify the low-frequency response of a collective mode with a maximum that is centered at a finite frequency rather than at the origin (as for a Drude response). Here the reflectivity at low frequency is close to unity and even a strong collective mode only gives rise to weak spectral features that are difficult to detect, see, e.g. [129–131].
- (5)The very similar PG features in the conductivity spectra of SCCO and of underdoped YBCO suggest a common mechanism that probably does not require a 2D order (long range or short range). Short range spin correlations are likely the main player here since they are common to both materials. An important discovery of the present work is that in SCCO with the PG has the same (or at least a very similar) onset temperature as the pairing correlations, that manifest themselves in the low-frequency mode and the dip feature in , and the density wave, that is seen via the phonon anomalies in . This might indicate that the 'pseudogap phase' of SCCO involves a PDW order similar to that discussed in the context of the underdoped cuprates (and that the PG is possibly even driven by this PDW). However, considering the different temperature scales of these orders in YBCO, for which the onset temperature of the PG is much higher than that of the charge and pairing correlations, we rather conjecture that in both cases the spin correlations are dominant. Why the PG in YBCO can develop without the hole pairing, whereas in the ladders of SCCO it requires the hole pairing, is an open question that calls for further experimental and theoretical work.


Acknowledgments
We are grateful to Bernd Büchner for providing the SCCO crystals with x = 0 and 8. We acknowledge the KIT light source for provision of instruments and beam at the IR1 beamline of the Institute for Beam Physics and Technology (IBPT) and for the operation of the storage ring, the Karlsruhe Research Accelerator (KARA). We thank J. Chaloupka for help in an early stage of the project and for critical reading of the manuscript. We also thank S. Tajima for providing us the data reported in [80] and R. Hlubina for stimulating discussions. This work was supported from Operational Programme Research, Development and Education—'Project Internal Grant Agency of Masaryk University' (No. CZ.02.2.69/0.0/0.0/19_073/0016943) and by the internal Project MUNI/A/1550/2021. Work at the University of Fribourg was supported by the Schweizerische Nationalfonds (SNF) by Grant No. 200020-172611.
Data availability statement
The data cannot be made publicly available upon publication because they are not available in a format that is sufficiently accessible or reusable by other researchers. The data that support the findings of this study are available upon reasonable request from the authors.
Authors contributions
P A and B X contributed equally to this work. D M and C B conceived and directed the theoretical and experimental parts of the work, respectively. B X conducted the infrared experiments with help from P M and A D. P A performed the main part of the theoretical calculations with help from D M, H R and P B. P P, E P and J L T. provided and characterized crystals and performed the oxygen isotope exchange. Y L M supported the ellipsometry experiments at KARA. All authors have participated in writing the manuscript.
Appendix A: The Drude–Lorentz fit
We performed a quantitative analysis of the low-energy part of the  spectra of Sr
 Cax
Cu24O41 (x = 12 and 8) by fitting with the following Drude–Lorentz model:
Cax
Cu24O41 (x = 12 and 8) by fitting with the following Drude–Lorentz model:
where Z0 is the vacuum impedance. The first Drude term describes the response of itinerant carriers characterized by a plasma frequency  and a scattering rate
  . The second term denotes a series of Lorentzian oscillators with the resonance frequency
  , line width γj
and oscillator strength Sj
, that accounts for the infrared-active phonon modes and the interband transitions.
, line width γj
and oscillator strength Sj
, that accounts for the infrared-active phonon modes and the interband transitions.
Figure A.1(a) shows the Drude–Lorentz fit (red line) to the low-energy part of the measured  spectrum of Sr2Ca12Cu24O41 at 10 K (black curve). Also shown are the contributions of the C* and G* features (blue line), as discussed in the main text. Note that the best fitting to the C* feature requires two Lorentz terms, while one Lorentz term is needed for the G* feature. The Drude–Lorentz fitting has been applied at all the measured temperatures to obtain the full set of temperature dependent fitting parameters. The obtained temperature dependencies of the spectral weights of the features C* and G* are shown in the main text in figures 2(h) and (i), respectively. Figure A.1(b) shows the same type fit to the measured spectrum at 10 K of Sr6Ca8Cu24O41.
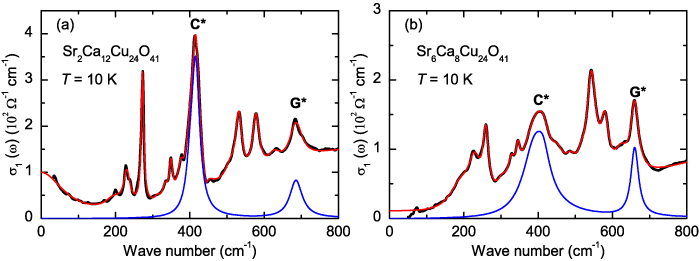
Figure A.1. (a) Fit of the conductivity at 10 K of Sr2Ca12Cu24O41 with the Drude–Lorentz model. (b) Corresponding fit of the conductivity at 10 K of Sr6Ca8Cu24O41.
Download figure:
Standard image High-resolution imageAppendix B: Hole correlations and a-axis optical conductivity of the t-J model
B.1. Hamiltonian
The Hamiltonian of a two-leg t-J ladder reads:
where  are the projected electron operators,
  , and
, and  are the local spin operators. The indices r and
  run over the rungs and the legs, respectively, σ denotes spin, and the indices
  denote the upper and the lower leg, respectively. Periodic boundary conditions have been used in all our calculations. If not mentioned otherwise, the same values of the input parameters as in [121] have been used:
  eV,
eV,  eV,
eV,  eV, and
  eV ('realistic values'). The ground states, as well as the dynamical properties, have been obtained using the Lanczos technique [132].
B.2. Hole correlations
Figures B.1(a)–(d) show the hole-hole correlation function  for ladders with 2 and 4 holes on 10 rungs, with the position of one hole fixed. Panels (a) and (c) have been obtained using the realistic values of the input parameters, panels (b) and (d) using the same values of the hopping parameters but three times larger values of the superexchange constants. Panels (a) and (b) illustrate the formation of the hole pairs, and panel (d) suggests that the pairs form a density wave. The latter, however, cannot be identified in (c). Signatures of the pair density wave can be seen in panels (e)–(g) displaying the three hole correlation function
  , with the positions of two holes fixed.
B.3. Inter-ladder and intra-ladder (rung) conductivity
Here we derive the formula for the a-axis interladder optical conductivity based on the assumption of weakly coupled ladders. We consider the system of two independent ladders. The unit cell contains one rung per ladder and the rungs are shifted by half the leg lattice parameter (see figure 5). The ladders are connected by four hopping terms  introduced in [91]. We first construct the corresponding contributions to the current density operator j and then express the conductivity in terms of
  .
.
The contribution j2 can be written as:

The two ladders are labeled  ;
;  denotes the upper and the lower leg, respectively, and r is the unit cell index. The spin index has been omitted for brevity. By transforming the operators into the along-the-leg quasi-momentum representation we obtain:
where  correspond to even/odd states with respect to reflection about the line connecting the midpoints of the rungs, and c1 is the lattice parameter along the leg. Similarly we obtain:
The k dependent factors associated with the four relevant hopping terms in the total current density operator j are thus:
The interladder conductivity of the ground state is given by the standard formula (see, e.g. [132]):
where M runs over eigenstates of the two ladder system and  is the ground state. The hopping terms listed in equations (B.7)–(B.10), and the H.c. terms, can be considered independently, as cross-terms do not contribute under our assumption of independent ladders. We can therefore express the conductivity in terms of the single-ladder spectral function:


where m runs over the eigenstates of a single ladder,  is the ground state, and Q stands for
  .
.
The final formula reads:
where  is the form factor of equations (B.7)–(B.10). Results shown in figures B.2 and B.3 have been obtained using equations (B.13)–(B.15) for a ladder of 10 rungs and four doped holes. Realistic values of
  , and
, and  eV [91] have been used. Figure B.2 demonstrates that the quasi-hole and quasi-electron excitations are separated by a fairly large gap. This justifies our assumption of weakly coupled ladders. Figure B.3(a) shows the calculated inter-ladder conductivity and in addition the intra-ladder (rung) conductivity calculated as in [98]. Figure B.3(b) shows the k dependence of the moduli of the matrix elements of equations (B.7)–(B.10) squared.
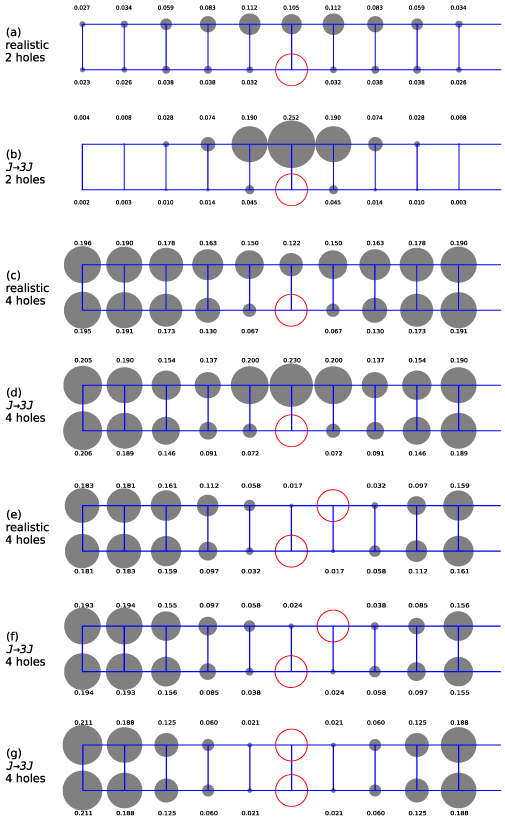
Figure B.1. (a)–(d) Hole–hole correlation functions and (e)–(g) three hole correlation functions for a t-J ladder with 10 rungs. The empty red circles mark the positions of the fixed holes. The radii of the grey circles and the attached numbers represent the probabilities that the site is occupied by a hole. Results shown have been obtained either using the realistic values of the input parameters or using the same values of the hopping parameters but three times larger values of  (labeled
  ).
).
Download figure:
Standard image High-resolution image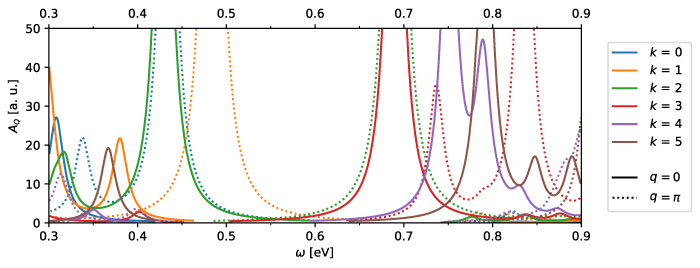
Figure B.2. Quasiparticle spectral function of the t-J ladder specified in the text. The k components of quasi-momentum are given in units of  .
.
Download figure:
Standard image High-resolution image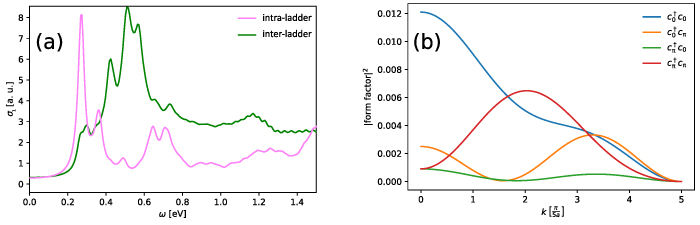
Figure B.3. (a) Intra-ladder and inter-ladder conductivities of the t-J ladder specified in the text and (b) the along-the-leg momentum dependencies of the moduli of the matrix elements of equations (B.7)–(B.10) squared, labeled by the q indices.
Download figure:
Standard image High-resolution imageAppendix C: Electrostatic calculations of the model parameters of the homogeneous case
In this section, we describe our calculation of the parameters  , and
, and  of the homogeneous model described in section 3.2. To allow for a succinct writing, we set the origin of the coordinate system at the middle of a ladder, and label the axes as follows: x along the leg, y parallel to the rungs, and z perpendicular to the ladder plane. For a schematic representation of the x = 0 cut of the lattice of the cylinders, see figure C.1. For symmetry reasons, all relevant quantities depend on y and z only, we can thus set x = 0 and work with 2D position vectors. First, we show how to compute
  , the parameter entering equation (6). The contribution of
  (see figure 9(a)) to the electrostatic potential is given by:
where  is the electrostatic potential at r of a single cylinder of unit charge density and radius c centered at
  ,
,
![$\mathbf{R}\in\left\{\left[m(a_1+a_2),n\ell\right],\,m,n\in\mathbb{Z}\right\}$](https://content.cld.iop.org/journals/0034-4885/86/4/044502/revision2/ropacbe4fieqn378.gif) runs over the unit cells, and
runs over the unit cells, and  . We need to evaluate the potential and the electric field only for z = 0. The field averaged over the rung is calculated from the potential difference:
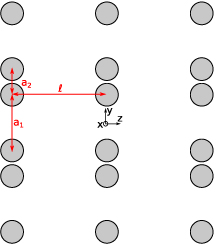
Figure C.1. Schematic representation of a segment of the x = 0 cut of the lattice of the cylinders.
Download figure:
Standard image High-resolution imageExplicitly,
The parameter  entering equation (7) is obtained analogously from:
with with  .
.
The parameter  ,
,  rung, leg
  , can be expressed in terms of the field at the position of the rung/leg-oxygen
where  and
and  are the oxygen equilibrium positions. The same result is obtained by averaging the field over the cross section of the cylinder representing the rung/leg-oxygens (see figure 9(c)). The identity can be confirmed using Gauss's law.
Next, we express the parameters  and
and  . The fields caused by the displacements
  of the cylinders representing the oxygens can be described using the additional potentials
where  is the linear charge density of the i-oxygen cylinders. The corresponding contributions to the fields of interest are given by:
where Qi
and ni
are the effective charges and the ionic densities, respectively. Parameter α (δi
) is equal to the volume average of  and
and 
 and
and  ,
,

Due to the long range nature of the Coulomb interaction, the numerical values of the parameters depend on the area over which R is summed. However, the final conductivity does not depend on the shape of the area as long as the size is large enough. The numerical values of the parameters obtained for a sufficiently large square area are listed in table 1.
Appendix D: Electrostatic calculations of the model parameters of the ordered case
In this section, we explain our calculations of the parameters  and
and  of the model of ordered spheres described in section 3.3. The values of the parameters α and
  are the same as in the homogeneous case,
  , and
, and  . We consider only the case of
  where
where  is irrelevant. With the ordering period along the leg p, an induced charge of
  sits at every p-th lower (upper) leg, see figure 9(b).
The parameter  entering equation (12) has been calculated starting from the expression for the potential difference between the lower and the upper leg on a rung connecting the centers of the charged spheres,
where R runs over the charged spheres, except for those of the chosen rung,  is the sign of the charge at R, and r1, r2 correspond to the lower and the upper leg of the chosen rung, respectively. The factor
  is chosen to preserve the form of the local field equation of the homogeneous model. In equation (D.1) we have excluded the self-contribution, i.e. the contribution of the spheres of the chosen rung. It can be easily seen, that the self-contribution is proportional to the period p and strongly depends on the radius c of the charged spheres, as the potential inside a sphere at the distance r from the center is
  . The expression on the right hand side of equation (D.1), however, is independent of c (for reasonable values of c), and the along-the-leg components
  are linear in p, yielding a much weaker p dependence.
The parameters  entering equations (14) and (15) are calculated as the averages of the field due to
  over the ordering period, with unit weight,
  , for the zone-center phonons and with the weight given by
  for the off-zone-center phonons. The final formula reads:
where yi
is the along the rung component of the equilibrium position vectors of the relevant oxygens (
 ), and
  are unit vectors.
The numerical values of the parameters are listed in table 1. The self-interaction gives a contribution to γ of  for c = 0.8 Å. The spectra justifying our choice of the value of
  discussed in section 3.3 are shown in figure D.1.
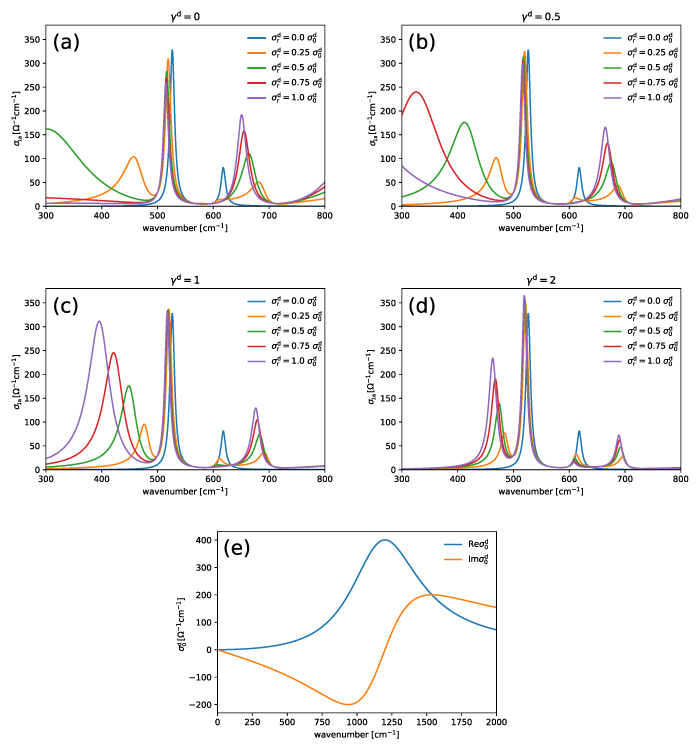
Figure D.1. (a)–(d) Spectra of the real part of  calculated with
  and various magnitudes of the Lorentzian
  (different lines), for four values of
  (different panels). (e) Spectra of the real and imaginary parts of the Lorentzian
  .
.
Download figure:
Standard image High-resolution image
Appendix E: The combined model equations
The equations are shown only for  , where the inter-ladder field
  is irrelevant:


where i runs over {rung, leg} and j over  .
.