the Creative Commons Attribution 4.0 License.
the Creative Commons Attribution 4.0 License.
 | 29 Apr 2024
The first hillslope thermokarst inventory for the permafrost region of the Qilian Mountains
Xiaoqing Peng
Guangshang Yang
Oliver W. Frauenfeld
Xuanjia Li
Weiwei Tian
Guanqun Chen
Yuan Huang
Gang Wei
Jing Luo
Cuicui Mu
Fujun Niu
Climate warming and anthropogenic disturbances result in permafrost degradation in cold regions, including in the Qilian Mountains. These changes lead to extensive hillslope thermokarst (HT) formation, such as retrogressive thaw slumps, active-layer detachment slides, and thermal erosion gullies. These in turn cause, e.g., degradation of local vegetation, economic losses, infrastructure damages, and threats to human safety. However, despite its importance, there is currently no thermokarst inventory for the Qilian Mountains. Through manual visual interpretation and field validation, we therefore produce the first quantification of HT features. We count a total of 1064 HT features, with 67 % located in the upper reaches of the Heihe River basin, which encompasses ∼ 13 % of the Qilian Mountains region. We further identified that 187 HT features (18 %) existed before 2010, while the remaining 874 (82 %) were initiated in the recent period. More specifically, 392 sites (37 %) were initiated during 2010–2015 and 482 (45 %) after 2015. Thermokarst terrain is observed primarily in areas with shallow active-layer depths (average thickness 2.98 m) on northern shaded slopes of 3–25°, with low solar radiation and moderate elevations ranging from 3200 to 4000 m. This first inventory of HT features is an important and missing piece in documenting changes on the Qinghai–Tibetan Plateau, and this new dataset also provides an important basis for further studies, such as automated extraction of HT features, susceptibility analysis of HT, and estimation of losses caused by HT. The datasets are available from the National Tibetan Plateau/Third Pole Environment Data Center and can be downloaded from https://doi.org/10.11888/Cryos.tpdc.300805 (Peng and Yang, 2023).
- Article
(9095 KB) - Full-text XML
- BibTeX
- EndNote


The Qilian Mountains are located in the northeastern part of the Qinghai–Tibetan Plateau, at the confluence of three major geographical regions, i.e., the eastern monsoon zone, the northwestern arid zone, and the alpine zone of the Qinghai–Tibetan Plateau. The Qilian Mountains play an important role in maintaining the ecological balance of the Tibetan Plateau, stopping the southward progression of deserts, and maintaining the stability of the oases in the Hexi Corridor. Due to its unique geographical and environmental characteristics, permafrost is widespread and underlies about 50 % of the area (Ran et al., 2021). Permafrost has an important role in storing frozen water, thereby contributing to water conservation (Wang et al., 2022). These roles can aid in inland river runoff recharge, which is crucial to regional ecology, production, and life. Due to climate warming and human activities, significant permafrost degradation results in the frequent occurrence of thermokarst, representing a serious threat to ecological security and adversely impacting the environment and human beings (Li et al., 2022a).
Despite the importance of thermokarst processes and their potential geohazards, the distribution of thermokarst landscapes is currently mostly undocumented. The available distribution of thermokarst in the Northern Hemisphere, including retrogressive thaw slumps (RTSs), thermokarst lakes, and other terrain features, represents mainly probabilistic estimates (Olefeldt et al., 2016; Yin et al., 2021; Huang et al., 2023; Yang et al., 2023). Muster et al. (2017) determined the distribution of circumpolar Arctic permafrost lakes and ponds from 2002 to 2013 at a resolution of 5 m using optical remote sensing, satellite (Geo-Eye, QuickBird, WorldView-1 and WorldView-2, KOMPSAT-2), and radar imagery (TerraSAR-X), but temporal inconsistencies make comparisons in time and space difficult. At the regional scale, the techniques and spatial resolution of remote sensing imagery currently used in different study areas are inconsistent, e.g., estimating the distribution and development of RTSs on Banks Island, Canada, based on the interpretation of a Google Earth Engine Timelapse dataset (Lewkowicz and Way, 2019). Satellite imagery at 30 m resolution from Landsat has been used to analyze RTSs and thermokarst lakes in the region of Alaska within the circumpolar Arctic, eastern Canada, and Siberia (Nitze et al., 2018). Nicu et al. (2023) employed orthorectified imagery with a resolution of 5 m to visually interpret and identify cryospheric hazards (such as thaw slumps and thermo-erosion gullies) in Nordenskiöld Land, covering an approximate area of 4000 km2 in the Svalbard Archipelago. The permafrost zone of the Qinghai–Tibetan Plateau (QTP) has been a site of thermokarst geomorphology research in recent years. For example, combining field surveys and SPOT-5 satellite data for August 2010, a total of 2163 thermokarst lakes and ponds were recorded within 10 km on either side of the Chumar River to the Fenghuo Mountains of the Qinghai–Tibet Railway, with a total surface area of 1.09 × 10⁷ m2 and ranging in size from 100 m2 to 4.49 × 10⁵ m2 (Luo et al., 2015; Niu et al., 2014). In the Beiluhe region of the central QTP, the number of RTSs increased from 124 to 438 between 2008 and 2017, with an approximately 9-fold increase in area (Huang et al., 2020; Luo et al., 2019). The latest results show that the number of RTSs on the QTP is 2669, but for the Qilian Mountains in the northeastern part of the region, only 6 (Luo et al., 2022) or as many as 15 are documented (Mu et al., 2020). A lack of a thermokarst inventory in this region is therefore evident, representing a crucial gap in the RTS inventory on the QTP.
There is a frequent occurrence of hillslope thermokarst hazards due to permafrost degradation, with significant ecological impacts on the Qilian Mountains. The ecological environment of the permafrost areas has a significant impact, and there is a direct correlation between human activities and major permafrost engineering problems, including uneven subsidence of infrastructure, slumps, and cracks. Meanwhile, there is little to no information regarding hillslope thermokarst (HT) features such as RTSs, active-layer detachment slides, and thermal erosion gullies (Gooseff et al., 2009) in the Qilian Mountains. HT refers to a specific type of thermokarst formation that occurs in permafrost regions. While this is similar to regular thermokarst, what distinguishes hillslope thermokarst is its occurrence on sloped terrain or hillsides, where permafrost thaw leads to slope instability. This can result in various landforms like retrogressive thaw slumps, thermal erosion gullies, or active-layer detachments, affecting the stability and shape of hillslopes in permafrost regions. These features can significantly impact the landscape and have implications for infrastructure, ecosystems, and land use in areas affected by hillslope thermokarst processes (Kokelj and Jorgenson, 2013; Olefeldt et al., 2016; Gooseff et al., 2009). Thus, the urgent need to survey and quantify these undocumented HT features in the Qilian Mountains motivates and represents the goal of this study.
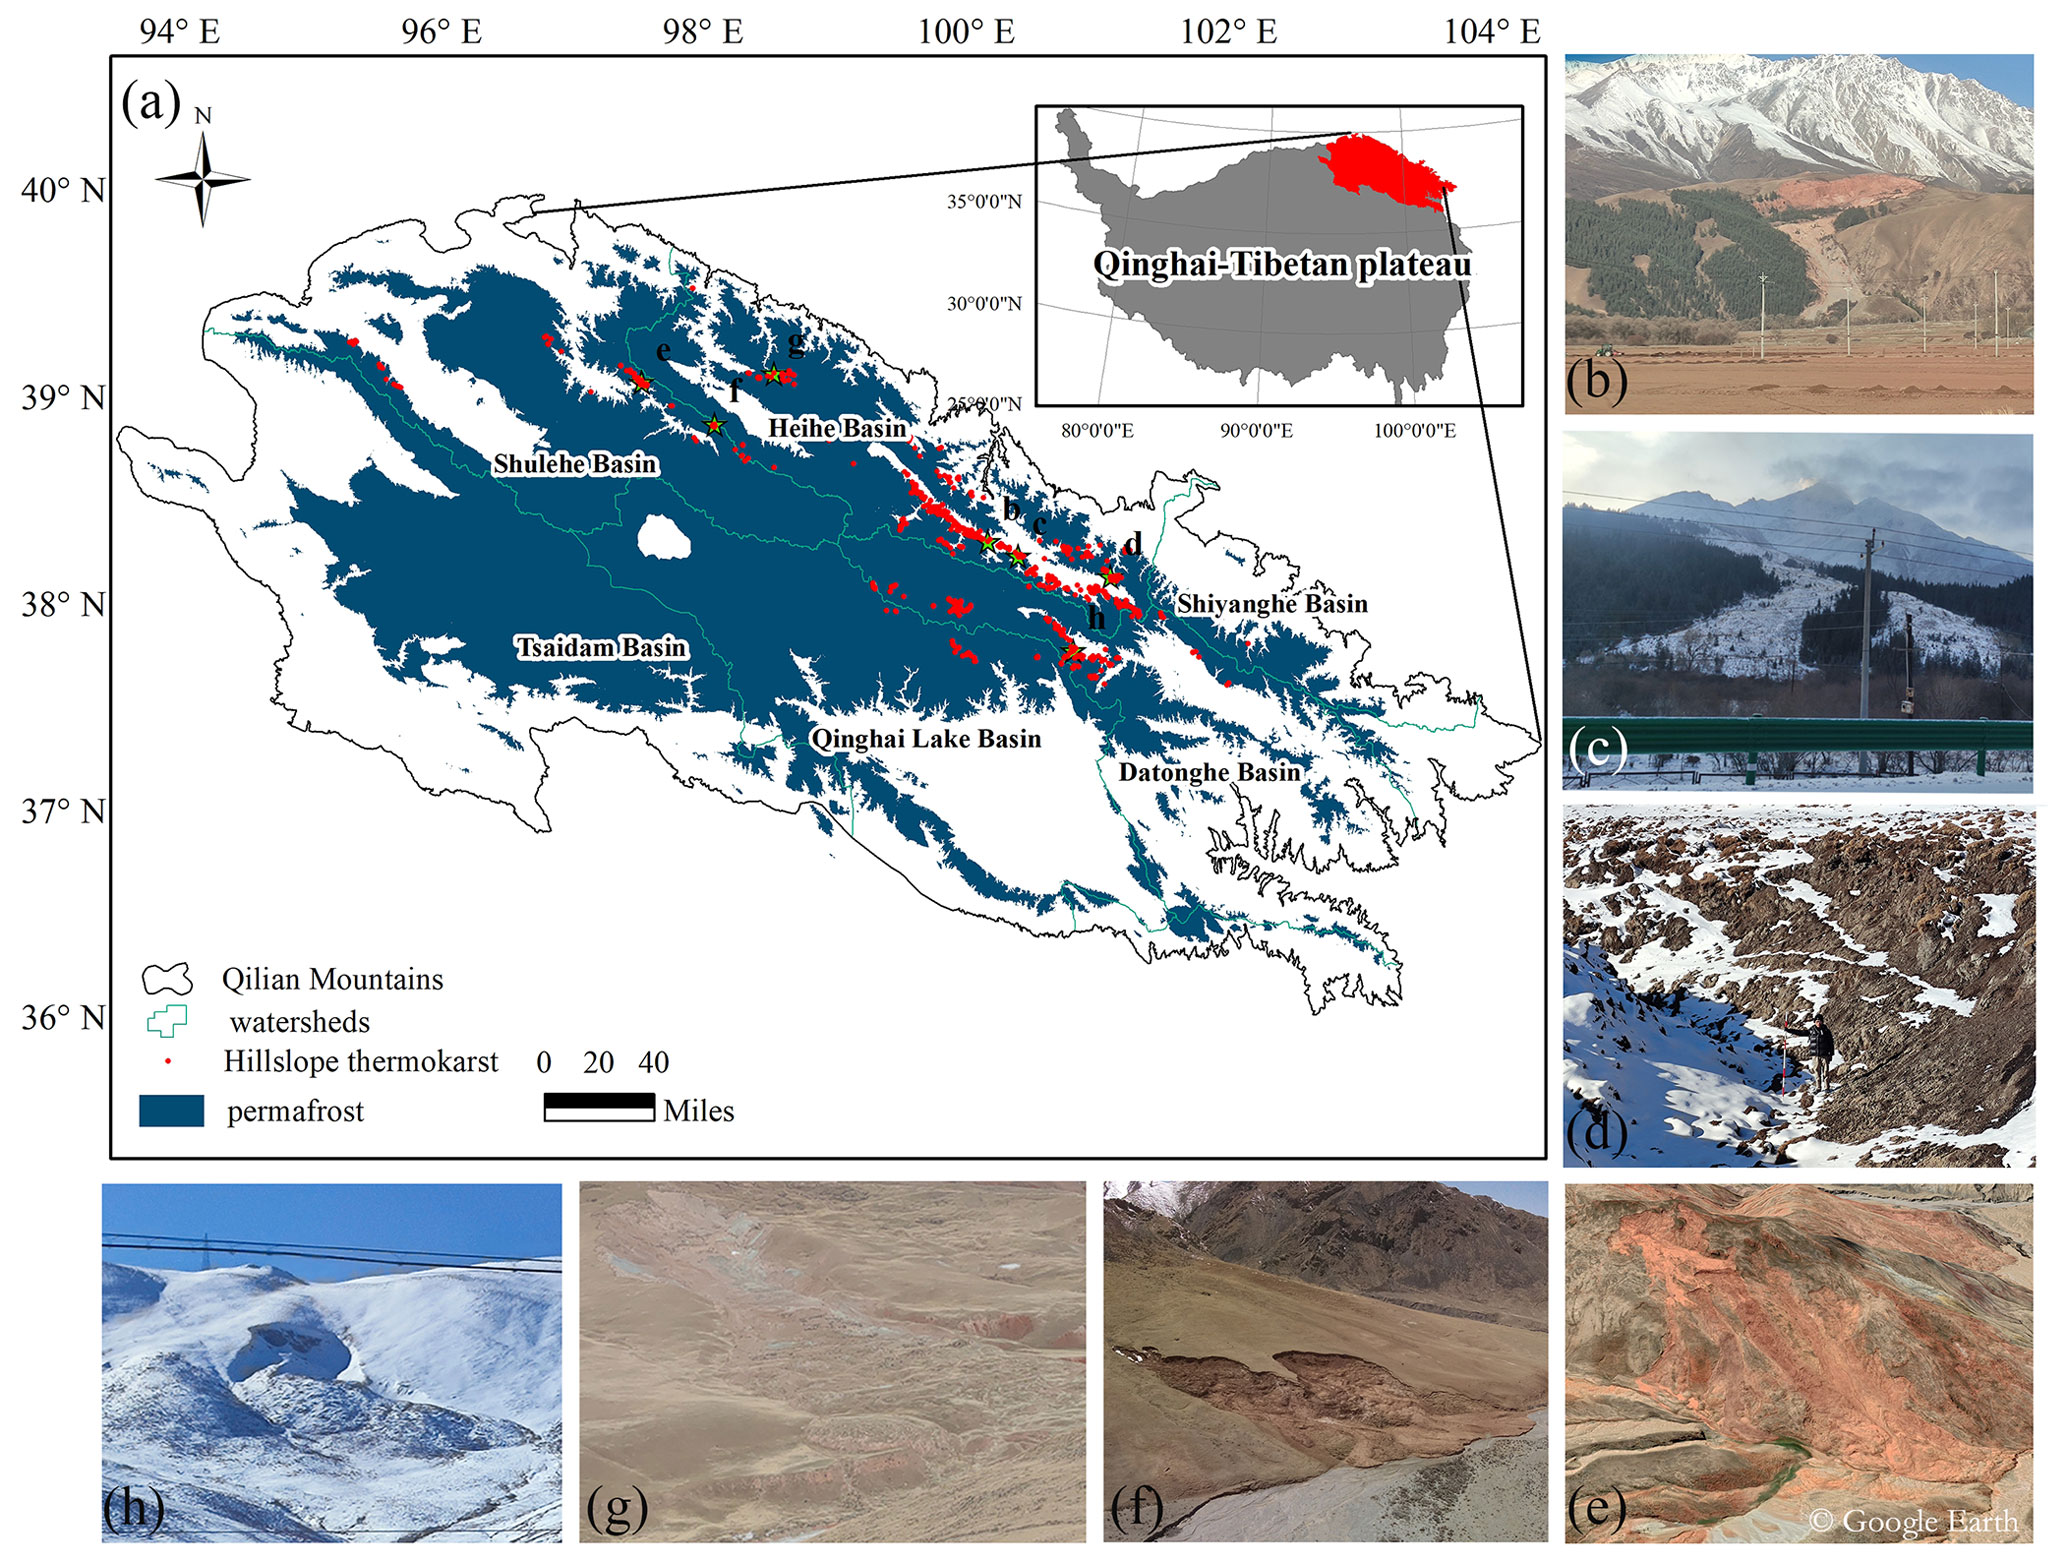
Figure 1The location of the study area and (a) its HT distribution (Qilian Mountains permafrost extent data are from TPDC, 2020) and (b–h) HT features obtained from different watersheds during our field surveys with the exception of (e) a Google Earth image. As this site is too difficult to access, the positions corresponding to panels (b)–(h) have been labeled in panel (a).
The Qilian Mountains are located at the northern edge of the QTP, with an average elevation of 3855 m. The region is underlain by permafrost and seasonally frozen ground (36–40° N, 94–104° E; Fig. 1a), with a permafrost area of 94 235 km2 that accounts for 49 % of the study domain. Characterized by both an alpine mountain climate and a temperate continental monsoon climate, the mean annual air temperature is 0.30 °C (Jin et al., 2022) with high precipitation variability and higher amounts in the southeast during the thawing season of June to September (Chen et al., 2013; Li et al., 2022b). Due to human activities, climate change, and earthquakes, permafrost instability in the Qilian Mountains has gradually increased, resulting in HT formation including RTSs, active-layer detachment slides, and thermal erosion gullies, which pose a direct threat to the local economy, ecology, and safety.
Table 1List of the data used for manual interpretation and mapping of HT features.
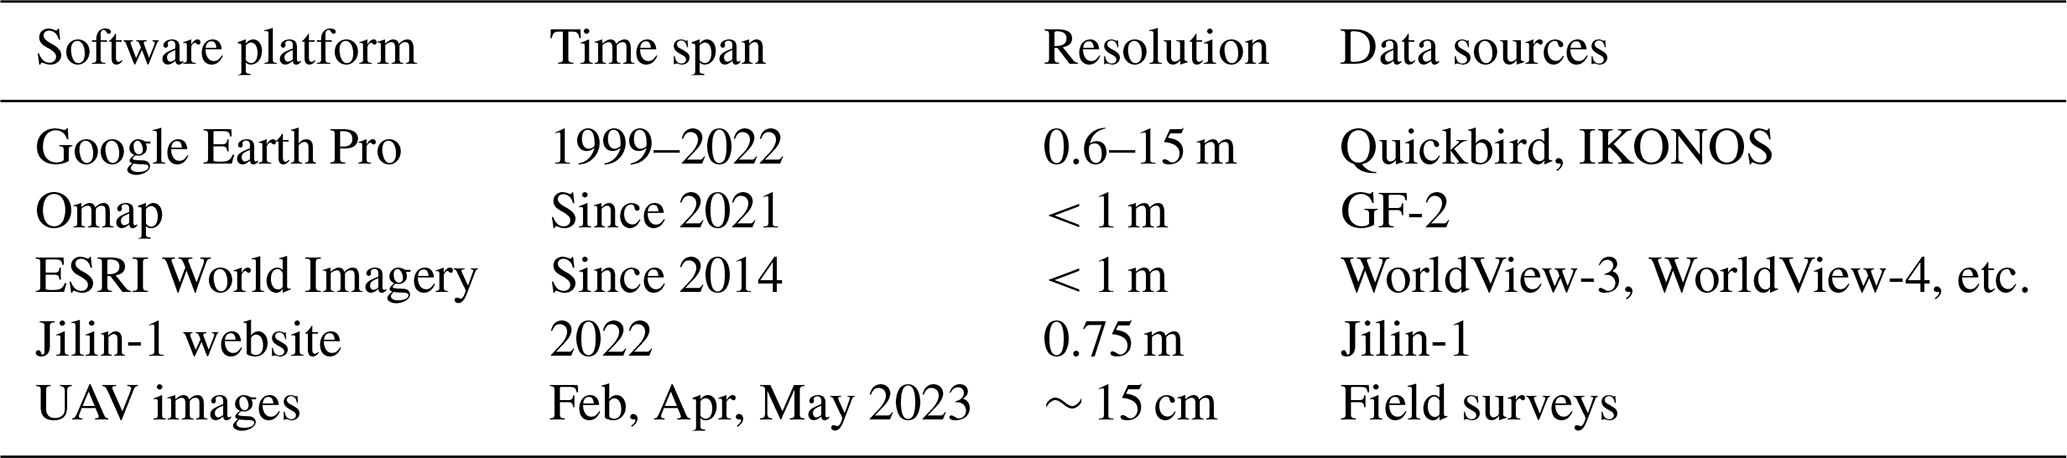
We collected and collated validated satellite imagery available starting in 1999 for temporal detection of the onset of the HT formation. These data include uncrewed aerial vehicle imagery (e.g., Fig. 1b–h) and 30 m resolution digital elevation model data from the Shuttle Radar Topography Mission (Farr et al., 2007). A combination of Omap and Google Earth software was used to detect the location of HT occurrence, and Wayback Imagery provided by ESRI was used to access high-resolution (< 1 m) satellite imagery and Jilin-1 satellite imagery (0.75 m) provided free of charge by China Commercial Satellite Corporation to aid in the identification (Table 1). In addition, we used digital elevation model data to calculate variables such as the slope and topographic position index (TPI) of the HT. The TPI is calculated as follows (Liang, 2023):
where E is the elevation (m), S is the slope (°), and Mean indicates that the mean value for the entire Qilian Mountains region is used.
To further analyze the distribution of HT and the analogous environmental variables, we obtained seismic data from the U.S. Geological Survey (USGS, 2024) describing earthquakes, including their timing, epicenter location, and magnitude. Categorizing vegetation types into deciduous–coniferous forests (DCF), undergrowth (U), alpine scrub meadow (ASM), alpine meadow (AM), alpine grassland (AG), alpine vegetation (AV), and non-vegetated area (NA) was based on data from the Resource and Environment Science and Data Center (RESDC, 2001). To assess the relationship of air temperature and precipitation with HT, we downloaded monthly mean air temperature and precipitation at 2 m a.g.l. from the fifth generation of the European Centre for Medium-Range Weather Forecasts (ECMWF) reanalysis (ERA5; Muñoz Sabater, 2019).
4.1 Manual mapping
We first quantified and mapped HT via remote sensing observations. Most occurrences of HT in the permafrost region of the Qilian Mountains since 2000 were compiled by visual interpretation in Google Earth Pro and Omap. They were also aided by high-resolution (< 1 m) observations from ESRI Wayback Imagery, which archives all published versions of world imagery (Table 1). We used a fishnet with a mesh size of 1 × 1 km to segment the latest satellite imagery for the entire Qilian Mountains area to quantify HT mesh by mesh. RTSs are often horseshoe-shaped, tongue-shaped, elongated, branched, and circle-chair-shaped (Lantuit and Pollard, 2008; Yin et al., 2021) and characterized by a steep backwall, low-angle bottom, and tongue of displaced saturated soil (Lantz and Kokelj, 2008; Nicu et al., 2021). These features are tonally and morphologically different from their surroundings in color satellite images during the thawing season. RTSs also produce folded textures due to soil accumulation, which appear as laterally folded stripes on imagery. Active-layer detachment slides are a common shallow landslide in permafrost areas. Their morphological characteristics vary based on vegetation cover, slope, and permafrost conditions, but common features include highly disturbed slopes, lateral shear zones, and fracture zones formed after the sliding of the active layer (Lewkowicz, 2007). We detected and sketched these features based on morphological, tonal, textural, shading, and other characteristics on remote sensing images and then digitized their morphological features into polygonal data. Although the accuracy of this type of visual interpretation is relatively high, some HT features can be missed via this manual interpretation. To reduce such errors, satellite images of a similar period from different sources were evaluated four times using the same methods to ensure accurate results. The date of the satellite image when perturbations caused by HT can be first observed was defined as the initiation year of a particular HT feature. Depending on the initiation year, HT is categorized as occurring before 2010, during 2010–2015, or after 2015. To observe the temporal evolution of HT features, we used the initiation year and retraced historical images covering the Qilian Mountains, a process that also helped us distinguish between HT features and one-time transient landslides.
4.2 Field verification
Similar HT can have different morphological characteristics due to different triggers. It is thus difficult to identify the type of HT simply through imagery. In addition, after an initial trigger and HT formation, thermokarst can evolve into different types. For example, active-layer detachment slides may transition into RTSs due to the exposure of subsurface ice at the trailing edge and water erosion due to thawing, which can cause the RTS to further progress into mudflows. Therefore, with visual interpretation based on imagery only providing individual snapshots, it is essential to also conduct field surveys as a validation exercise. We conducted a total of three field surveys in the winter of 2022 and the spring and summer of 2023. Field work covered the Shiyanghe basin, Heihe basin, Datonghe basin, Qinghai Lake basin, and Shulehe basin. Due to the harsh climatic conditions and accessibility issues in the Qilian Mountains, uncrewed aerial vehicles were used to survey and verify hard-to-reach areas.
4.3 Morphological and spatial statistical analysis
A landscape shape index (LSI) can be quantified to characterize shape complexity by calculating the degree of deviation of a given patch from a circle or square of the same area. To quantify the shape characteristics of HT features, two LSIs are calculated as follows:
where P is the perimeter (m) and A is the area (m2). The closer the values of LSIsquare or LSIround are to 1, the squarer or rounder, respectively, the shape of the HT feature is.

Figure 2Frequency distribution of HT on the Qilian Mountains. The concentration of HT features is shown per 100 km2 grid cell.
To further investigate the spatial distribution of HT, we computed a global Moran index, z score, and p value to determine whether there is autocorrelation in the spatial distribution of HT, where p values of z scores are used to measure statistical significance. When the p value < 0.01 and the z score > 2.58, there is a 99 % probability that HTs will be clustered within the study area. The smaller the p value and the larger the z score, the greater the probability that such spatial patterns will be clustered. Moran's index ranges from −1 to 1, with negative values corresponding to negative correlations and positive values to positive correlations, and 0 denotes that the spatial objects in the study area are independent of each other. Additionally, the closer the index is to 1, the more clustered the HT features are, and the closer the index is to −1, the more dispersed the HT features are. To delineate the regions that may have spatial autocorrelation (Bivand and Wong, 2018), we further process local autocorrelation on this basis. The local autocorrelation regions are divided into four types based on the local Moran index: high–high (HH) clustering, high–low (HL) clustering, low–high (LH) clustering, and low–low (LL) clustering. HH signifies a region with both a higher amount of HT and a higher number of neighboring regions also with a higher amount of HT, HL indicates a region with a higher amount of HT surrounded by neighboring regions with a lower amount of HT, LH indicates a region with a lower number of HT neighboring areas with a higher amount of HT, and LL represents a region with both a lower amount of HT and neighboring regions with a lower amount of HT. Although the methods described above can identify global and local spatial autocorrelations, respectively, they are unable to identify clusters of concentrated HT features. We therefore also apply hotspot analysis, which is another effective way of exploring the characteristics of local spatial distributions. All the above techniques are based on spatial statistical analysis functions in ArcGIS.
To explore the effects of climate on HT, we obtained the monthly mean air temperature and precipitation at 2 m a.g.l. from ERA5 over the period 2000–2020 and calculated their annual spatial means and standard deviations (Fig. 6).
Our inventory of HT includes the Heihe basin, Shulehe basin, Datonghe basin, Shiyanghe basin, Qinghai Lake basin, and Tsaidam basin within the Qilian Mountains, with a total of 1064 HT features. In any 100 km2 grid cell, the maximum density of HT is 63 (Fig. 2). This density is lower than the 68 per 25 km2 in the central Tibetan Plateau reported by Luo et al. (2022) and the 88 per 25 km2 on Banks Island, Canada, from Lewkowicz and Way (2019); 67 % of these HT features were identified in the Heihe River basin, followed by the Datonghe River basin, accounting for 19 %. The HT distribution in these river basins is irregular, corroborated by a positive statistically significant Moran index value of 0.3, a p value of 0.00001, and a z score of 32.5. Of all the HT features, the largest area is 58 ha and the smallest area is 0.01 ha, with most being smaller than 10 ha. The average area is 1.75 ha, with a total area of 1708 ha.
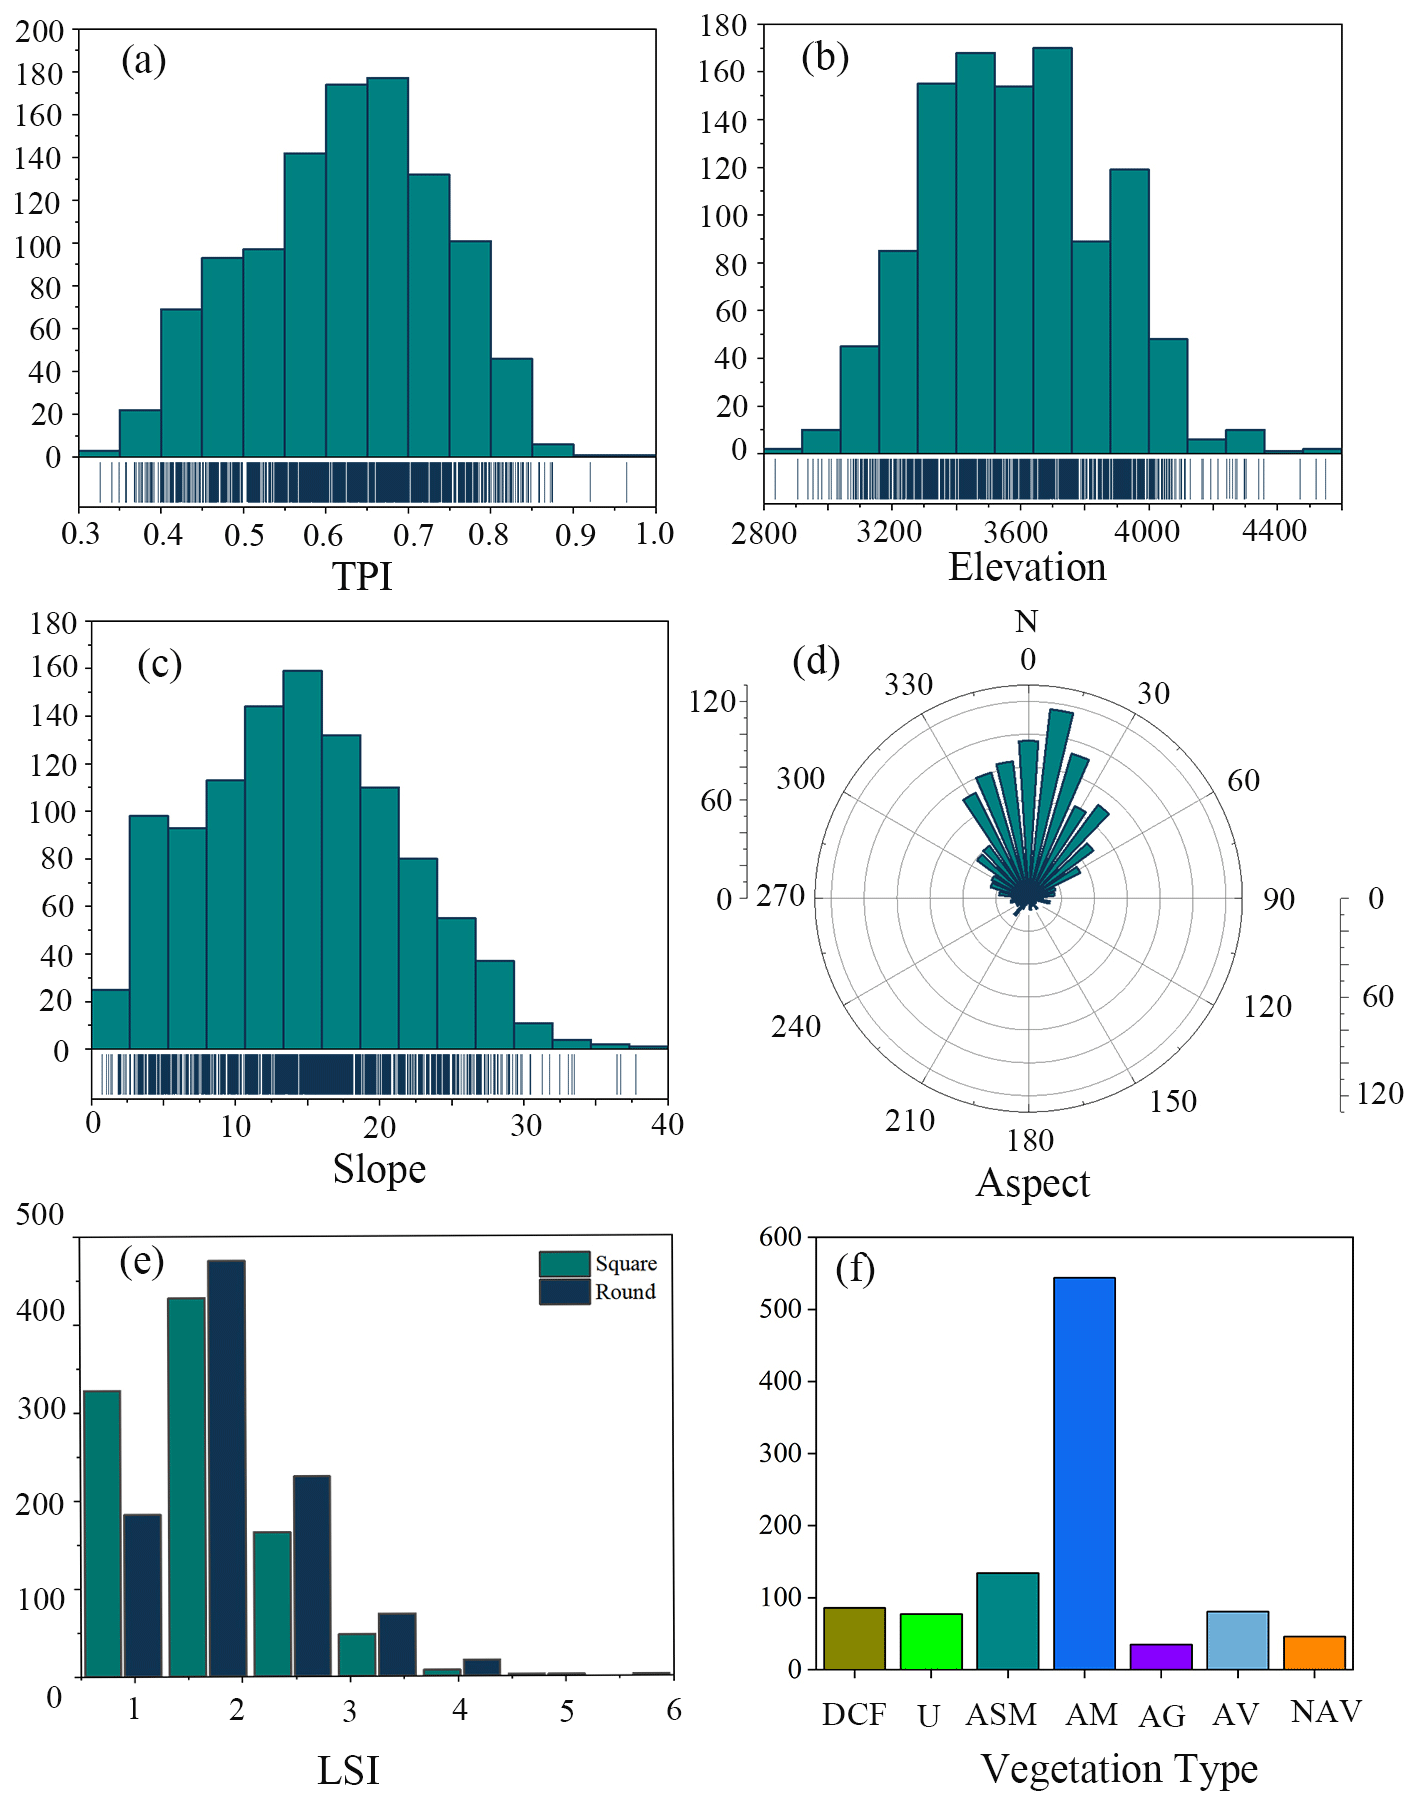
Figure 3The number of HT terrain features (y axes) of HT as categorized by the (a) topographic position index (TPI), (b) elevation, (c) slope, (d) aspect, (e) landscape shape index (LSI), and (f) vegetation type, including deciduous–coniferous forests (DCF), undergrowth (U), alpine scrub meadow (ASM), alpine meadow (AM), alpine grassland (AG), alpine vegetation (AV), and non-vegetated area (NA). The blue vertical lines at the bottom of panels (a–c) represent the number of HT features in each x-axis bin.
The spatial distribution of RTSs on the QTP is strongly controlled by terrain factors such as the elevation, slope, TPI, and aspect (Luo et al., 2022). The statistical results indicate that HT is observed at elevations ranging from 2835 to 4550 m. However, 90 % of HTs are more likely to occur at elevations ranging from 3200 to 4000 m in the middle- or high-elevation areas of the Qilian Mountains. HT tends to occur on north-facing slopes (Fig. 3b and d), with slopes ranging from 3 to 25° (Fig. 3c). In addition, the TPI shows that ∼ 85 % of the HTs occur mainly between 0.5 and 0.8 (Fig. 3a), suggesting that they commonly occur in locations that are lower than their surroundings. Both LSI indices suggest that 75 % of the HTs have values close to 1.0 (Fig. 3e), indicating that most HTs are simple in shape and compact in morphology (Niu et al., 2016). Alpine meadow areas contain ∼ 53 % of HTs, followed by alpine scrub meadows, which contain 13 % (Fig. 3f).

Figure 4The timing of HT initiation within 100 km2 grid cells.
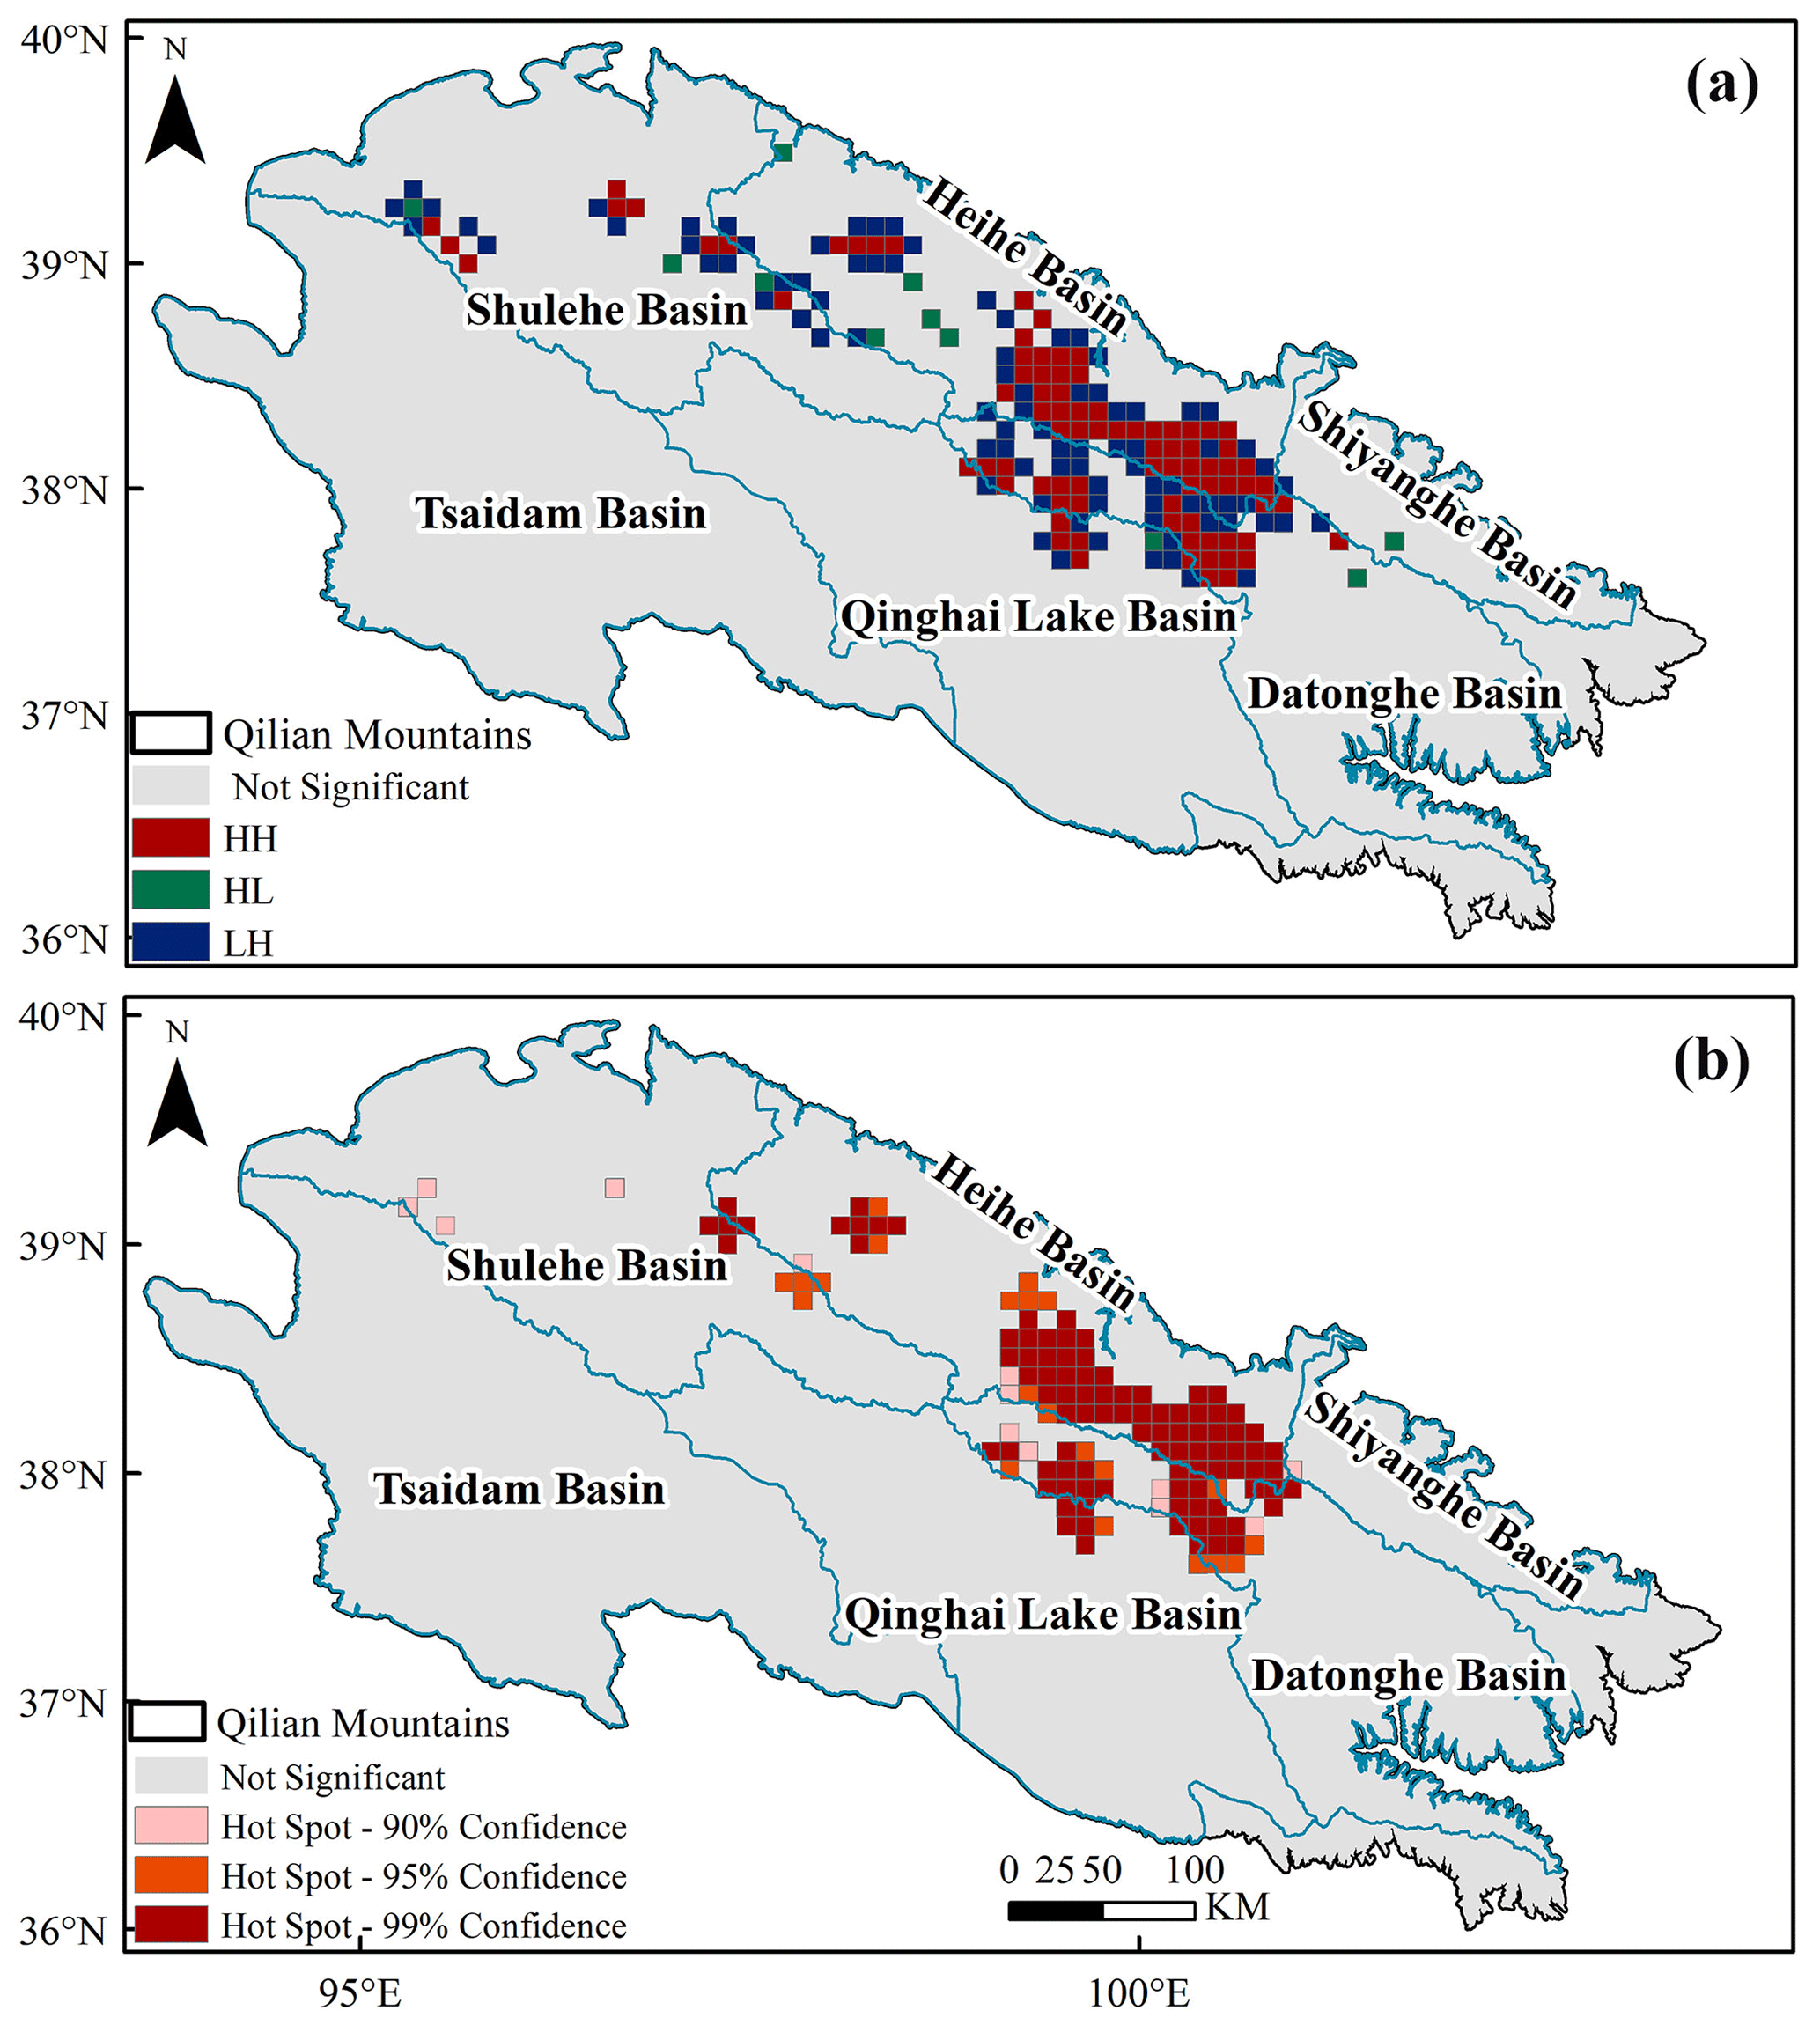
Figure 5(a) Spatial autocorrelation indicating high–high (HH), high–low (HL), and low–high (LH) clustering, together with (b) hotspot analysis where the different colors represent the confidence levels.
The initiation years of HT features are variable across the study area: 187 HT features (18 %) were identified before 2010 and the remaining 82 % in the last 10 years; 392 sites (37 %) were initiated in 2010–2015 and 482 (45 %) after 2015. Much of the newly initiated HT occurred in the Heihe basin and the middle and upper reaches of the Datonghe basin (Fig. 4), which is also a HT hotspot region. The recent increase in HT can be attributed to the anomalous weather conditions in the corresponding years. The association between newly observed HT and meteorological data indicates a sudden HT increase in years with unusually high temperatures during the thawing season (Fig. 6).
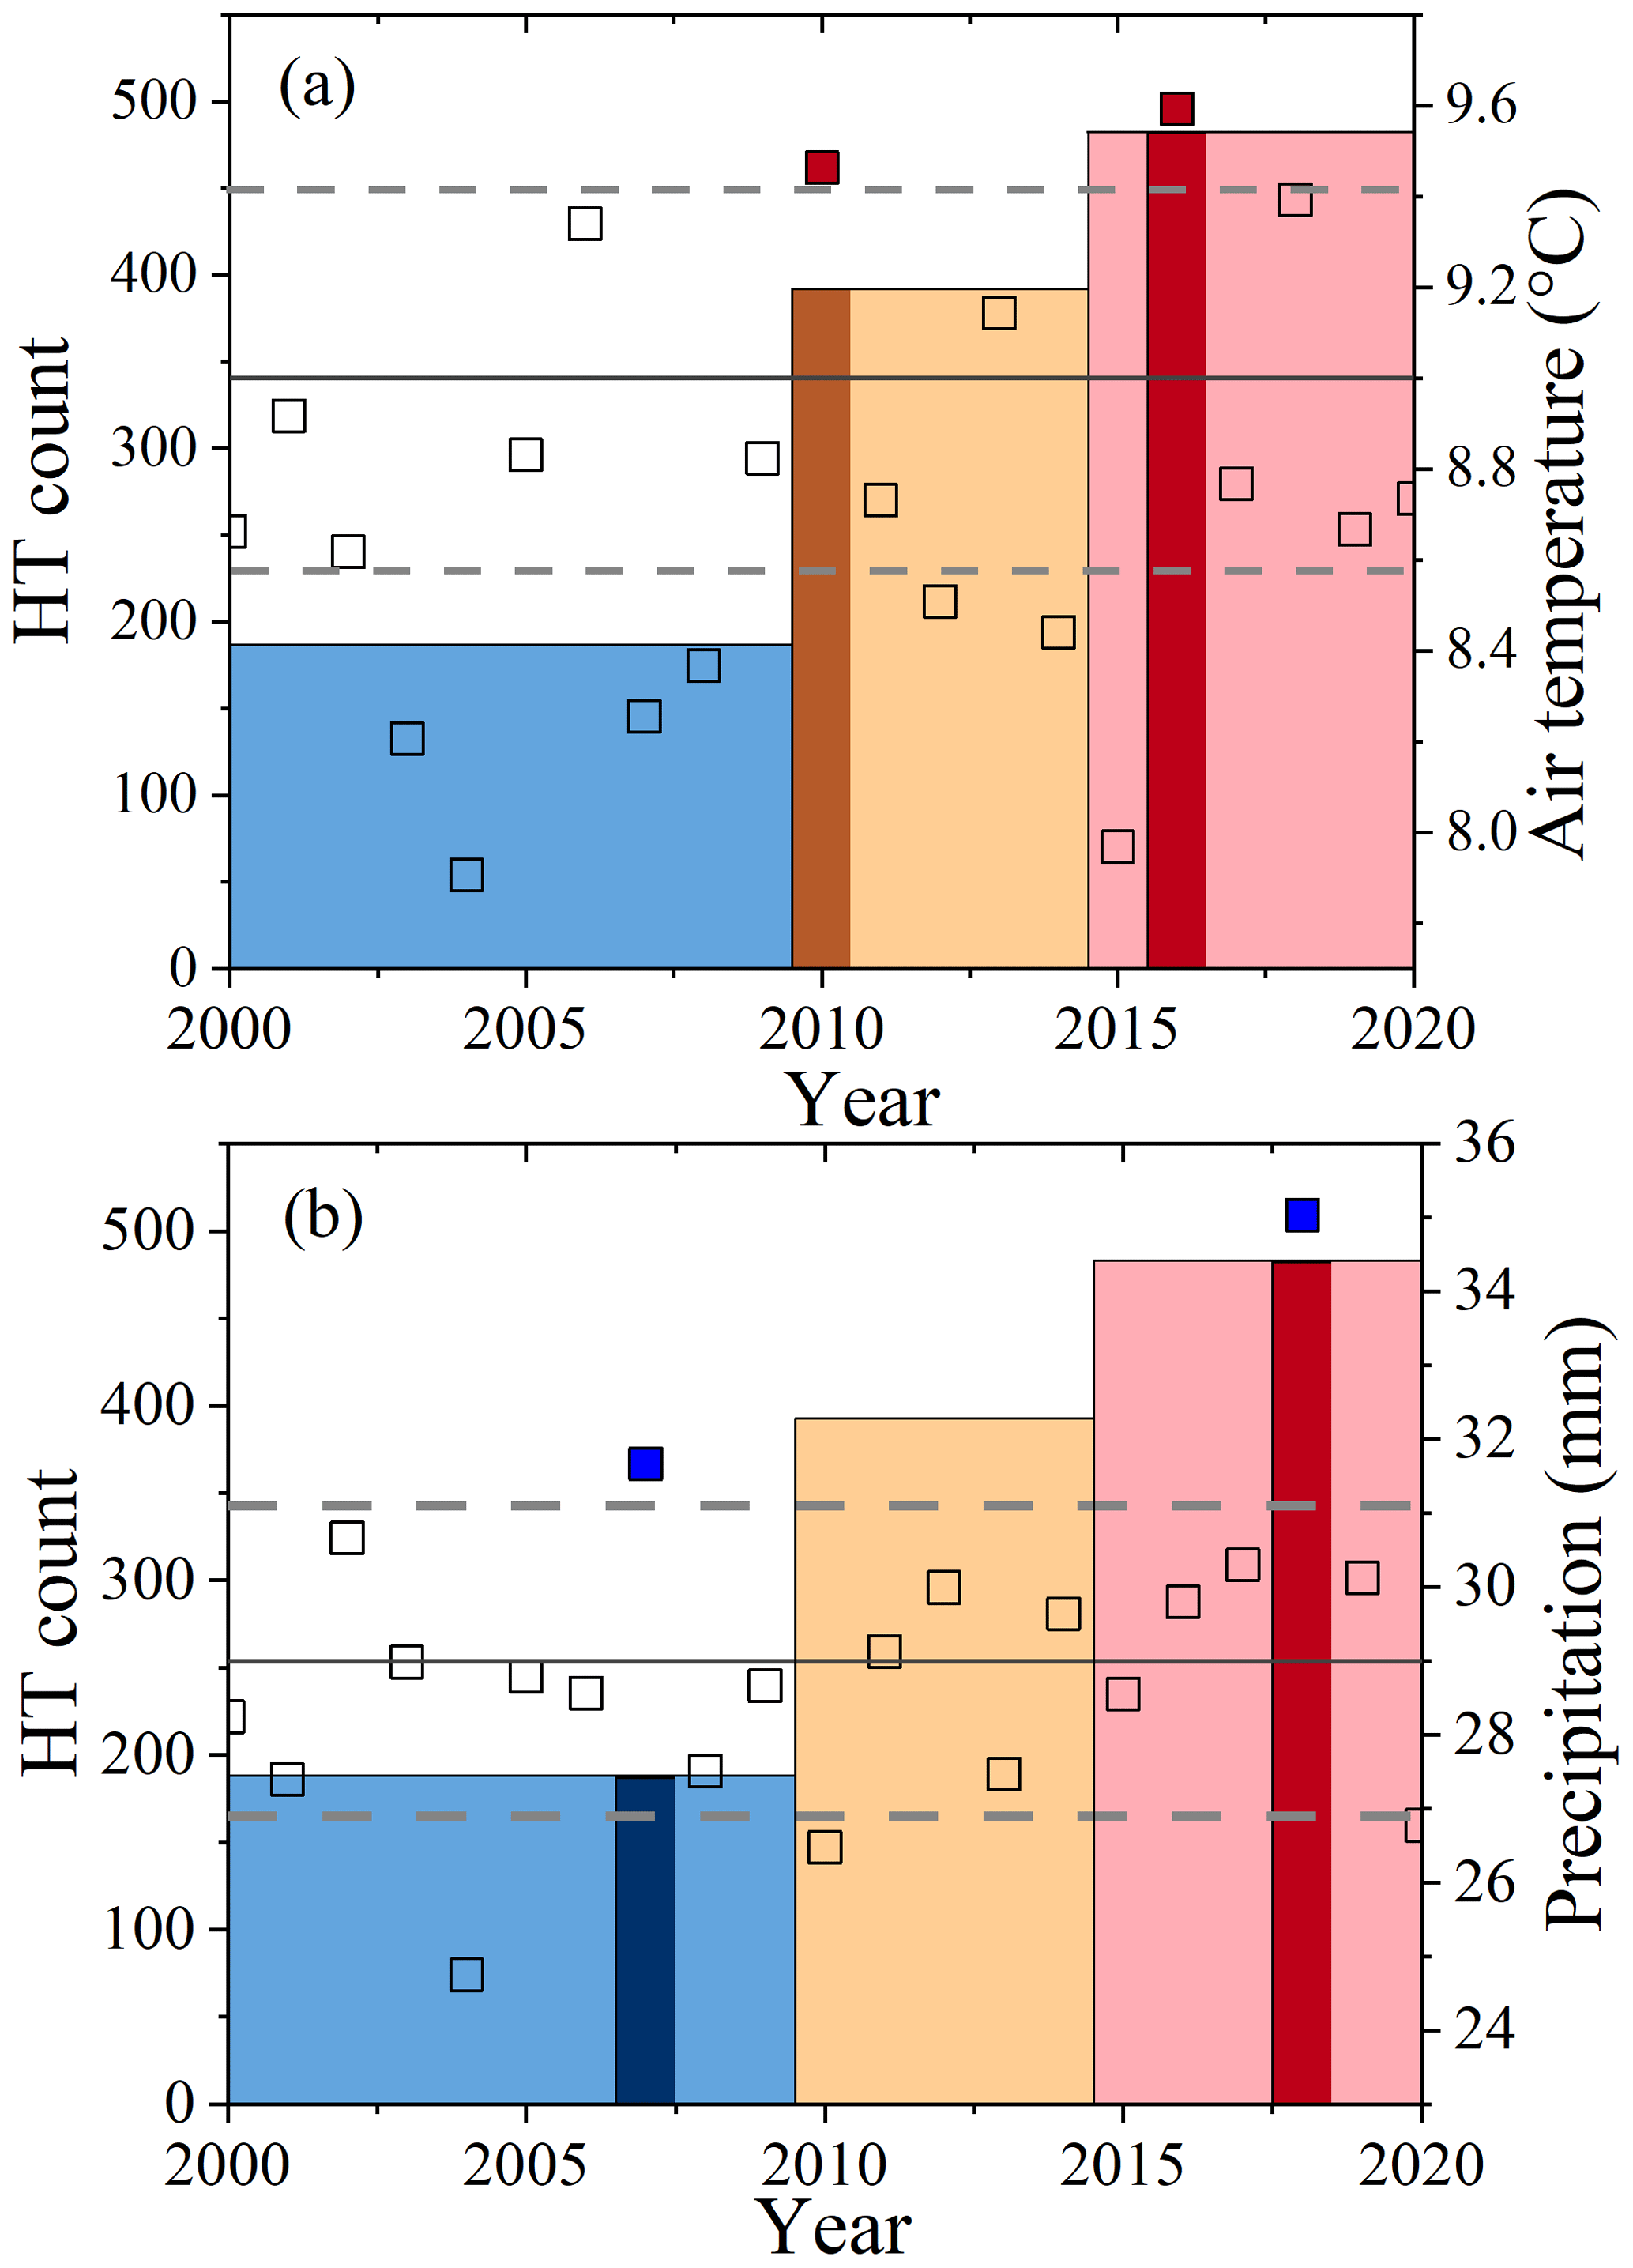
Figure 6The relationship between HT numbers (variable-width bars, with the darker colors representing years with extreme weather events) and (a) temperature and (b) precipitation in the thawing season from 2000 to 2020 (square symbols, with the red squares and the blue squares representing the extreme weather events). The solid horizontal line represents the mean air temperature and precipitation, respectively, and the dashed lines represent ± 1 standard deviation.
6.1 Drivers of HT in the Qilian Mountains
6.1.1 Permafrost conditions
Formation of HT is facilitated by thick subsurface ice and various internal and external environmental conditions (Stephani et al., 2023). Permafrost stability in ∼ 80 % of the permafrost area of the Qilian Mountains is predominantly transitional, and higher permafrost temperatures (Ran et al., 2021) will exacerbate the climate sensitivity of this area (Lewkowicz and Way, 2019; Patton et al., 2021), leading to melting of the subsurface ice and an increase in active-layer thickness, thus decreasing the stability of the slope (Behnia and Blais-Stevens, 2018). This is also supported by our finding that ∼ 90 % of HT occurs in the transition zone between permafrost and seasonally frozen soil where the mean annual ground temperature is greater than −1 °C.
6.1.2 Environmental factors
Topographic conditions facilitate the formation of subsurface ice and the continuous development of HT. At elevations below 5100 m on the QTP, aspect dominates the distribution of permafrost. More permafrost underlies regions of shaded, north-facing slopes than sunny, south-facing slopes (Ran et al., 2021). Indeed, we find that ∼ 95 % of Qilian Mountains HT is found on north-facing slopes, where it also enhances vegetation growth and soil moisture storage (Jin et al., 2009). Lower solar radiation, higher permafrost ice content, and shallow active-layer thickness (Lacelle et al., 2015; Ward Jones et al., 2019) also enable HT formation (Luo et al., 2022; Niu et al., 2016; Xia et al., 2022). We find that more than half of the HT occurs in alpine meadows, which requires more water content than alpine steppes (Yin et al., 2017) and consequently also results in more ground ice development under this vegetation type. We determined that ∼ 90 % of HT in the Qilian Mountains occurs on 3 to 25° slopes. Low and gentle slopes are favorable for groundwater pooling (Luo et al., 2022), whereas slopes greater than 16° are relatively steep and therefore not conducive to groundwater enrichment for ice formation, but such slopes also provide dynamic conditions for active-layer detachments and collapsing ground (Wang, 1990). We also observe more HT initiation at locations that are lower compared to their surroundings, as such depressions favor the accumulation of snow and rainwater (Stieglitz et al., 2003) and prevent heat loss from the soil. This encourages melting of subsurface ice (Zhang, 2005) at the base of the active layer and, after an unstable layer is formed between the permafrost and the active layer, the overlying soil can slide along the slope (Patton et al., 2021).
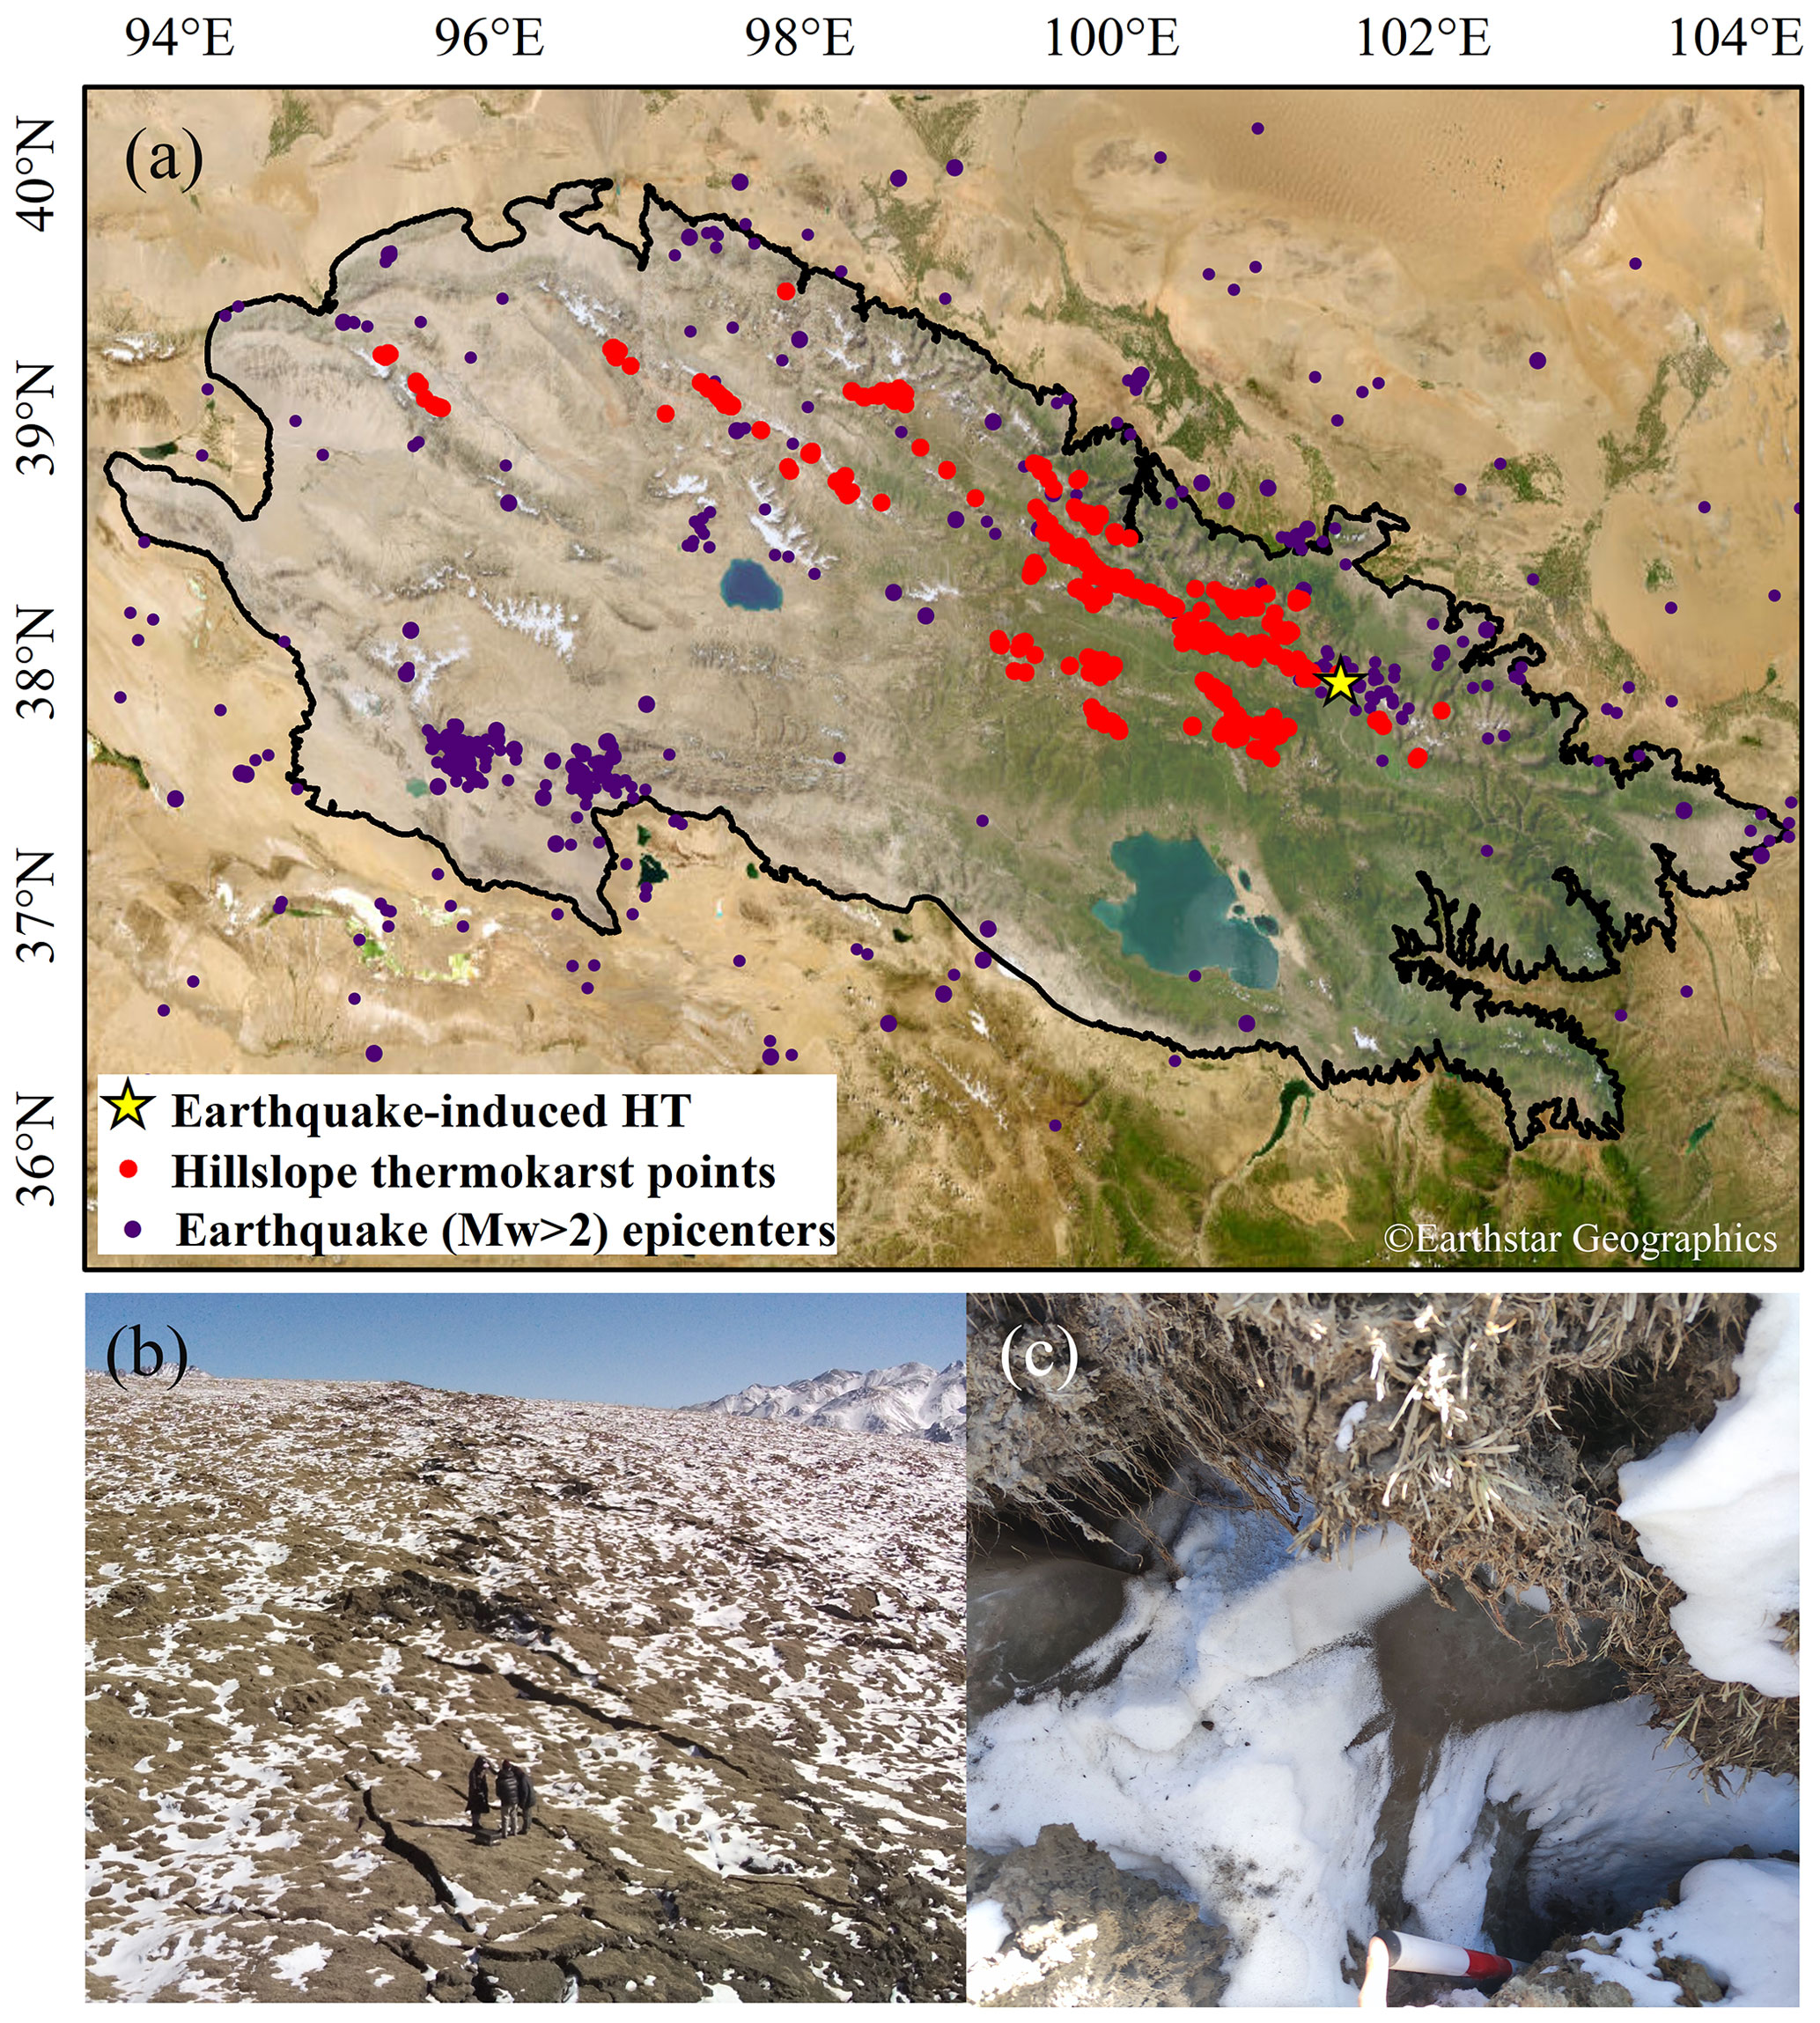
Figure 7Qilian Mountains showing (a) the location of HT locations and earthquakes with magnitude > 2 in the last 20 years, (b) slope fractures caused by earthquakes, and (c) exposed subsurface ice.
The Qilian Mountains were and are still formed by the ongoing collision of the Indian Ocean Plate and the Eurasian Plate, resulting in the Qilian Mountains–Hexi Corridor active fault system (Xiong et al., 2017) that has seen nearly 400 earthquakes of magnitude 2 or greater over the past 2 decades. In particular, the high seismic activity of the Heihe, Shiyanghe, and Datonghe basins (Fig. 7a) represents a potential threat to the safety and integrity of current and future infrastructure in the region. During our field investigations we found a nearly 3 km long and 2 m deep slope fracture caused by a 6.9 magnitude earthquake in 2022, resulting in a massive exposure of subsurface ice and the collapse of the Lanzhou–Xinjiang high-speed rail tunnel (Fig. 7b and c). The occurrence of an earthquake can result in an instantaneous increase in porewater pressure and sliding forces that reduce slope stability and potentially lead to a massive exposure of subsurface ice (Niu et al., 2016; Xia et al., 2022), sediment liquefaction (Dadfar et al., 2017), and permafrost warming due to the seismic vibrations. These vibrations lead to cracking and deformation of the ice layers within the permafrost, releasing moisture and heat and consequently resulting in a temperature rise of the permafrost. Additionally, earthquakes can induce the flow of porewater within the permafrost, further influencing its temperature (Che et al., 2014) and creating the ideal setting for active-layer detachment slides. The clustering of earthquake activity in the lower-left corner of Fig. 7a is not associated with HT features, because there is no permafrost in this region.
6.1.3 Climate factors
Extreme summer temperatures and precipitation have been identified as triggers for the initiation of RTSs in many Arctic permafrost zones (Balser et al., 2014; Kokelj et al., 2015; Lewkowicz and Way, 2019; Segal et al., 2016). Given our finding that 82 % of HT was initiated in approximately the last decade (Fig. 4), mostly during 2010–2015 and after 2015, we used ERA5 to determine the temperature and precipitation characteristics for the Qilian Mountains over the last 20 years (Li et al., 2022b) (Fig. 6, square symbols). The mean thawing season air temperatures in 2010 and 2016 were higher than in other years (Fig. 6a, red square symbols). A warming thaw season could lead to thaw consolidation at the base of the active layer or to higher porewater pressure in the transient thaw layer, reducing the effective shear strength and causing slope failure (Lewkowicz and Way, 2019). The anomalous air temperatures during the thawing season could accelerate permafrost thaw and expose ice-rich permafrost, thus leading to new HT (Fig. 6a, dark brown and dark red bars, respectively). Rainfall infiltration may transfer heat to the top layer of the permafrost and induce melting of ground ice in ice-rich transient layers, which would increase the porewater pressure at the active layer–permafrost interface and thereby trigger formation of HT (Luo et al., 2022). However, precipitation variability during the thawing season does not match HT formation (Fig. 6b). Despite high precipitation in both 2007 and 2018 (Fig. 6b, blue squares), no initiation of HT was found to subsequently coincide with these peaks (blue squares), and precipitation also does not explain the significant initiation of HTs between 2010 and 2015 or after 2015 (Fig. 6b, yellow and red bars, respectively). The same conclusion also applies to the other three subregions – Hoh Xil, Maqu County, and Honglianghe – and it could be speculated that the nature of the soils on the QTP may instead play a role (Luo et al., 2022).
6.1.4 Human activities
Extensive and increasing human activities have been shown to significantly accelerate permafrost degradation (Cheng and Jin, 2013; IPCC, 2019). The total population of the Qilian Mountains is about 60 000, and there are approximately 1000 metal, energy, and other types of mineral deposits (NMPD, 2021) and ∼ 8000 km of railroads and highways. The core of this human activity is concentrated on the eastern side of the Qilian Mountains, which generally coincides with the spatial distribution of the HT hotspots we documented. This qualitatively suggests a role of human activities in HT from, e.g., engineering disturbances or vegetation degradation due to overgrazing (Sharkhuu et al., 2007). Establishing the impact of human activities on HT quantitatively is still a difficult challenge, but our identification of the location and timing of HT formation is a first, important step for further future studies, and especially for the socioeconomic development in the region.
DEM data can be accessed through NASA (https://www.earthdata.nasa.gov/sensors/srtm, Farr et al., 2007). Landsat5–8 data are available from the USGS (https://www.usgs.gov/, last access: 29 April 2024; Gorelick et al., 2017) and Sentinel-2 from the ESA (https://www.esa.int/, last access: 29 April 2024; Gorelick et al., 2017) and can be downloaded through Google Earth Engine. ESRI World Imagery can be accessed through ESRI Wayback Imagery at https://livingatlas.arcgis.com/wayback (Esri Inc., 2023). Some GF-2 imagery is also available online through the Omap software (https://www.ovital.com/283-2/, GF-2, 2020), and high-resolution 3D satellite imagery of the Qilian Mountains region can be viewed in Google Earth software. High-resolution satellite images captured by the Jilin-1 satellite in China can be viewed by accessing https://www.jl1mall.com/rskit/viewMapSource (Jilin-1 satellite Inc., 2022). The HT inventory for the Qilian Mountains can be freely downloaded from the National Tibetan Plateau/Third Pole Environment Data Center (https://doi.org/10.11888/Cryos.tpdc.300805, Peng and Yang, 2023).
This study used visual interpretation and field investigations with repeated verification to investigate HT in the permafrost zone of the Qilian Mountains. We successfully produced the first HT inventory for this area, identifying a total of 1064 HT features. The area of these features ranged from 0.01 to 58 ha, with an average of 1.75 ha. Thermokarst is primarily concentrated at the junction between the upstream portion of the Heihe basin and the middle and upstream portions of the Datonghe basin. Within a 10 × 10 km area, thermokarst has a maximum density of 63 features, affecting an area of ∼ 20 km2. HT in the Qilian Mountains is more likely to occur on north-facing shaded slopes at elevations between 3200 and 4000 m, on slopes of 3–25°, with 0.5 < TPI < 0.8, and in alpine meadow vegetation. Based on long-term satellite imagery, 874 new HT features were initiated after 2010, accounting for 82 % of all HT features. Of these, 392 and 482 were initiated during the periods of 2010–2015 and after 2015, respectively. Recent higher air temperatures during the thawing season are likely important reasons for the intensification of HT formation in the Qilian Mountains, while precipitation does not seem to play a role. This first HT inventory for the Qilian Mountains will be fundamental for quantitative assessments that explore the exact causes and underlying thermokarst processes, providing observational data support for automated extraction of HT features and ultimately enhancing the identification and prediction of regions prone to thermokarst processes in the future. Furthermore, it will facilitate the evaluation of local risk levels, potential economic losses, population casualties, and other impacts, thereby furnishing governmental decision-makers and relevant stakeholders with essential reference materials for mitigating potential risks.
XP and GY designed the research and obtained funding. GY analyzed the data and prepared the data files. GY, WT, XL, and XP conducted the field work. GY, XP, OWF, JL, CM, and FN wrote the paper with input from the co-authors and coordinated the analysis and contributions from all the co-authors. XP and GY contributed to the work equally and should be regarded as co-first authors.
The contact author has declared that none of the authors has any competing interests.
Publisher's note: Copernicus Publications remains neutral with regard to jurisdictional claims made in the text, published maps, institutional affiliations, or any other geographical representation in this paper. While Copernicus Publications makes every effort to include appropriate place names, the final responsibility lies with the authors.
We sincerely appreciate the valuable feedback and constructive suggestions provided by the two anonymous reviewers and Haijun Qiu on this manuscript. Their insightful comments have significantly enhanced the quality and clarity of our work. We also extend our heartfelt gratitude to the editors for their dedication and meticulous attention throughout the review and publication process. Furthermore, we express our gratitude to the data providers mentioned in the manuscript for their selfless sharing of datasets. Their spirit of open collaboration and their willingness to share data have been crucial to the completion of this research.
This research has been supported by the Second Tibetan Plateau Scientific Expedition and Research Program (STEP) (grant no. 2019QZKK0905), the National Natural Science Foundation of China (grant nos. 42161160328 and 42171120), and the Fundamental Research Funds for the Central Universities (grant no. lzujbky2023-01).
This paper was edited by Hao Shi and reviewed by Haijun Qiu and two anonymous referees.
Balser, A. W., Jones, J. B., and Gens, R.: Timing of retrogressive thaw slump initiation in the Noatak Basin, northwest Alaska, USA, J. Geophys. Res.-Earth, 119, 1106–1120, https://doi.org/10.1002/2013JF002889, 2014.
Behnia, P. and Blais-Stevens, A.: Landslide susceptibility modelling using the quantitative random forest method along the northern portion of the Yukon Alaska Highway Corridor, Canada, Nat. Hazards, 90, 1407–1426, https://doi.org/10.1007/s11069-017-3104-z, 2018.
Bivand, R. S. and Wong, D. W. S.: Comparing implementations of global and local indicators of spatial association, TEST, 27, 716–748, https://doi.org/10.1007/s11749-018-0599-x, 2018.
Che, A., Wu, Z., and Wang, P.: Stability of pile foundations base on warming effects on the permafrost under earthquake motions, Soils Found., 54, 639–647, https://doi.org/10.1016/j.sandf.2014.06.006, 2014.
Chen, H., Zhu, Q., Peng, C., Wu, N., Wang, Y., Fang, X., Gao, Y., Zhu, D., Yang, G., Tian, J., Kang, X., Piao, S., Ouyang, H., Xiang, W., Luo, Z., Jiang, H., Song, X., Zhang, Y., Yu, G., Zhao, X., Gong, P., Yao, T., and Wu, J.: The impacts of climate change and human activities on biogeochemical cycles on the Qinghai-Tibetan Plateau, Glob. Change Biol., 19, 2940–2955, https://doi.org/10.1111/gcb.12277, 2013.
Cheng, G. and Jin, H.: Permafrost and groundwater on the Qinghai-Tibet Plateau and in northeast China, Hydrogeol. J., 21, 5–23, https://doi.org/10.1007/s10040-012-0927-2, 2013.
Dadfar, B., El Naggar, M. H., and Nastev, M.: Quantifying exposure of linear infrastructures to earthquake-triggered transverse landslides in permafrost thawing slopes, Can. Geotech. J., 54, 1002–1012, https://doi.org/10.1139/cgj-2017-0076, 2017.
Esri Inc.: Wayback imagery, Esri Inc. [data set], https://livingatlas.arcgis.com/wayback/ (last access: 25 April 2024), 2023.
Farr, T. G., Rosen, P. A., Caro, E., Crippen, R., Duren, R., Hensley, S., Kobrick, M., Paller, M., Rodriguez, E., Roth, L., Seal, D., Shaffer, S., Shimada, J., Umland, J., Werner, M., Oskin, M., Burbank, D., and Alsdorf, D.: The Shuttle Radar Topography Mission, Rev. Geophys., 45, 2005RG000183, https://doi.org/10.1029/2005RG000183, 2007 (data available at: https://www.earthdata.nasa.gov/sensors/srtm, last access: 29 April 2024).
GF-2: Gaofen-2 imagery, Omap Inc. [data set], https://www.ovital.com/283-2/ (last access: 25 April 2024), 2020.
Gooseff, M. N., Balser, A., Bowden, W. B., and Jones, J. B.: Effects of Hillslope Thermokarst in Northern Alaska, Eos T. Am. Geophys. Un., 90, 29–30, https://doi.org/10.1029/2009EO040001, 2009.
Gorelick, N., Hancher, M., Dixon, M., Ilyushchenko, S., Thau, D., and Moore, R.: Google Earth Engine: Planetary-scale geospatial analysis for everyone, Remote Sens. Environ., 202, 18–27, https://doi.org/10.1016/j.rse.2017.06.031, 2017.
Huang, L., Luo, J., Lin, Z., Niu, F., and Liu, L.: Using deep learning to map retrogressive thaw slumps in the Beiluhe region (Tibetan Plateau) from CubeSat images, Remote Sens. Environ., 237, 111534, https://doi.org/10.1016/j.rse.2019.111534, 2020.
Huang, L., Willis, M. J., Li, G., Lantz, T. C., Schaefer, K., Wig, E., Cao, G., and Tiampo, K. F.: Identifying active retrogressive thaw slumps from ArcticDEM, ISPRS J. Photogramm., 205, 301–316, https://doi.org/10.1016/j.isprsjprs.2023.10.008, 2023.
Jilin-1 satellite Inc.: Jilin-1 satellite imagery, Jilin-1 satellite Inc. [data set], https://www.jl1mall.com/rskit/viewMapSource (last access: 25 April 2024), 2022.
Jin, H., Li, X., Frauenfeld, O. W., Zhao, Y., Chen, C., Du, R., Du, J., and Peng, X.: Comparisons of statistical downscaling methods for air temperature over the Qilian Mountains, Theor. Appl. Climatol., 149, 893–896, https://doi.org/10.1007/s00704-022-04081-w, 2022.
Jin, X., Wan, L., Zhang, Y.-K., Hu, G., Schaepman, M. E., Clevers, J. G. P. W., and Su, Z. B.: Quantification of spatial distribution of vegetation in the Qilian Mountain area with MODIS NDVI, Int. J. Remote Sens., 30, 5751–5766, https://doi.org/10.1080/01431160902736635, 2009.
Kokelj, S. V. and Jorgenson, M. T.: Advances in Thermokarst Research: Recent Advances in Research Investigating Thermokarst Processes, Permafrost Periglac., 24, 108–119, https://doi.org/10.1002/ppp.1779, 2013.
Kokelj, S. V., Tunnicliffe, J., Lacelle, D., Lantz, T. C., Chin, K. S., and Fraser, R.: Increased precipitation drives mega slump development and destabilization of ice-rich permafrost terrain, northwestern Canada, Global Planet. Change, 129, 56–68, https://doi.org/10.1016/j.gloplacha.2015.02.008, 2015.
Lacelle, D., Brooker, A., Fraser, R. H., and Kokelj, S. V.: Distribution and growth of thaw slumps in the Richardson Mountains–Peel Plateau region, northwestern Canada, Geomorphology, 235, 40–51, https://doi.org/10.1016/j.geomorph.2015.01.024, 2015.
Lantuit, H. and Pollard, W. H.: Fifty years of coastal erosion and retrogressive thaw slump activity on Herschel Island, southern Beaufort Sea, Yukon Territory, Canada, Geomorphology, 95, 84–102, https://doi.org/10.1016/j.geomorph.2006.07.040, 2008.
Lantz, T. C. and Kokelj, S. V.: Increasing rates of retrogressive thaw slump activity in the Mackenzie Delta region, N. W. T., Canada, Geophys. Res. Lett., 35, L06502, https://doi.org/10.1029/2007GL032433, 2008.
Lewkowicz, A. G.: Dynamics of active-layer detachment failures, Fosheim Peninsula, Ellesmere Island, Nunavut, Canada, Permafrost Periglac., 18, 89–103, https://doi.org/10.1002/ppp.578, 2007.
Lewkowicz, A. G. and Way, R. G.: Extremes of summer climate trigger thousands of thermokarst landslides in a High Arctic environment, Nat. Commun., 10, 1329, https://doi.org/10.1038/s41467-019-09314-7, 2019.
Li, Y., Qin, X., Liu, Y., Jin, Z., Liu, J., Wang, L., and Chen, J.: Evaluation of Long-Term and High-Resolution Gridded Precipitation and Temperature Products in the Qilian Mountains, Qinghai–Tibet Plateau, Front. Environ. Sci., 10, 906821, https://doi.org/10.3389/fenvs.2022.906821, 2022.
Liang, L., Sun, Y., Guan, Q., Pan, N., Du, Q., Mi, J., and Shan, Y.: Projection of landscape ecological risk and exploration of terrain effects in the Qilian Mountains, China, Land Degrad. Dev., 34, 4575–4593, https://doi.org/10.1002/ldr.4794, 2023.
Luo, J., Niu, F., Lin, Z., Liu, M., and Yin, G.: Thermokarst lake changes between 1969 and 2010 in the Beilu River Basin, Qinghai–Tibet Plateau, China, Sci. Bull., 60, 556–564, https://doi.org/10.1007/s11434-015-0730-2, 2015.
Luo, J., Niu, F., Lin, Z., Liu, M., and Yin, G.: Recent acceleration of thaw slumping in permafrost terrain of Qinghai-Tibet Plateau: An example from the Beiluhe Region, Geomorphology, 341, 79–85, https://doi.org/10.1016/j.geomorph.2019.05.020, 2019.
Luo, J., Niu, F., Lin, Z., Liu, M., Yin, G., and Gao, Z.: Inventory and Frequency of Retrogressive Thaw Slumps in Permafrost Region of the Qinghai–Tibet Plateau, Geophys. Res. Lett., 49, e2022GL099829, https://doi.org/10.1029/2022GL099829, 2022.
Mu, C., Shang, J., Zhang, T., Fan, C., Wang, S., Peng, X., Zhong, W., Zhang, F., Mu, M., and Jia, L.: Acceleration of thaw slump during 1997–2017 in the Qilian Mountains of the northern Qinghai-Tibetan plateau, Landslides, 17, 1051–1062, https://doi.org/10.1007/s10346-020-01344-3, 2020.
Muñoz Sabater, J.: ERA5-Land monthly averaged data from 1950 to present Copernicus Climate Change Service (C3S) Climate Data Store (CDS) [data set], https://doi.org/10.24381/cds.68d2bb30, 2019.
Muster, S., Roth, K., Langer, M., Lange, S., Cresto Aleina, F., Bartsch, A., Morgenstern, A., Grosse, G., Jones, B., Sannel, A. B. K., Sjöberg, Y., Günther, F., Andresen, C., Veremeeva, A., Lindgren, P. R., Bouchard, F., Lara, M. J., Fortier, D., Charbonneau, S., Virtanen, T. A., Hugelius, G., Palmtag, J., Siewert, M. B., Riley, W. J., Koven, C. D., and Boike, J.: PeRL: a circum-Arctic Permafrost Region Pond and Lake database, Earth Syst. Sci. Data, 9, 317–348, https://doi.org/10.5194/essd-9-317-2017, 2017.
National Mineral Properties Database (NMPD): National Mineral Properties Database 2021 Edition [data set], http://data.ngac.org.cn/mineralresource/index.html (last access: 25 April 2024), 2021.
Nicu, I. C., Lombardo, L., and Rubensdotter, L.: Preliminary assessment of thaw slump hazard to Arctic cultural heritage in Nordenskiöld Land, Svalbard, Landslides, 18, 2935–2947, https://doi.org/10.1007/s10346-021-01684-8, 2021.
Nicu, I. C., Elia, L., Rubensdotter, L., Tanyaş, H., and Lombardo, L.: Multi-hazard susceptibility mapping of cryospheric hazards in a high-Arctic environment: Svalbard Archipelago, Earth Syst. Sci. Data, 15, 447–464, https://doi.org/10.5194/essd-15-447-2023, 2023.
Nitze, I., Grosse, G., Jones, B. M., Romanovsky, V. E., and Boike, J.: Remote sensing quantifies widespread abundance of permafrost region disturbances across the Arctic and Subarctic, Nat. Commun., 9, 5423, https://doi.org/10.1038/s41467-018-07663-3, 2018.
Niu, F., Luo, J., Lin, Z., Liu, M., and Yin, G.: Morphological Characteristics of Thermokarst Lakes along the Qinghai-Tibet Engineering Corridor, Arct. Antarct. Alp. Res., 46, 963–974, https://doi.org/10.1657/1938-4246-46.4.963, 2014.
Niu, F., Luo, J., Lin, Z., Fang, J., and Liu, M.: Thaw-induced slope failures and stability analyses in permafrost regions of the Qinghai-Tibet Plateau, China, Landslides, 13, 55–65, https://doi.org/10.1007/s10346-014-0545-2, 2016.
Olefeldt, D., Goswami, S., Grosse, G., Hayes, D., Hugelius, G., Kuhry, P., McGuire, A. D., Romanovsky, V. E., Sannel, A. B. K., Schuur, E. A. G., and Turetsky, M. R.: Circumpolar distribution and carbon storage of thermokarst landscapes, Nat. Commun., 7, 13043, https://doi.org/10.1038/ncomms13043, 2016.
Patton, A. I., Rathburn, S. L., Capps, D. M., McGrath, D., and Brown, R. A.: Ongoing Landslide Deformation in Thawing Permafrost, Geophys. Res. Lett., 48, e2021GL092959, https://doi.org/10.1029/2021GL092959, 2021.
Peng, X. and Yang, G.: The hillslope thermokarst inventory for the permafrost region of the Qilian Mountains (2000–2020), National Tibetan Plateau/Third Pole Environment Data Center [data set], https://doi.org/10.11888/Cryos.tpdc.300805 (last access: 25 April 2024), 2023.
Ran, Y., Li, X., Cheng, G., Nan, Z., Che, J., Sheng, Y., Wu, Q., Jin, H., Luo, D., Tang, Z., and Wu, X.: Mapping the permafrost stability on the Tibetan Plateau for 2005–2015, Sci. China Earth Sci., 64, 62–79, https://doi.org/10.1007/s11430-020-9685-3, 2021.
Resource and Environment Science Data Center (RESDC): Spatial distribution data of vegetation types in China, RESDC, https://www.resdc.cn/data.aspx?DATAID=122 (last access: 25 April 2024), 2001.
Segal, R. A., Lantz, T. C., and Kokelj, S. V.: Acceleration of thaw slump activity in glaciated landscapes of the Western Canadian Arctic, Environ. Res. Lett., 11, 034025, https://doi.org/10.1088/1748-9326/11/3/034025, 2016.
Sharkhuu, A., Sharkhuu, N., Etzelmüller, B., Heggem, E. S. F., Nelson, F. E., Shiklomanov, N. I., Goulden, C. E., and Brown, J.: Permafrost monitoring in the Hovsgol mountain region, Mongolia, J. Geophys. Res., 112, F02S06, https://doi.org/10.1029/2006JF000543, 2007.
Stephani, E., Darrow, M. M., Kanevskiy, M., Wuttig, F., Daanen, R. P., Schwarber, J. A., Doré, G., Shur, Y., Jorgenson, M. T., Croft, P., and Drage, J. S.: Hillslope erosional features and permafrost dynamics along infrastructure in the Arctic Foothills, Alaska, Permafrost Periglac., 34, 208–228, https://doi.org/10.1002/ppp.2188, 2023.
Stieglitz, M., Déry, S. J., Romanovsky, V. E., and Osterkamp, T. E.: The role of snow cover in the warming of arctic permafrost, Geophys. Res. Lett., 30, 1721, https://doi.org/10.1029/2003GL017337, 2003.
The Intergovernmental Panel on Climate Change (IPCC): The Ocean and Cryosphere in a Changing Climate, https://www.ipcc.ch/srocc/ (last access: 25 April 2024), 2019.
Third Pole Environment Data Center (TPDC): Map of permafrost distribution in the Qilian Mountains, National Tibetan Plateau/Third Pole Environment Data Center [data set], https://doi.org/10.11888/Geocry.tpdc.270456, 2020.
United States Geological Survey (USGS): Earthquake hazards program, USGS, https://earthquake.usgs.gov/earthquakes/search/, last access: 25 April 2024.
Wang, R., Peng, Q., Zhang, W., Zhao, W., Liu, C., and Zhou, L.: Ecohydrological Service Characteristics of Qilian Mountain Ecosystem in the Next 30 Years Based on Scenario Simulation, Sustainability, 14, 1819, https://doi.org/10.3390/su14031819, 2022.
Wang, S.: Thaw Slumping in Fenghuo Mountain Area Along Qinghai-Xizang Highway, Journal of Glaciology and Geocryology, 12, 63–70, https://doi.org/10.7522/j.issn.1000-0240.1990.0007, 1990.
Ward Jones, M. K., Pollard, W. H., and Jones, B. M.: Rapid initialization of retrogressive thaw slumps in the Canadian high Arctic and their response to climate and terrain factors, Environ. Res. Lett., 14, 055006, https://doi.org/10.1088/1748-9326/ab12fd, 2019.
Xia, Z., Huang, L., Fan, C., Jia, S., Lin, Z., Liu, L., Luo, J., Niu, F., and Zhang, T.: Retrogressive thaw slumps along the Qinghai–Tibet Engineering Corridor: a comprehensive inventory and their distribution characteristics, Earth Syst. Sci. Data, 14, 3875–3887, https://doi.org/10.5194/essd-14-3875-2022, 2022.
Xiong, J., Li, Y., Zhong, Y., Lu, H., Lei, J., Xin, W., Wang, L., Hu, X., and Zhang, P.: Latest Pleistocene to Holocene Thrusting Recorded by a Flight of Strath Terraces in the Eastern Qilian Shan, NE Tibetan Plateau, TECTONICS, 36, 2973–2986, https://doi.org/10.1002/2017TC004648, 2017.
Yang, D., Qiu, H., Ye, B., Liu, Y., Zhang, J., and Zhu, Y.: Distribution and Recurrence of Warming-Induced Retrogressive Thaw Slumps on the Central Qinghai-Tibet Plateau, J. Geophys. Res.-Earth, 128, e2022JF007047, https://doi.org/10.1029/2022JF007047, 2023.
Yin, G., Niu, F., Lin, Z., Luo, J., and Liu, M.: Effects of local factors and climate on permafrost conditions and distribution in Beiluhe basin, Qinghai-Tibet Plateau, China, Sci. Total Environ., 581–582, 472–485, https://doi.org/10.1016/j.scitotenv.2016.12.155, 2017.
Yin, G., Luo, J., Niu, F., Lin, Z., and Liu, M.: Machine learning-based thermokarst landslide susceptibility modeling across the permafrost region on the Qinghai-Tibet Plateau, Landslides, 18, 2639–2649, https://doi.org/10.1007/s10346-021-01669-7, 2021.
Zhang, T.: Influence of the seasonal snow cover on the ground thermal regime: An overview, Rev. Geophys., 43, RG4002, https://doi.org/10.1029/2004RG000157, 2005.