Typhoon and flooding occurrences on Chongming Island, Changjiang Estuary, as revealed by a newly acquired sedimentary record
 Peipei Zhao
 Yang Yang
 Jianjun Jia
 Ning Zhao
 Wentong Zhang3
  Shu Gao
- 1State Key Laboratory for Estuarine and Coastal Research, School of Marine Sciences, East China Normal University, Shanghai, China
- 2School of Marine Science and Engineering, Nanjing Normal University, Nanjing, China
- 3Institute of Jiangsu Coastal Development, Yancheng Teachers University, Yancheng, China
- 4School of Geographic and Ocean Sciences, Nanjing University, Nanjing, China
Typhoon-induced storms surges and river flooding events represent two types of natural disasters that affect a wide range, occurring with high frequency and causing serious societal losses. Due to the limited duration of instrumental records, there is an inadequate understanding of the patterns and mechanisms underlying the variations in typhoons and floods. The interpretation of sedimentary records aptly compensates for these deficiencies in terms of the temporal scale, becoming a crucial medium for extending the temporal span of typhoon and flood records. Previous studies in this field have primarily focused on the identification of single types of extreme events. The Changjiang Estuary, particularly Chongming Island, is significantly affected by both typhoons and river floods, making it an excellent area for synchronous comparative studies of these two types of extreme events. Based on the analysis of a core sample, ZP02, collected from Chongming Island, in terms of chronological, sedimentological, and geochemical characteristics, specific tracing fingerprints for event deposits from typhoon and flood events are established. Sediments from typhoon events generally exhibit erosive contact surfaces, coarser grain sizes, and a tendency to become finer upwards, often featuring layers mixed with coarse sand and shell fragments. In contrast, flood event deposits vary in grain size, either coarser or finer, with abrupt contact surfaces compared to normal sediment layers, and are predominantly brownish-yellow in color. The fingerprint tracing results indicate that the typhoon event layers are characterized by high values in principal component 2 (PC2) of the elements, Zr/Fe and Sr/Fe ratios, with low values in principal component 1 (PC1) the elements and Ti/Ca ratio. Flood event deposits are marked by high values in PC1 and Ti/Ca ratio, low values in PC2 and Sr/Fe ratio, and an increase in Zr/Fe ratio in coarser flood layers but no significant change in finer layers. Based on these fingerprints, 19 layers of typhoon and the same number of flood events were identified in core ZP02, which correspond well with documentary records. The establishment of tracing fingerprints for typhoon and flood event deposits provides methodological support for the identification and interpretation of various extreme event deposits.
1 Introduction
Estuarine and coastal regions, as transitional zones between the sea and land, are characterized by significant land-sea interactions and constitute an integral part of the Earth system. These regions are also a focal area of the international geoscience research program ‘Future Earth Coasts’ (Tessler et al., 2015; Gao, 2018). Natural disasters represent one of the major environmental challenges currently facing coastal zones, with typhoon and flood disasters being the most widespread, frequent, and damaging globally (Webster et al., 2005; Kuleshov et al., 2014; Vousdoukas et al., 2018; Schröter et al., 2021). Within the context of global warming and accelerated sea-level rise, extreme events such as storms and floods are exhibiting trends of changing frequency and intensity (Emanuel, 2005; Guan et al., 2018; Bhatia et al., 2019; Gao et al., 2019; Murakami & Wang, 2022), with typhoons over the West Pacific region showing a tendency to move toward mid and high latitudes (Yang et al., 2020a; Xu et al., 2022). According to the IPCC Sixth Assessment Report, it is projected that by the year 2100 global sea level will rise by 0.38–0.77 m, compared to the period of 1995-2014 (Fox-Kemper et al., 2021). Further, the relative sea level rise rate in the Yangtze River estuary is much higher than the global average, reaching up to 10 mm/yr (Yang et al., 2020b). Concurrently, the global concentration of population and wealth in coastal areas may exacerbate the losses caused by typhoon and flood inundations, with the potential for damages from events of the same intensity to be several times greater than before (Meiler et al., 2023; Rentschler et al., 2023). Additionally, in the context of global climate change, the recurrence intervals of extreme events in regions such as the Northwest Pacific and Southeast Asia are expected to decrease (Donnelly & Woodruff, 2007; Hirabayashi et al., 2013). Considering these factors, coastal areas are likely to face increased risks related to typhoon and flood impacts in the future (Wu et al., 2021; Shan et al., 2022; Sun et al., 2022), necessitating adjustments to coastal protection engineering standards. However, due to the temporal limitations of instrumental data, the design of coastal protection works can only provide frequency-intensity calculations based on the centennial scale supported by instrumental data, which is inadequate for future needs. There is an urgent requirement to extend the temporal series of extreme event data. Sediment records, which contain rich environmental information, aptly compensate for these temporal limitations and become ideal carriers for reconstructing long-term series of extreme events like typhoons and floods.
Chongming Island, located in the Changjiang Estuary, is the world’s largest riverine sedimentary island (Obodoefuna et al., 2020; Zhang et al., 2020). Characterized by its low ground surface elevation, the island is particularly vulnerable to various extreme events such as typhoons and floods (Zhou et al., 2021; Song et al., 2023). Additionally, Chongming Island receives abundant sediment supply, which causes rapid accumulation, making it an ideal location for studying extreme events. This island is currently undergoing a major construction program; it also has been experiencing accelerated tourism development and has a dense population. Its coastline is home to significant ports and ferry terminals, increasingly intensifying the pressure on coastal protection (Shan et al., 2022). Therefore, in the context of climate warming, rising sea levels, and intense human activities, there is an urgent need to examine the sedimentary archive of Chongming Island for signatures of extreme flooding events, such as those associated with typhoons and river floods. This research contributes to the effective identification of typhoon and flood deposits and to reveal the century-scale evolutionary patterns of typhoon and flood activities.
The processes associated with extreme flooding events that affect tidal flat environments differ significantly from those under normal weather conditions, resulting in distinct sedimentary records, including layering, color, texture, and physicochemical properties (Fan et al., 2006; Morton et al., 2007; Zhou et al., 2021; Szcześniak et al., 2023). Extensive research has been conducted on sedimentation resulting from typhoons and river floods (e.g., Woodruff et al., 2009; Zhao et al., 2016; Yang et al., 2020a; Zhou et al., 2021). However, studies on the coupled sedimentation processes of various extreme events, including both typhoons and river floods, impacting estuarine sand islands like Chongming Island, are relatively scarce. Additionally, criteria to trace fingerprints of such events in sedimentary sequences are not yet fully developed. Hence, the techniques for extracting long-term records of typhoon and flood activities from sedimentary archives, and the closely related challenge of distinguishing between typhoon and river flood sedimentary record, are pressing issues that need to be addressed. In this respect the following working hypothesis is relevant: riverine floods and typhoon-induced storm surges leave distinct imprints in stratigraphic records, and by tracing the fingerprints of sediment provenance riverine flood and typhoon-induced storm deposits can be differentiated. Hence, in the present contribution, we traced event-layers in sediments to retrieve geological information indicative of high energy inundations triggered by flood and typhoon events. Such an effort may provide additional sources of information on the typhoon and flood pattern changes in response to climate and sea-level changes.
2 The study area
Chongming Island is located at the Changjiang Estuary and is a typical estuarine sand island. It faces the river on three sides, with the eastern part adjacent to the East China Sea. It is approximately positioned between 121°09′30″E to 121°54′00″E and 31°27′00″N to 31°51′15″N. Extending around 80 km in length and varying between 13 to 18 km in width, the island covers an area of about 1.35×10³ km2 and divides the Changjiang Estuary into its southern and northern branches (Wu et al., 2019; Luo et al., 2022) (Figure 1). In estuarine areas, the reduction in river flow velocity, combined with the influence of river water intrusion, prompts the rapid deposition of sediment, leading to the formation of estuarine sand bars. Estuarine sand bars continually receive sediment overflow, causing them to gradually aggrade and expand, eventually emerging above the water surface as estuarine sand islands (Yan and Xu, 1987; Bao and Gao, 2021). Chongming Island extends in a northwest-southeast direction, featuring a flat terrain with elevations typically ranging from 3.47 to 5.07 m (Wu et al., 2019); it should be noted that the elevation data are expressed in terms of Local Datum, which is some 1.66 m below the mean sea level (Gao, 2022). The island is higher in the northwest and central parts, slightly lower in the southwest and east. The predominant sediments consist of sand, silt, and clayey silt (Yan and Xu, 1987).
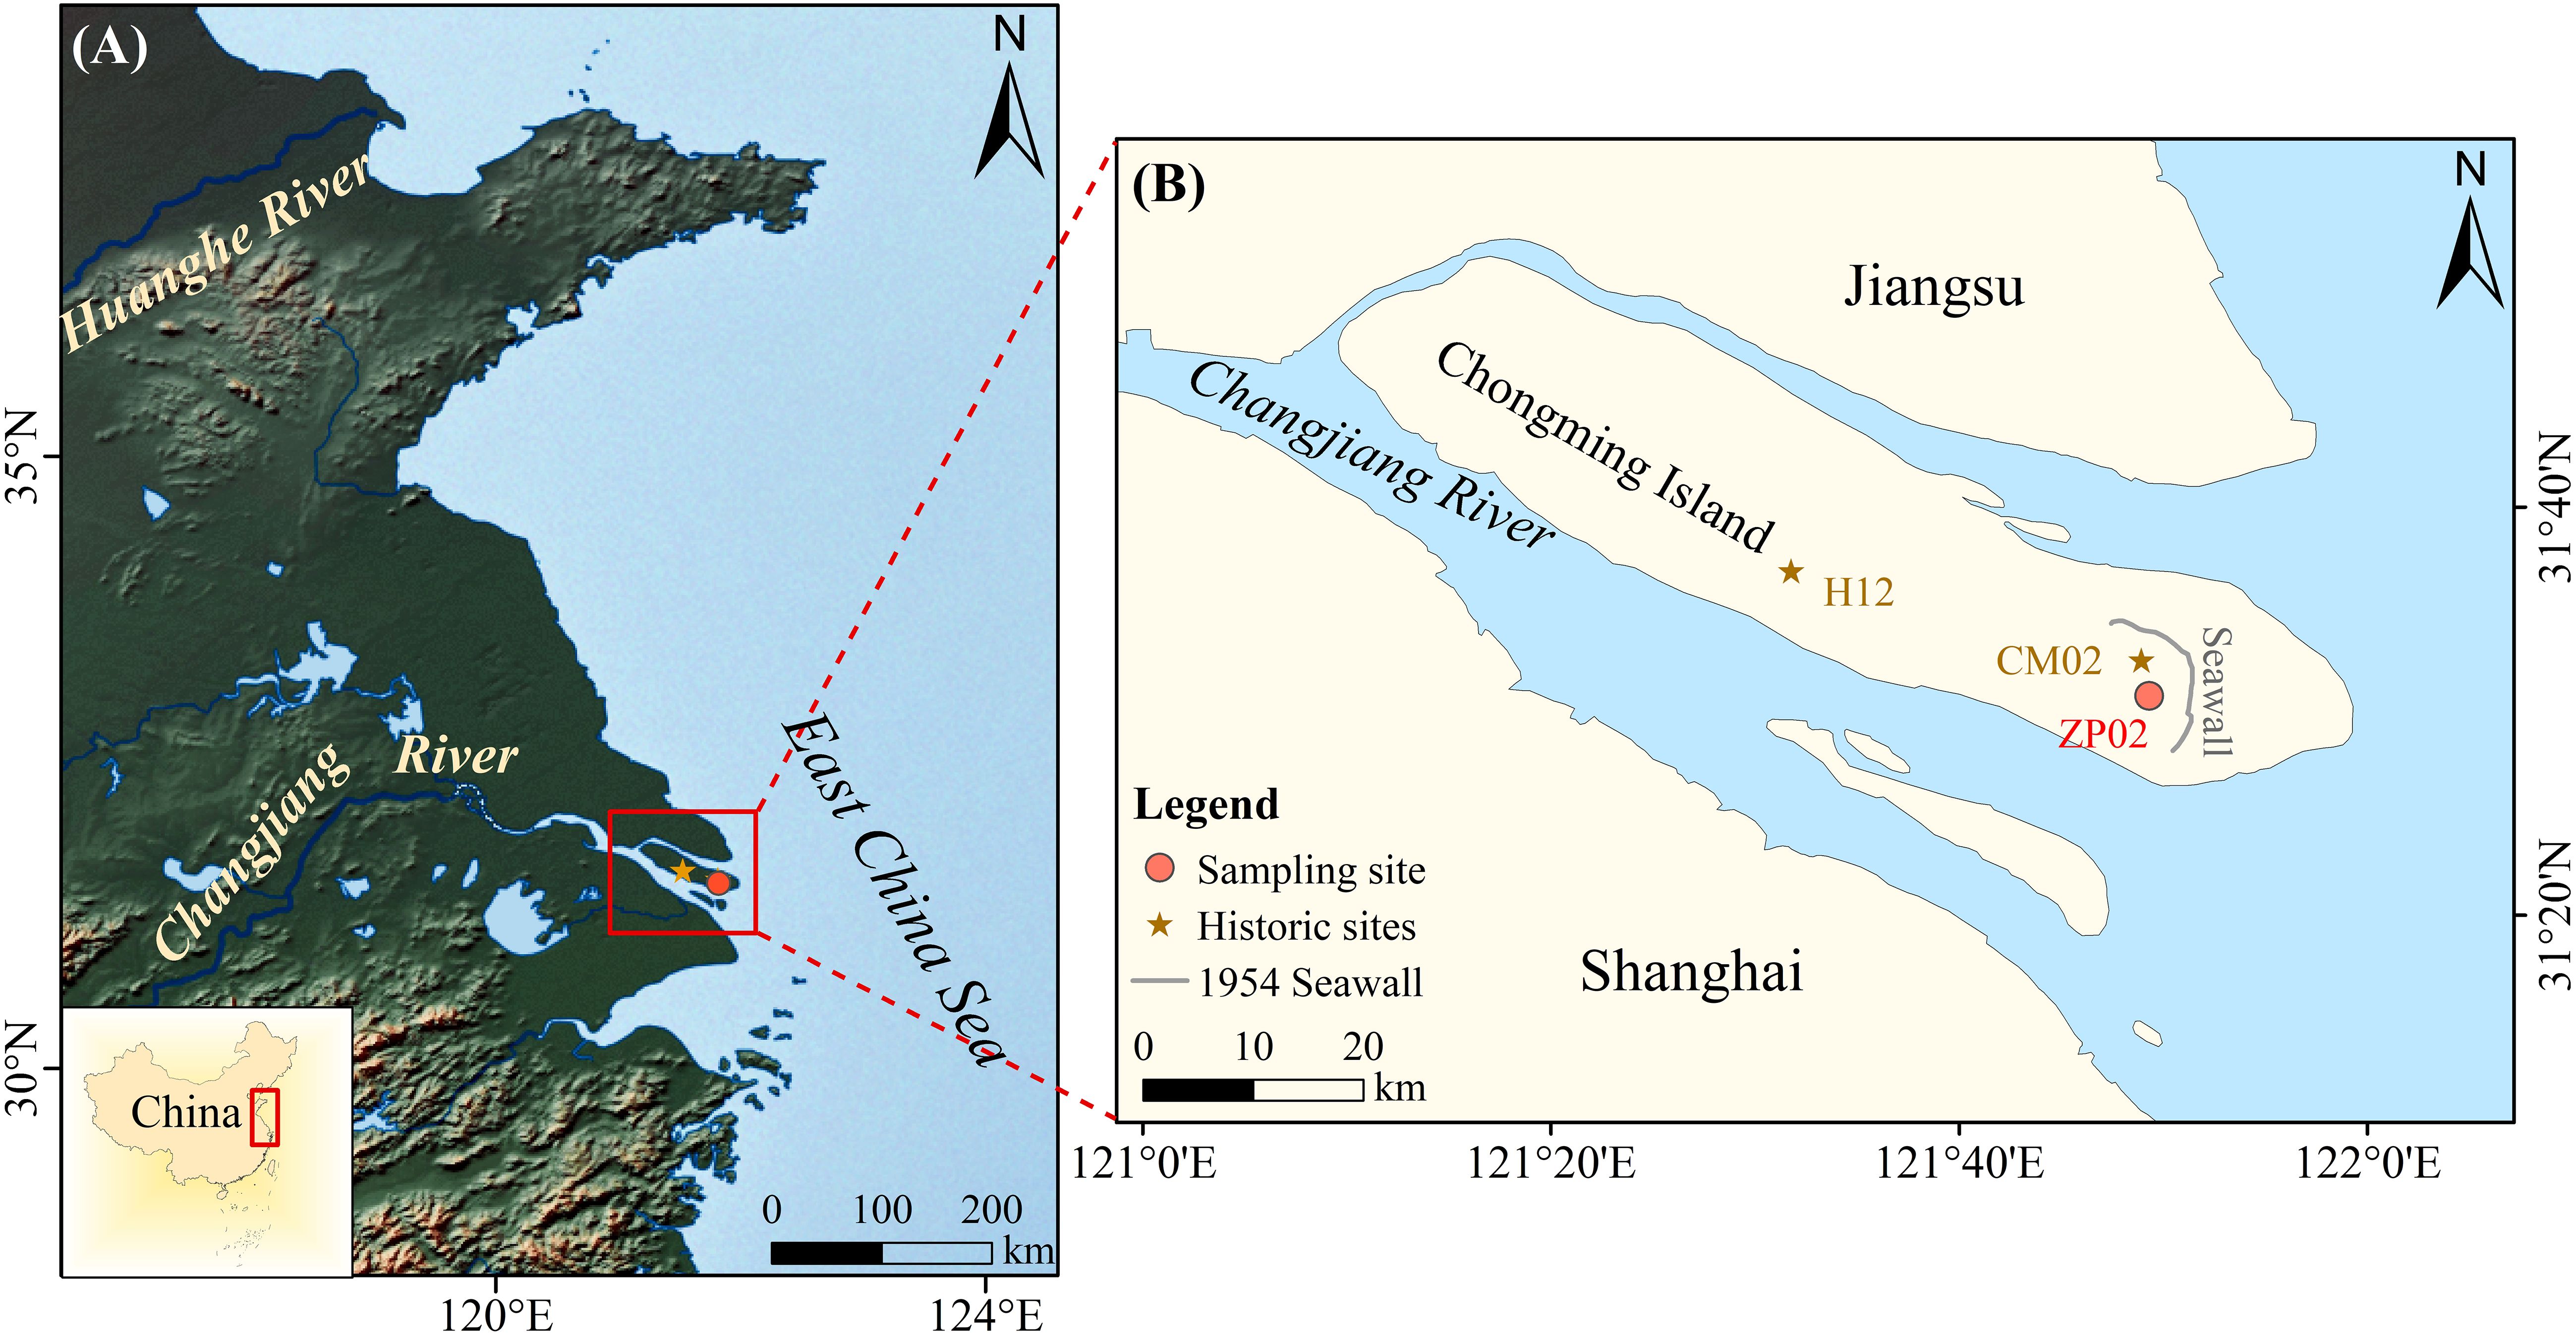
Figure 1 Geographical location of Chongming Island at the Changjiang estuary (A) and the position of core ZP02 (B). “1954 seawall” represents the seawall completed in 1954 (Chen, 1988). H12 as cited in Duan et al., 2020. CM02 as cited Chen et al., 2021.
Due to measures such as soil and water conservation and dam construction along the Yangtze River, the suspended sediment flux in the Yangtze River has significantly decreased (Chu et al., 2009; Nian et al., 2022; Wang et al., 2022). Hydrological statistical data from 1953 to 2020 indicate an average annual runoff of 9.0×10² km3 a-1 entering the sea from the Yangtze River (Ministry of water resources, Changjiang Water Resources Commission, 2021). The multi-year average sediment flux into the sea was about 5.0×10⁸ t a-1 before the dam construction (1953-1968) and approximately 1.3×10⁸ t a-1 thereafter (2003-2021) (Ministry of water resources, Changjiang Water Resources Commission, 2021; Yang et al., 2021). The Changjiang estuary, influenced by river runoff and tidal forces, is a typical mesotidal estuary (Davies, 1964; Li et al., 2019). It exhibits an irregular semidiurnal tide, with a multi-year average tidal range of 2.66 m and a mean tidal range on spring tides of about 4.62 m (Li and Wang, 1998; Li et al., 2019). The predominant wave types in the Changjiang estuary are wind waves and mixed waves, with wind waves being the primary driver and swell being secondary. The significant wave height can reach several meters during typhoon events (Yang et al., 2000; Huang et al., 2022). Historically, multiple embankments have been constructed on Chongming Island for the purposes of reclamation and flood prevention, with sedimentary records between these seawalls representing different historical periods (Chen, 1988).
3 Materials and methods
This study examines the sedimentary sequences in a core labeled ZP02, taken from Chongming Island. The core has a length of 820 cm and a diameter of 9 cm (Figure 1). At the core site, the ground elevation is around 4.5 m (Local Datum); since the Local Datum is some 1.66 m below the mean sea level (Gao, 2022), the ground elevation here is about 2.84 m above the mean sea level. Taking into account the mean tidal range, i.e., 4.62 m (Li and Wang, 1998; Li et al., 2019) and the definition of intertidal zone (Gao, 2018), the top 0.53 m of the core belongs to supratidal zone, the section of 0.53–5.15 m represents intertidal zone, and the section below 5.15 m is subtidal zone.
The core recovery rate was 92.7%, slightly less than the planned sampling length, possibly due to compression within the borehole. The missing section was proportionally extrapolated to the planned sampling depths. After collection, the core sections were transported to the laboratory, where they were split longitudinally into two halves using a core-cutting machine for sedimentary characteristics description. One half of core was sealed, refrigerated for preservation, and transported to a darkroom for selecting layers for dating. Samples were excavated and stored in multi-layered opaque black bags and tin foil layers for Optically Stimulated Luminescence (OSL) experiments. The surface of the other half of the core was smoothed for photography and X-ray fluorescence (XRF) scanning. Subsequent sampling was conducted at 1 cm intervals, with samples placed in numbered bags for grain size analysis.
3.1 OSL dating
The OSL dating technique was first introduced by Huntley et al. (1985) and has a measurement range extending from a few hundred to several hundred thousand years (Ballarini et al., 2003; Nian et al., 2021). In recent years, it has been widely applied in studying the chronology of sedimentary strata in coastal zones (Nian et al., 2018, 2019).
Four samples of core ZP02 were collected for OSL dating. The split core was examined to eliminate potentially contaminated surface samples under dim red light. Subsequently, a sampling spoon was employed to scrape samples multiple times from both the surface and the region near the contact of the core with the PVC tube, yielding approximately 30 g. These samples were used for water contents (weight of water/weight of dry sediment.), as well as U, Th, and K testing. For the central, entirely unexposed section, approximately 100 g of sediment were scraped. These samples were sieved using the wet sieving method to separate components with grain size<45 μm, 45–63 μm, and >63 μm. This study focused on the 45–63 μm quartz fraction, following preparations (30% H2O2, 10% HCl, 40% HF). The purity of the separated quartz was examined through infrared–stimulated luminescence measurements to ensure there was no contamination of feldspar in the samples (Duller, 2003). Equivalent dose testing was conducted using the Lexsyg research model of OSL reader produced by Freiberg Instruments.
The Bayesian model in the rBacon program was utilized for calculating OSL dating results, which is a stepwise autoregressive gamma procedure based on the Bpeat model (Blaauw and Christen, 2011). We ultimately obtained the best age-depth curves with a 95% confidence interval. All OSL ages are reported relative to AD 2018. Specific preprocessing and experimental procedures can be found in Lai et al. (2010) and Cunha et al. (2010), and dating calculations were undertaken as in Blaauw and Christen (2011).
3.2 Grain size analysis
Grain size characteristics of detritic sediments are closely related to sedimentary environments, and their frequency distribution is associated with provenance, transport and accumulation processes, facilitating the identification of sedimentary environments (Gao and Collins, 1998). Grain size parameters include mean grain size (Mz), sorting coefficient (δ), skewness (Sk), and kurtosis (Ku). Core samples taken at 1 cm intervals were analyzed using the Mastersizer 2000 laser particle size analyzer, manufactured by Malvern Instruments, UK, with a measurement range of 0.02 to 2000 μm. Initially, an appropriate amount of sample was placed in a small beaker, to which a 0.5 mol/L solution of sodium hexametaphosphate was added, and left to stand for 24 hours to disperse the sediment particles. Subsequently, the sample was loaded into the instrument for grain size analysis. The measurement results were exported at 1/4φ intervals, and the method of moments was used to extract the grain size parameters using the McManus formula (1988) (Equations 1–4).
Where is the mean grain size (which can be also written as Mz), is the sorting coefficient, is skewness, is the kurtosis. is the mid-point of each class interval and is the frequency in weight percent, n represents the number of grain size groups in the sample.
Mz is reported in microns (μm) or phi (φ) units, where it is appropriate, while sorting coefficient is in phi (φ) units. Phi (φ) is a dimensionless expression for statistical grain size parameters (McManus, 1963) (Equation 5).
Where d is the grain diameter in millimeters, is the diameter of 1 mm grain.
The sand-silt-clay triangular diagram proposed by Folk et al. (1970) was employed for sediment classification.
3.3 Core scanning
Core ZP02 was scanned for geochemical elemental analysis using an X-Ray Fluorescence (XRF) scanner produced by the Dutch company Avvatech. This instrument offers advantages over more traditional methods, such as non-destructive analyses, rapid measurement, and high resolution, and it has been applied in fields like sedimentology and paleoclimatology (Swindles et al., 2018; Croudace et al., 2019; Seki et al., 2019). Its applications include paleoclimate reconstruction; identification of event deposits such as river floods and typhoons; tracing of marine and terrestrial sediments; as well as delineation of sedimentary strata (Huang et al., 2019; Wang et al., 2019; Xue et al., 2021).
For core geochemical analysis, the first step involved smoothening the surface of the core sections, followed by covering with Ultralene film. This reduces the impact of surface roughness and prevents contamination of the instrument’s probe by the sample. The scanning interval was set at 5 mm. The target X-ray tube used was a Rh tube, with testing voltages of 10 kV, 30 kV, and 50 kV, and a current of 500 μA. This enabled the acquisition of relative intensity values for 29 elements including Al, Si, S, Cl, K, Ca, Ti, Zr, Rb, Fe, Br, Ag, and Ba. The results obtained from XRF are relative values, and the quality of the data is influenced by factors such as grain size and water content variations, core surface imperfections, presence of organic matter, and water pooling on the sample surface (Croudace and Rothwell, 2015). To mitigate these influences, element-to-element ratios were used. Fe is usually used as a reference element (Grygar and Popelka, 2016; Zhou et al., 2021). After elemental scanning of the core, the probe was adjusted and a U-shaped non-magnetic base was mounted to use the magnetometer attached to the instrument, obtaining the magnetic susceptibility per unit volume at a scanning interval of 5 mm. The instrument is equipped with a high-resolution camera, which was used to obtain high-definition images of the core. Subsequently, principal component analysis (PCA) was conducted on the XRF data to identify major sediment end-members and detect correlations between elements (Rapuc et al., 2019).
3.4 The documentary record: data collection
Documentary records have been extensively utilized in the reconstruction of paleoclimatic and hydrological events. Various terms in these documents represent typhoon and flood events, such as ‘water disaster’, ‘dike breach’ and ‘great flood’. Shanghai, as a major economic and cultural center in China, is a region where scientific and technical observations of catastrophic events were made early on, making use of its rich documentary archive. ‘The History of Natural Disasters in Shanghai’ (Liu et al., 2010) chronicles storm surges, floods, strong winds, and other natural disasters from AD 751 to 1949, including their occurrence times, locations, and damage inflicted. ‘Encyclopedia of Meteorological Disasters in China, Shanghai Volume’ (Wen and Xu, 2006) documents typhoons from AD 251 to 2000 and floods from AD 371 to 2000. These two compilations were used as our documentary database.
3.5 Identification of event layers
The characteristics of sedimentary facies are determined by sediment sources, sedimentary processes and type of sedimentary environment (Reading, 1986). However, the permanent sedimentation regime of any depositional environment can be disturbed during high-energy events. These events cause brief overland floods with high flow velocities and are reflected in the sediment by marked contrasts in grain size and composition, reflecting both the origin of the displaced sediment and the hydrodynamic conditions of the sedimentation, which differ from the permanent regime (Morton et al., 2007; Chagué-Goff et al., 2011; Peters and Jaffe, 2010). In the context of a tidal flat, characterized by fine-grained sediments, the occurrence of coarser sediment laminae interbedded with fine grained sediment in the core may be indicative of an extreme event. This statement holds whether the coarsening is related to a change in sediment source or to selective winnowing of finer particles and the formation of a coarse lag deposit.
The procedure of identifying the peaks of the coarse fraction is as follows. Extreme outliers in the coarse tail of the distribution, identified using the quartile method and visualized in box plots, are first removed from the data set. The mean (X̄) and standard deviation (σ) are then recalculated excluding these outliers (Ercolani et al., 2015), and finally, take X̄+σ and X̄−σ (unit: μm) as the background thresholds for coarse and fine grains, respectively. Although tidal flat sediments show a general tendency for mean grain size to decrease from offshore to onshore, in many cases the flat hosts several sub-environments that complicate this simple spatial pattern (Fan et al., 2006; Yang et al., 2022a). Therefore, the calculation of background parameters was performed in different sections of core ZP02, in agreement with the changing environmental conditions interpreted from the sedimentary column.
4 Results
4.1 Lithostratigraphic characteristics
The color, composition and structure vary along ZP02 core length. The colors are diverse, mainly gray-brown, yellow-brown, and bluish-gray. The texture shows significant variations, including clay, sandy silt, and silt. Based on texture and lithological characteristics, it can be roughly divided into three units, as described below (all depths mentioned in the study refer to depths below the ground surface):
● 70–0 cm: Gray-brown, yellow-brown silt, low moisture content, low in moisture, stiff and with no apparent bedding. At 22 cm, modern rice straws are present, and rust stains are observed between 40 and 70 cm, indicating noticeable anthropogenic disturbance. Data for this core section will not be presented in this study.
● 263–70 cm: Sticky yellow-brown, gray-brown sediment predominantly composed of silt, exhibiting low moisture content. This unit features sandy-silty interlayers and lenticular bedding. Muscovite is present, rust stains occur at 147–148 cm, and shell debris is found at 215 cm.
● 820–263 cm: Grayish-blue, yellow-brown, and gray-brown, silty sand, with high moisture content and sandy-silty interlayers in multiple locations. There is a mud layer appears at 291–301 cm and a finer sand layer in the range of 675–686 cm, with a gray-brown color, showing a sharp contact with the sediments above and below. Abundant shell debris and coarse sand are present at 282 cm, 710–750 cm, and 801–803 cm, and muscovite is observed in multiple layers.
4.2 Chronology
The rBacon program was used to calculate OSL ages using samples at 167 cm, 474 cm, 680 cm, and 752 cm; the ages obtained were 0.243 ± 0.01 kyr BP, 0.305 ± 0.02 kyr BP, 0.341 ± 0.02 kyr BP, and 0.405 ± 0.03 kyr BP, respectively (Supplementary Table 1), with no age inversions. Results include the 95% confidence interval, median and mean ages for each depth (Figure 2). The most recent OSL age predates 1954, the date of construction of the seawall closer to sea at the sampling site (Figure 1). Additionally, the dating results are consistent with those found in Chen et al. (2021) and Duan et al. (2020) study on Chongming Island, which reinforces the credibility of the OSL dating results presented in this paper. We choose the minimum age as the value for the dating framework.
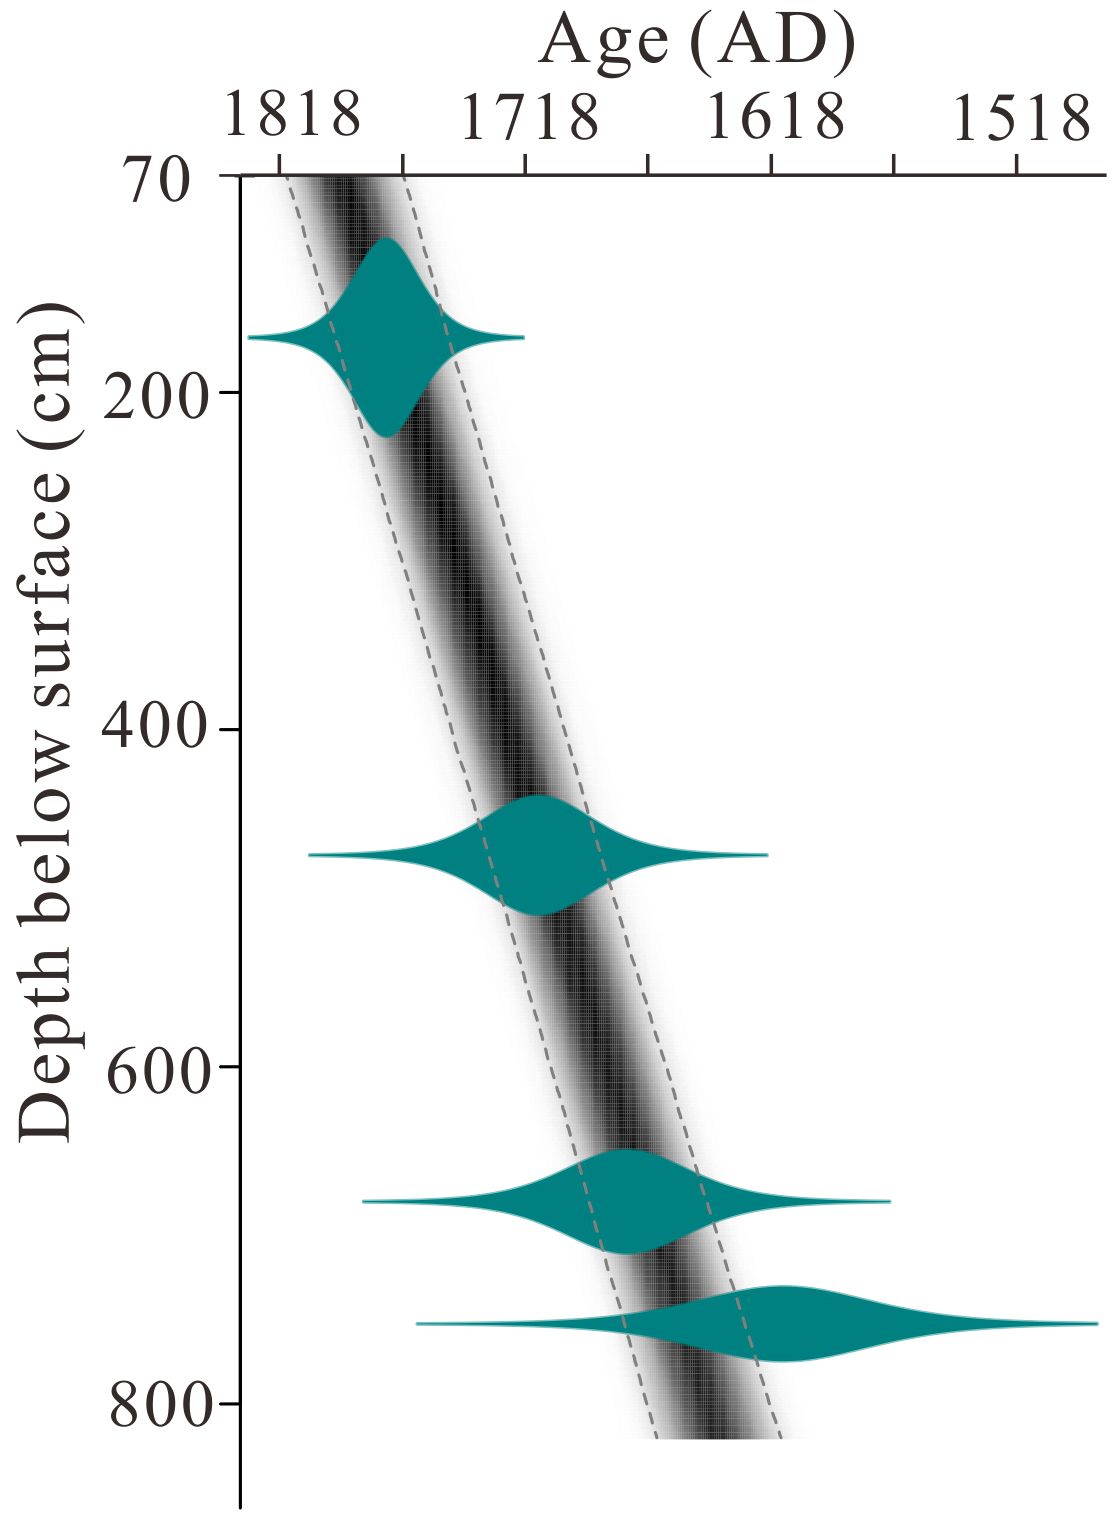
Figure 2 Age-depth model for the sediment sequence of core ZP02. The gray dashed lines represent the 95% confidence interval. The blue symbols indicate OSL test points on the core.
4.3 Grain size characteristics
The sediment characteristics of the core (Figure 3), are predominantly silt and sand, with minor amounts of clay. Overall, and over time, the sand fraction in the sediment first increases and then decreases; the silt fraction initially decreases and subsequently increases; the clay fraction shows a decreasing trend. Core ZP02 sediment (Figure 3) is mainly composed of sand (0.4%–90%), followed by silt (7.2%–86%) and, least, clay (2.0%–24%). There is a variation in sediment types, transitioning from silt to silty sand, and then to sandy silt again. The vertical variations in their characteristics are depicted in Figure 3 and allowed to divide the core into three sediment units.
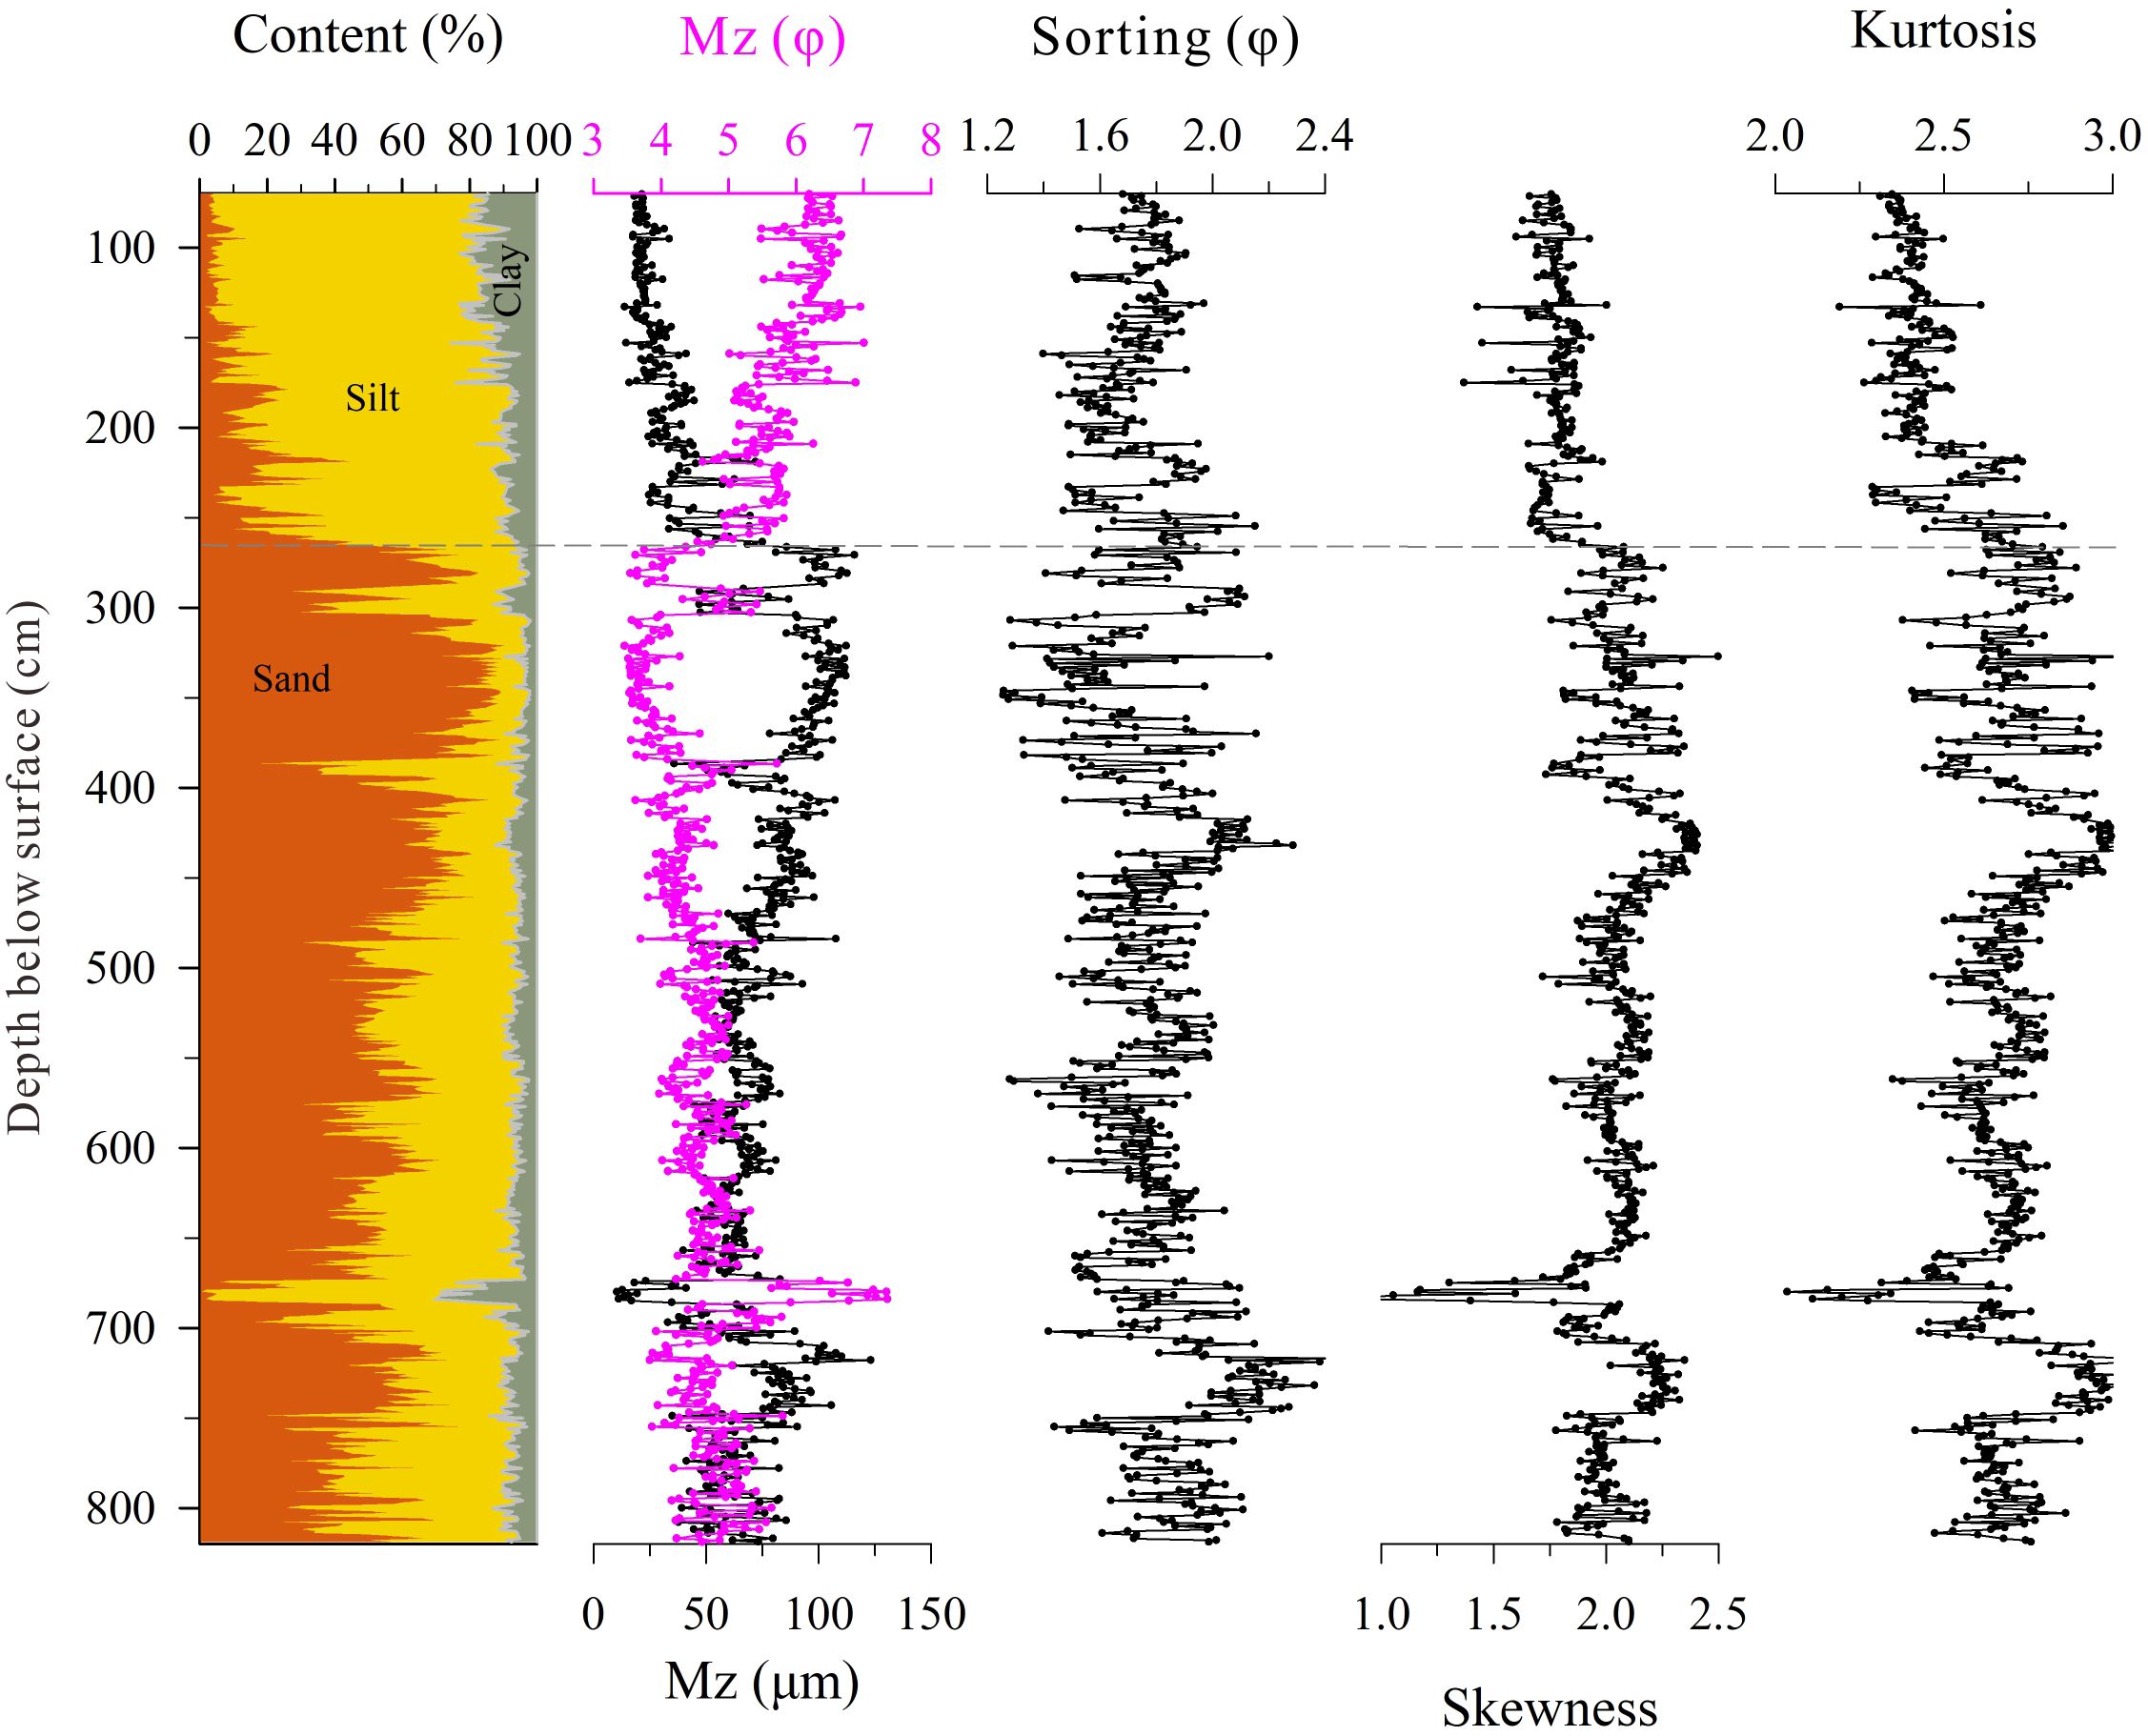
Figure 3 Vertical distribution of sediment grain size and parameters in core ZP02. The gray dashed line represents the depth boundaries of different units.
Unit I (70–0 cm) varies less in grain size parameters than the underlying units, with mean grain size in the range of 6.1φ–7.1φ (12.1–27.0 μm), sorting coefficient value between 1.68φ and 1.93φ, skewness value in the range of 2.40–1.79, and kurtosis value between 2.14 and 2.54.
Unit II (263–70 cm) shows larger variation in the grain size parameters, with mean grain size in the range of 4.6φ–7.0φ (13.8–72.0 μm), sorting coefficient in the range of 1.40φ–2.15φ, skewness in the range of 1.37–2.0, and kurtosis in the range of 2.19–2.85.
Unit III (820–263 cm) shows very large changes in the grain size parameters, with mean grain size in the range of 3.5φ–7.3φ (10.4–123.1 μm), sorting coefficient in the range of 1.26φ–2.42φ, skewness in the range of 0.91–2.50, and kurtosis in the range of 2.04–3.12.
4.4 Geochemistry and magnetic susceptibility
Marine and riverine sediments contain a wealth of information on environmental changes, such as climate variations, regional events, and human activities (Croudace and Rothwell, 2015; Yan et al., 2020). Among the 29 elements obtained through XRF scanning, the elements that are closely associated with marine (e.g., Zr, Sr, Ca and Cl) and terrestrial (e.g., Al, Si, K, Ti, Mn, Fe, Zn, Rb and Ba) inputs were selected for further analysis (Haug et al., 2001; Grygar and Popelka, 2016; Tian et al., 2019; Goslin et al., 2022). The average of ratios Al/Fe, Si/Fe, Cl/Fe, K/Fe, Ca/Fe, Ti/Fe, Sr/Fe, Zr/Fe, Rb/Fe, Ba/Fe, Zn/Fe in the whole core are 0.08, 1.06, 0.16, 0.24, 0.80, 0.13, 0.22, 0.30, 0.10, 0.10, 0.04, respectively. The vertical variations in their concentrations are depicted in Figure 4 and support division of the core into two sections.
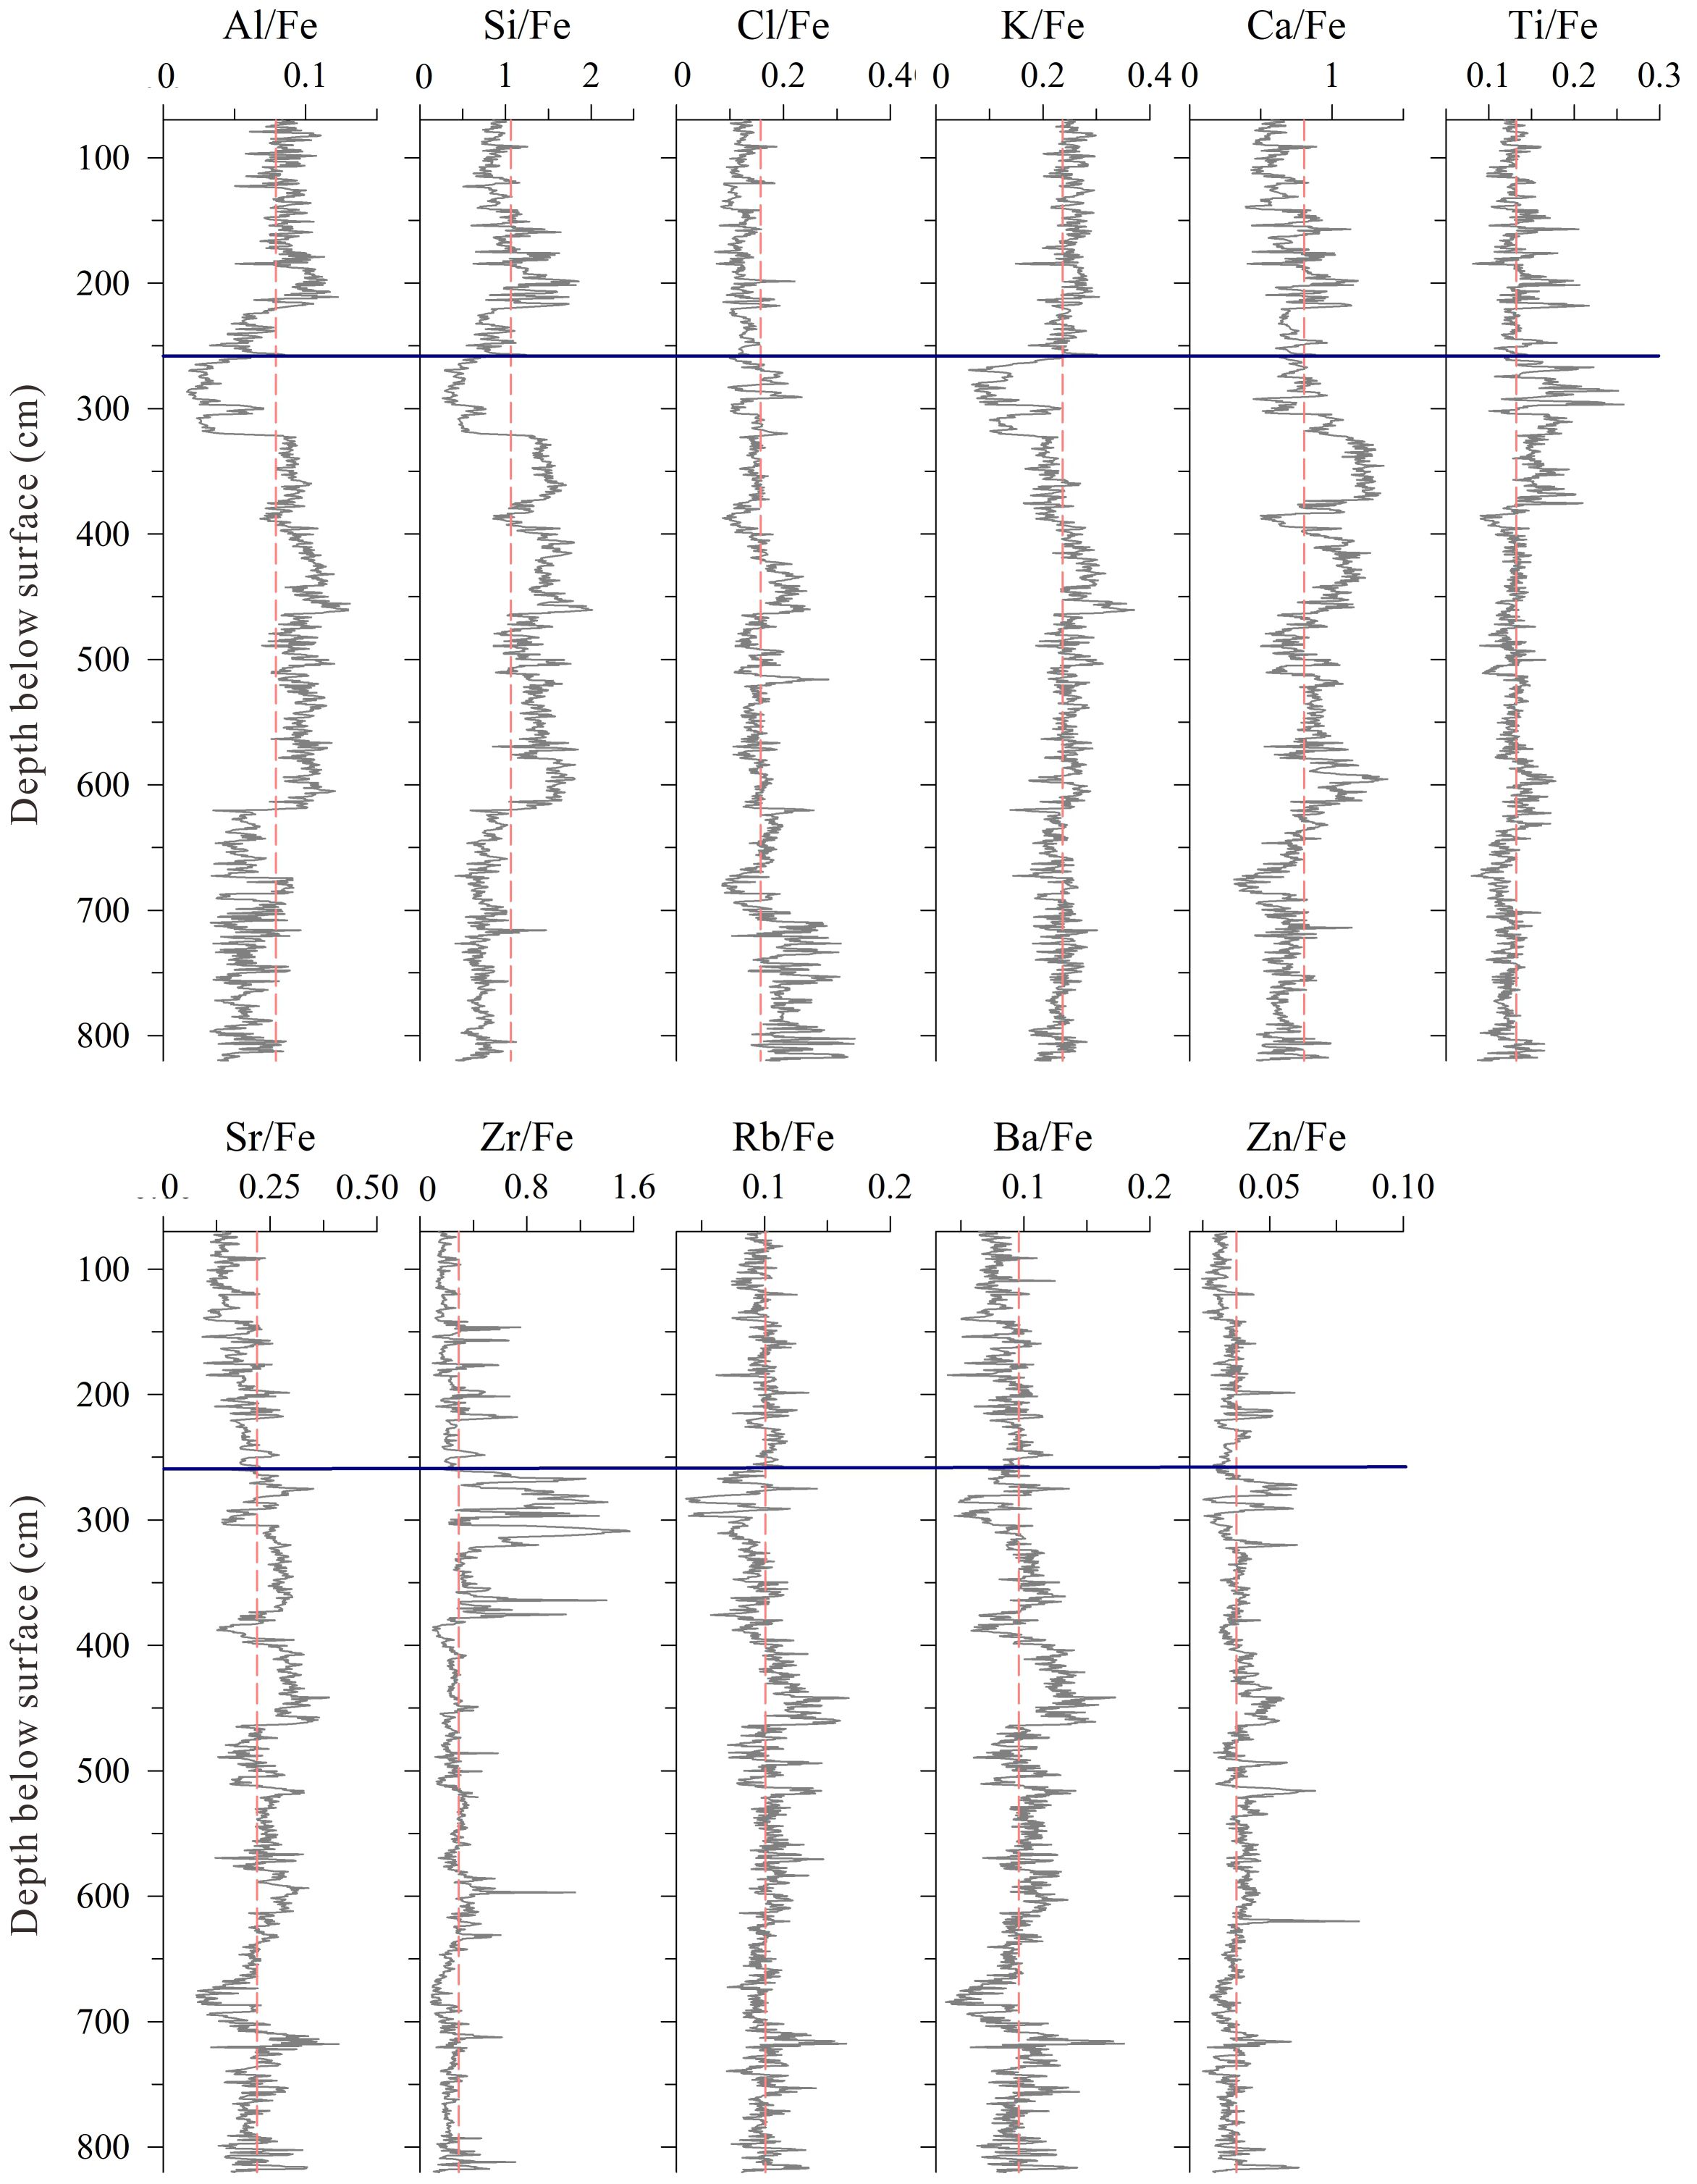
Figure 4 Variation of elemental ratios in Core ZP02. The red dashed line represents the average value. The blue solid line represents the depth boundaries of different units.
From 263 to 70 cm, the Al/Fe and Si/Fe ratios are 0.03–0.12 and 0.50–1.86, with mean values of 0.08 and 1.0, respectively, showing an initial increase followed by a decrease upcore. The Cl/Fe, K/Fe, Ti/Fe, Zr/Fe, Rb/Fe and Zn/Fe ratios vary within the ranges of 0.07–0.22, 0.15–0.31, 0.08–0.22, 0.09–0.75, 0.06–0.13 and 0.02–0.06, respectively. The Ca/Fe, Sr/Fe and Ba/Fe ratios exhibit decreasing trends upcore, within the ranges of 0.39–1.18, 0.09–0.29 and 0.04–0.12, respectively.
From 820 to 263 cm, the Al/Fe and Si/Fe ratios are 0.02–0.13 and 0.26–2.01, with mean values of 0.08 and 1.08, respectively. The Cl/Fe ratio ranges from 0.09 to 0.33, with a mean value of 0.17, and the element ratio decreases upcore. The K/Fe ratio varies between 440–820 cm and then decreases. The Ca/Fe and Sr/Fe ratios generally upwards, in the range of 0.31–1.39 and 0.08–0.41, respectively. The Ti/Fe ratio ranges from 0.08 to 0.26, with a mean value of 0.03, and the element ratio increases significantly in the 263–380 cm section. The Zr/Fe ratio ranges from 0.08 to 1.57, with a mean value of 0.31, and the element ratio initially shows pronounced variations, followed by an increase upcore. The Rb/Fe ratio ranges from 0.04 to 0.17, with a mean value of 0.11, and the ratio initially shows variations, and then decreases upcore. The Ba/Fe ratio ranges from 0.04 to 0.18, with a mean value of 0.1, and the element ratio varies significantly. The Zn/Fe ratio ranged from 0.03 to 0.08, with a mean value of 0.04.
Principal Component Analysis (PCA) of the aforementioned elements was used to clarify the relationships among the elements and the geochemical distribution within the sedimentary sequence (Figure 5). The plot diagram in Figure 5 shows that the analyzed elements cluster in two major groups. Group I (Zr, Sr, Ca) is positively correlated with PC2, showing high loadings (0.4 to 0.6), and we have interpreted this group as of marine origin. Group II (Al, Si, K, Ti, Mn, Fe, Zn, Rb, Ba) is positively correlated with PC1, also showing high loadings, and we classified this group as of terrigenous origin.
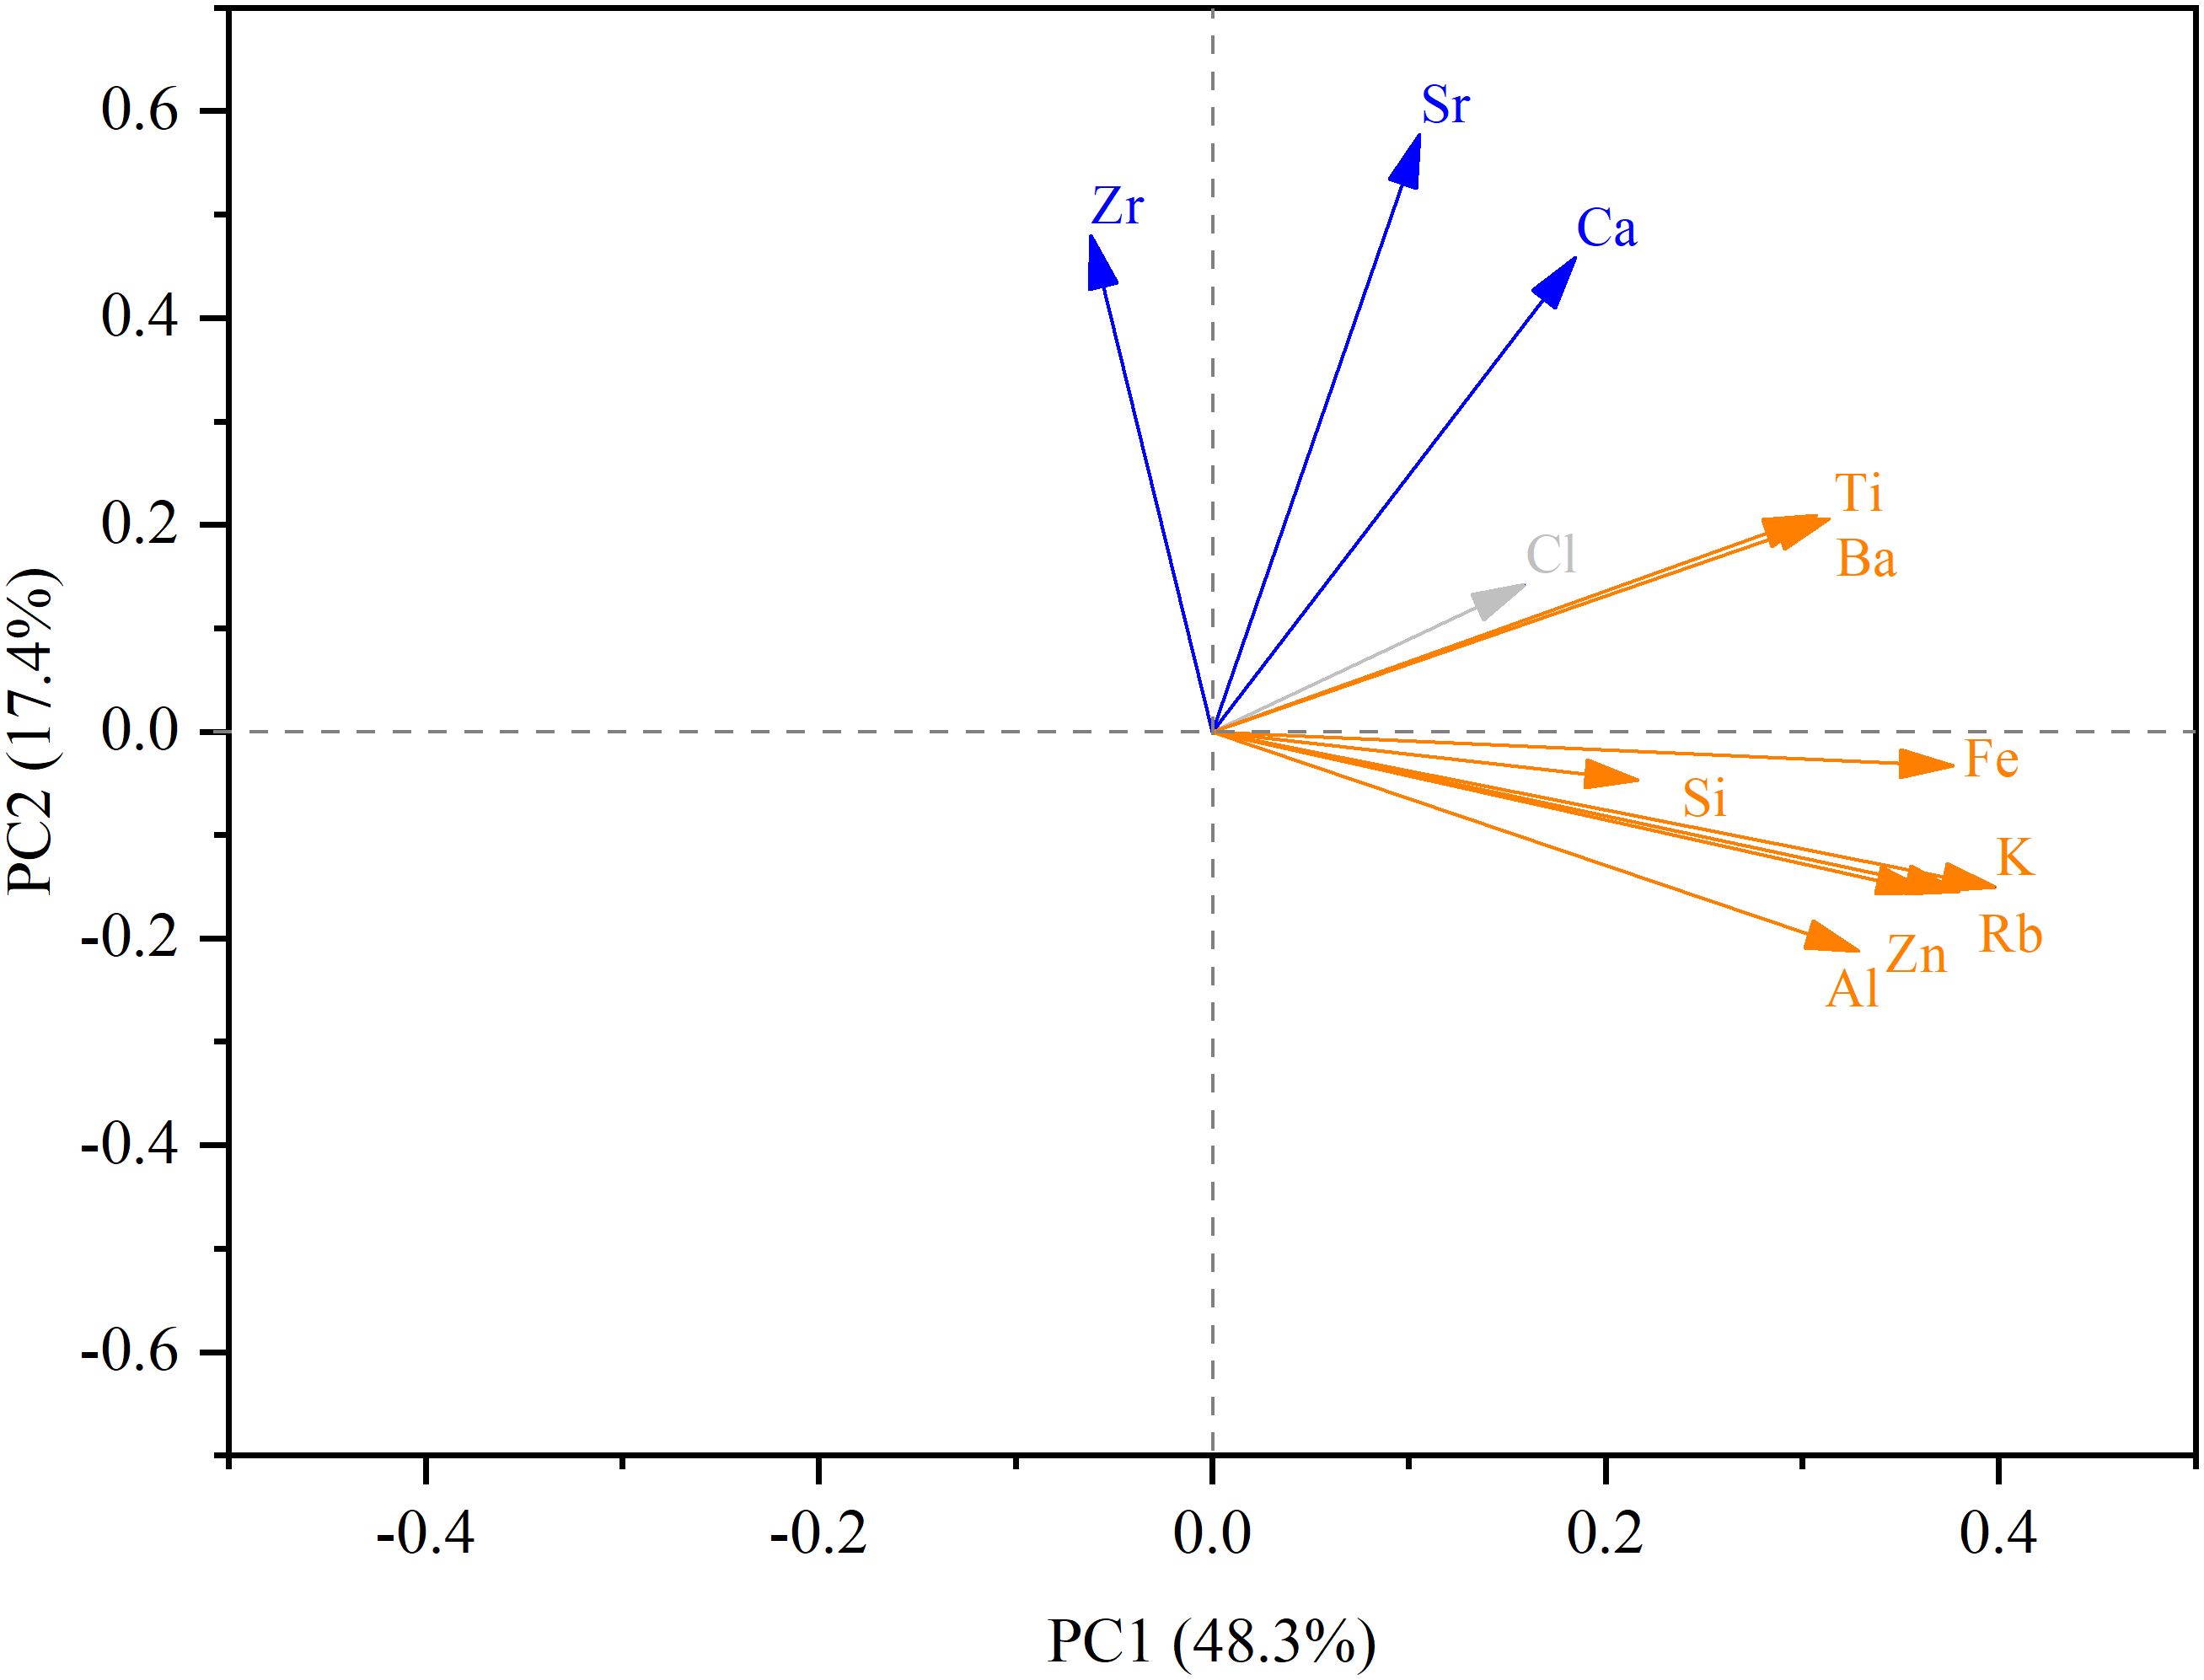
Figure 5 Rotated loading plot of principal elements in core ZP02. Orange arrows indicate elements with high PC1 values, and blue ones indicates elements with high PC2 values.
The plot of magnetic susceptibility with depth (Figure 6) is compatible with the division of ZP02 core in the two major units, below 70 cm, as indicated above. From 70 to 263 cm, the magnetic susceptibility ranges from 22.2 to 214.8 SI, with a mean value of 50.3 SI, showing small variations in the magnitude over this depth range. From 263 to 820 cm, the magnetic susceptibility ranges from 22 to 938.5 SI, with a mean value of 73.1 SI, and it increases significantly in the 263–300 cm section, with a mean value of 308.7 SI.
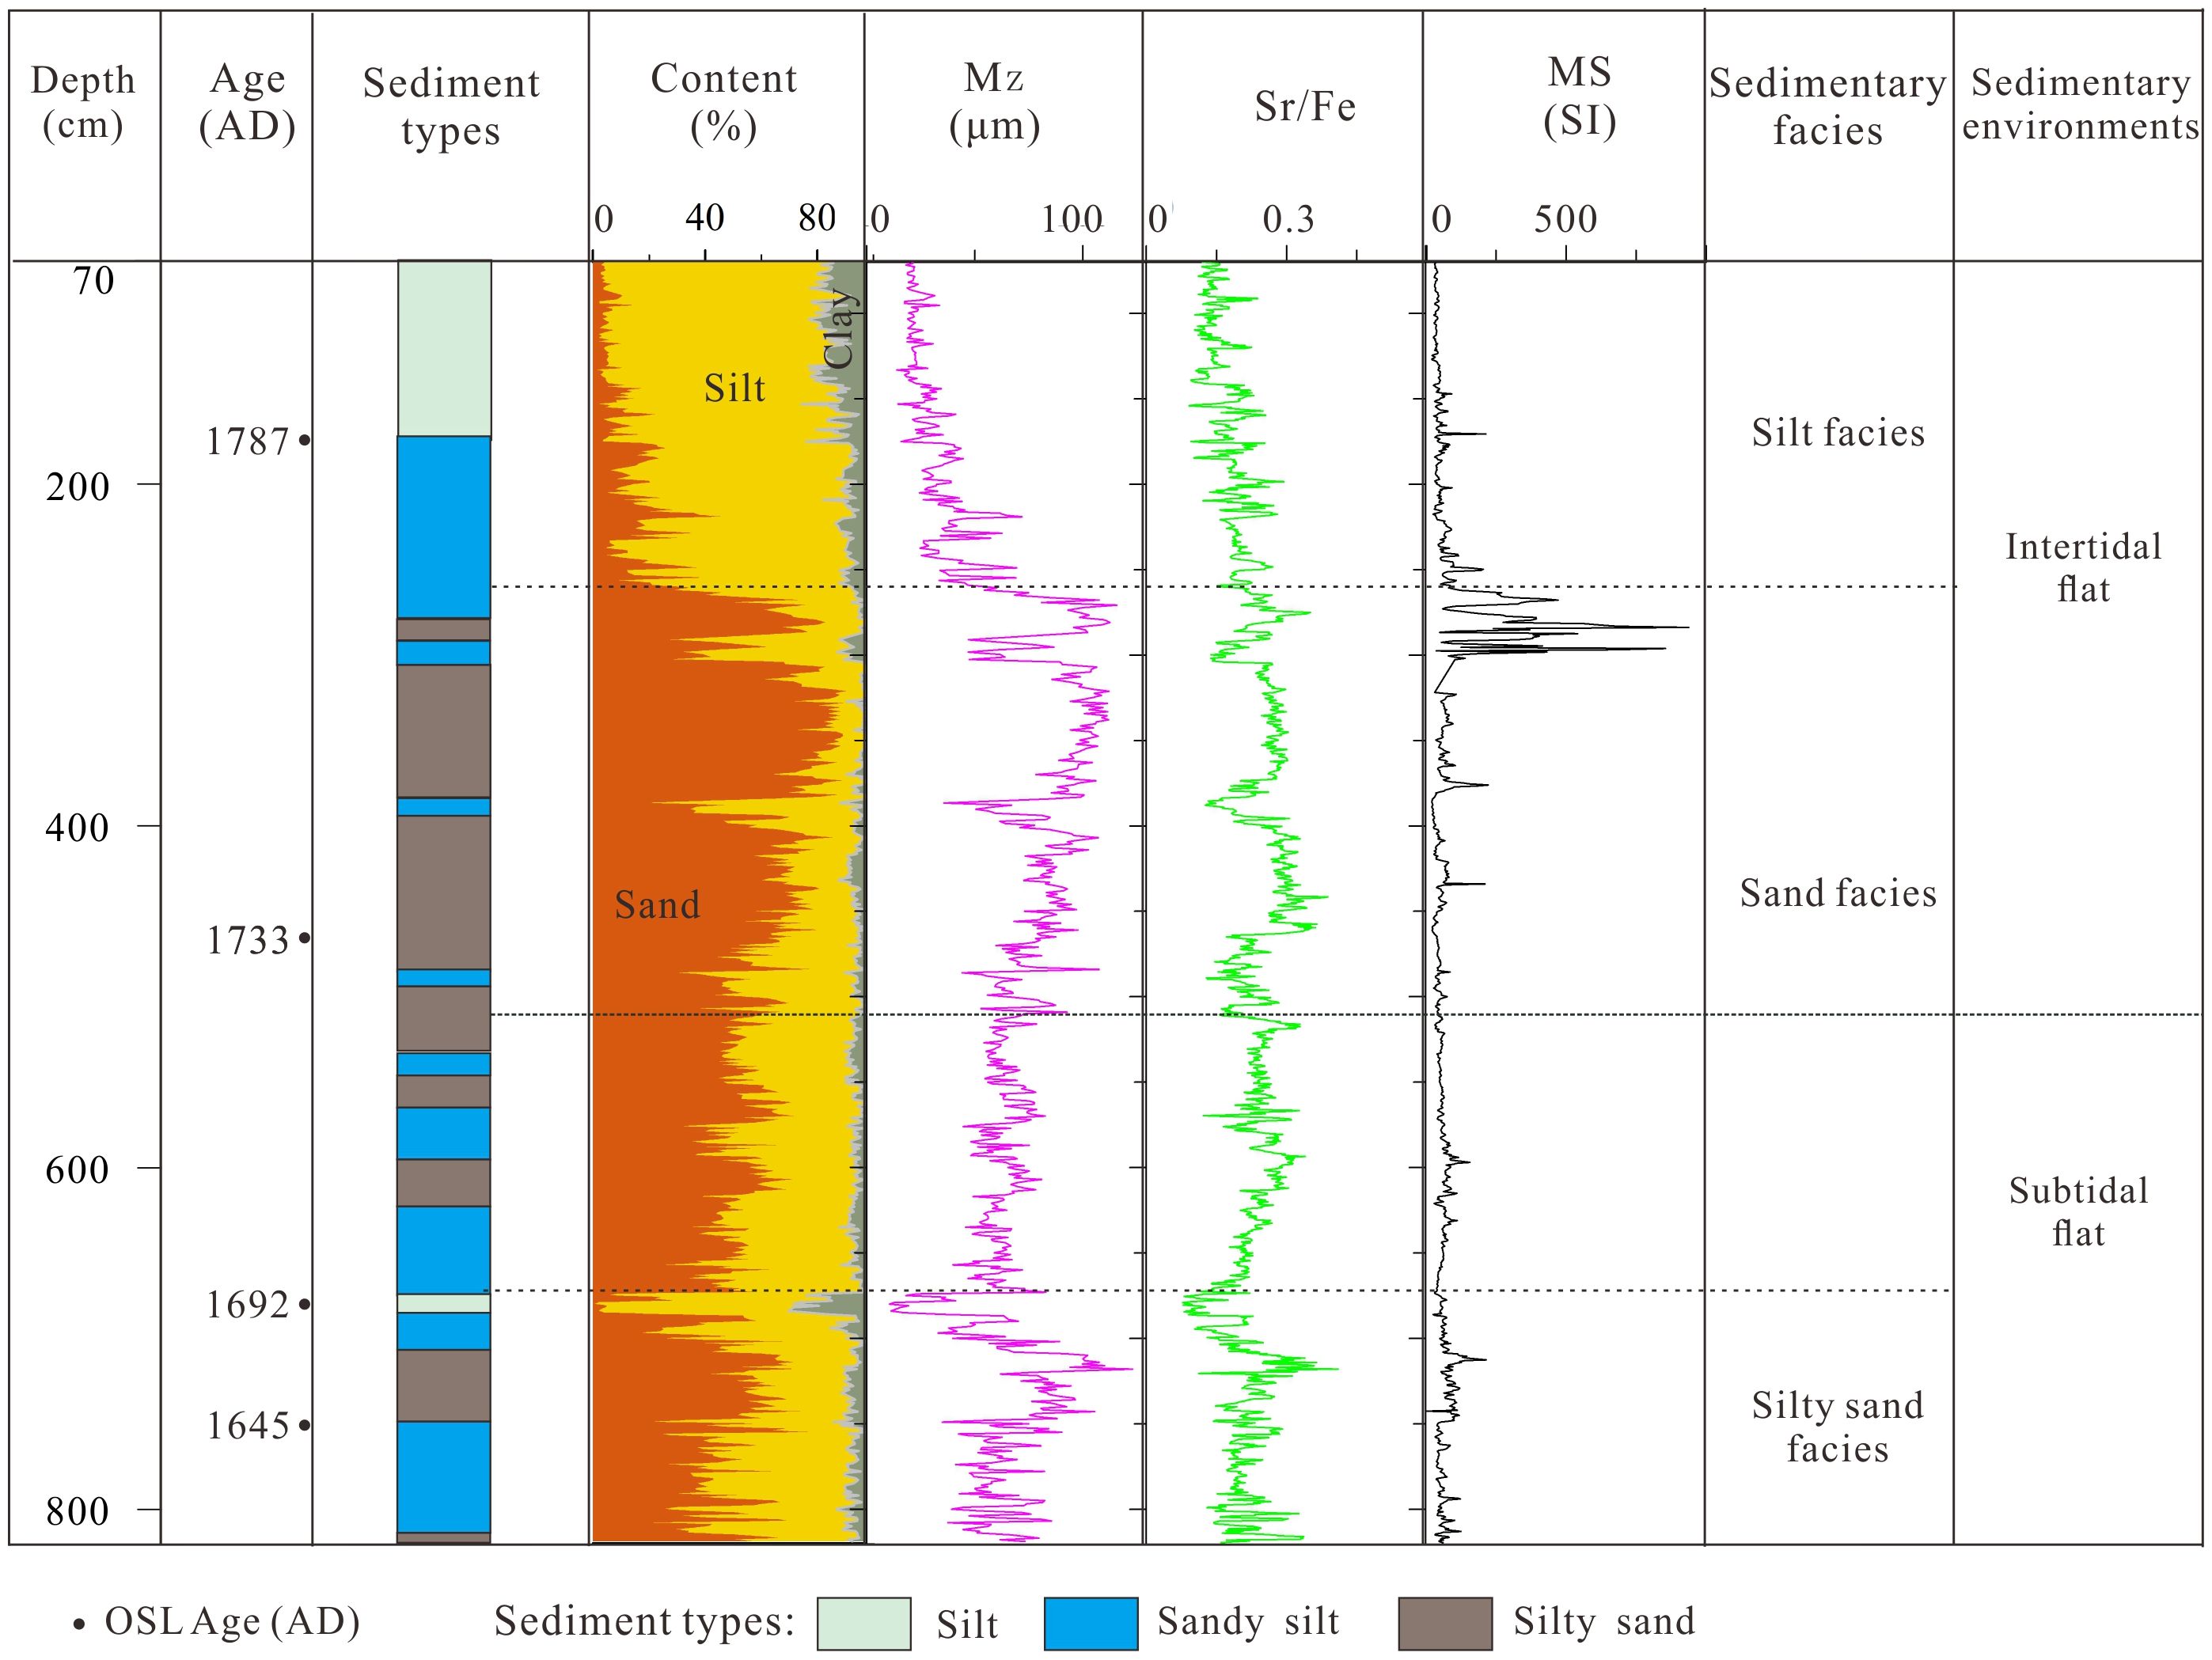
Figure 6 Stratigraphy of core ZP02 and classification of sedimentary environments and facies. MS refers to magnetic susceptibility. Mz refers to mean grain size.
4.5 Characteristics of the sedimentary environments and facies
In most cases, sediment on tidal flats consists of materials ranging in size from sand to clay. Sandy materials tend to accumulate in the lower part of the tidal flat, while muddy materials deposit in its upper part (Reineck and Singh, 1980; Gao, 2018). Between the upper and lower parts, the central region of the tidal flat usually consists of interbedded sand and mud.
The lowest part of the core ZP02 consists of sandy layers, which are interpreted as corresponding to the lower intertidal and subtidal zones (Reineck and Singh, 1980; Gao, 2018). Sediment cores taken from the upper part of tidal flats often exhibit ‘fining upward’ size grading (Klein, 1985).
Based on the lithological characteristics, chronological framework, grain size, and geochemical data, and excluding the artificially disturbed layer from 0 to 70 cm, the depositional environment since AD 1665 can be reconstructed. The part of the sediment core analyzed can be divided into two sedimentary environments: the intertidal zone and the subtidal zone. There are three sedimentary facies: silt facies, sand facies, and silty sand facies (Figure 6).
In terms of the development stages, the sedimentary sequence can be divided into two phases.
Phase One: AD 1665–1776, burial depth of 8.2 to 2.6 m. During this period, the sediment grain size shows an upward coarsening trend, accompanied by the abundant presence of shell fragments and the development of parallel lamination. The coloration is primarily gray-brown and bluish-gray, indicating predominance of a reducing environment which is compatible with extended periods of submersion. The Sr/Fe ratio is relatively high overall, but it noticeably decreases in certain regions of the core (e.g., 668–685 cm), reflecting the influence of both marine and terrestrial sediments. This phase corresponds to sedimentation from subtidal to intertidal zones. The sedimentary facies include sand and silty sand facies, with a boundary at approximately 6.6 m.
Phase Two: AD 1776-1816, burial depth of 2.6 to 0.7 m. In this segment, the sediment is fining upwards, characterized by interbedding of mud and sand, and the development of lenticular bedding. The color transitions from gray-brown to yellow-brown, and rust spots appear in the upper part, indicating a transition to an oxidative environment. The Sr/Fe ratio decreases upwards. This phase represents the upper part of the intertidal zone in terms of the sedimentary environment, with sedimentary facies characterized by silt.
5 Discussion
5.1 Establishment of sedimentary tracing fingerprints for typhoon and flood events on Chongming Island
Extreme events in tidal flat environments, such as typhoons and floods, leave distinct sedimentary records that markedly differ from those formed under calm weather conditions (Fan et al., 2006; Gao, 2017; Muller et al., 2022). Typhoon-related deposits are typically present as minerogenic sandy sediments (coarse sand layers) or mixed with a large amount of shell debris. These deposits can reach centimeter-scale thickness and exhibit distinct sedimentary structures and geochemical profiles (such as peaks in Sr) compared to normal weather deposits (Woodruff et al., 2009; Muller et al., 2022; Yang et al., 2022a). During flood events in the Yangtze River, a significant influx of terrestrial materials into the estuary occurs. Flood deposits exhibit noticeable differences in stratigraphy, color, and physicochemical properties compared to deposits formed under tranquil conditions (Wang et al., 2011; Zhou et al., 2021; Lu et al., 2023). During intense hydrodynamic river flood events in the Yangtze River, deposits in the core exhibit an upward coarsening in grain size and poor sorting, but also show significant regional variation (Zhou et al., 2021). Low-frequency or near-zero flow velocity with advection or diffuse flow form relatively finer-grained event layers (Yang et al., 2022b).
Due to the effects of tidal flat elevation and water level, typhoons exhibit distinct sedimentary characteristics at various locations within the tidal flat. Consequently, the establishment of typhoon event tracing fingerprints in tidal flats necessitates differentiation across the various sub-environments of tidal flats (Fan et al., 2006; Gao, 2018; Yang et al., 2022a). This involves calculating the background threshold values for normal deposition at each stratigraphic level and then identifying event layers that exceed these background thresholds.
Variations in elemental composition within sediments are closely linked to both marine and terrestrial inputs (Haug et al., 2001; Grygar and Popelka, 2016; Tian et al., 2019; Yan et al., 2020; Goslin et al., 2022). By conducting PCA on elements such as Al, Si, Cl, K, Ca, Ti, Mn, Fe, Zn, Rb, Sr, Zr, and Ba in the sediment cores from Chongming Island, it was determined that the plot of elements along PC1 and PC2 could provide information on terrestrial and marine inputs. The greater the input, the higher the load in each of these principal components (Figure 5).
Geochemical elements are often utilized in the form of ratios, and when combined with the characteristics of individual elements, the Zr/Fe ratio can indicate the presence of coarse-grained particles within a core, particularly useful in identifying coarse sediment deposits in estuarine regions (Tian et al., 2019; Zhou et al., 2021; Zhao et al., 2023). The Ti/Ca ratio is indicative of terrestrial inputs, while the Sr/Fe ratio signals marine sources (Croudace and Rothwell, 2015). The combination of Ca and Sr, which have affinity properties, indicates the eventual source changes, facilitating the further identification of typhoon event deposits.
As such, the deposition resulting from typhoon and flood events can be identified based on the following characteristics (Figure 7):
● The sediments exhibiting grain size coarser than the threshold of background-coarse grains, with Principal Component 2 at peak values, and Zr/Fe and Sr/Fe ratios showing peak variations, are indicative of typhoon deposits.
● Sediments with grain size coarser than the threshold of background-coarse grains, with Principal Component 1 at peak values, coupled with peak variations in the Zr/Fe and Ti/Ca ratios, are indicative of river flooding event deposits.
● Sediments with grain sizes finer than the threshold of background-fine grains, but with Principal Component 1 in the high peak value range, and exhibiting no significant change in Zr/Fe ratio but a peak variation in Ti/Ca ratio, are indicative of flood event deposits.
● Sediments with grain sizes slightly coarser than the threshold of background-coarse grains, finer than the threshold of background-fine grains or between the two thresholds, but with no significant variation in other indicators, are characteristic of normal tidal flat deposit.
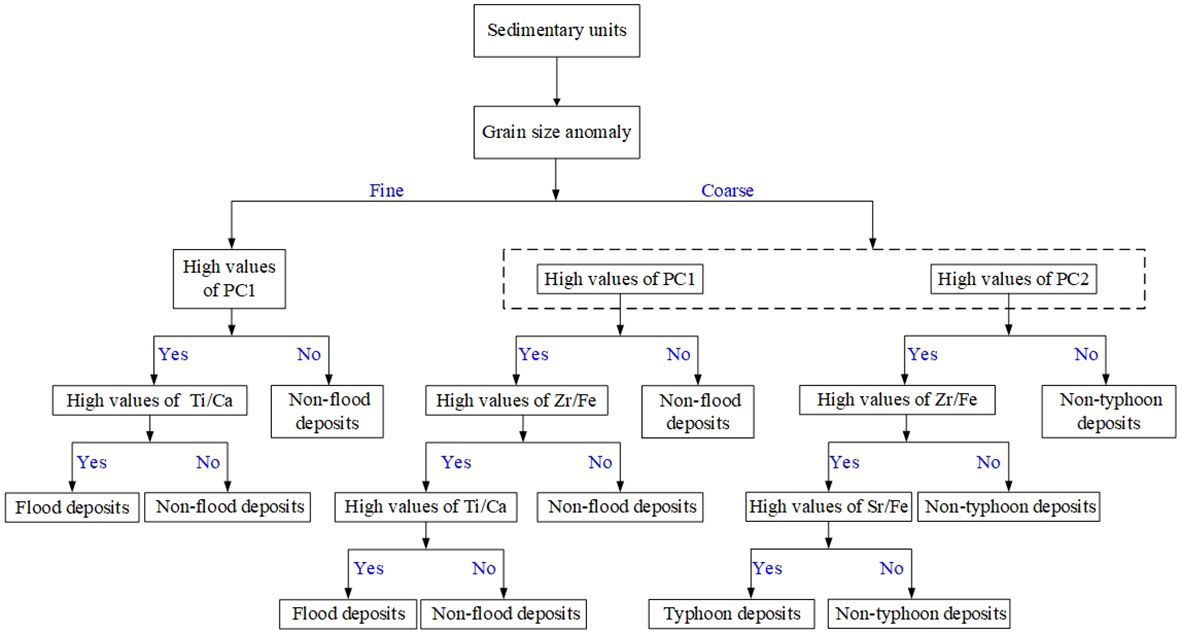
Figure 7 Tracing fingerprints of typhoon and flood deposits and flow chart for their identification. “Non-typhoon” refers to flood and regular sedimentation. “Non-flood” refers to typhoon and regular sedimentation.
5.2 Application to Chongming Island core
5.2.1 Analysis of typhoon and flood events in sediment
Based on grain size, elemental composition, and magnetic susceptibility, the 70–263 cm section of Core ZP02 is identified as silt facies (Figure 6), the threshold of background-fine and coarse grains are 19.9 μm and 30.4 μm, respectively. The 263–820 cm section corresponds to the sand and silty sand facies, where grain size coarsens from bottom to top and shows significant variation at different depths. This section was divided into two segments, 263–660 cm, and 660–820 cm. For the former, the thresholds of background-fine and coarse grains are 56.5 μm and 76.9 μm, respectively. For the latter, the thresholds of background-fine and coarse grains are 38.6 μm and 70.7 μm, respectively. Typhoon and flood events identified in Core ZP02 using these tracing fingerprints are illustrated in Figure 8, where gray and yellow areas represent typhoon and flood event deposits, respectively, with 19 layers each (for a photograph of a typical extreme event layer, see Figure 9).
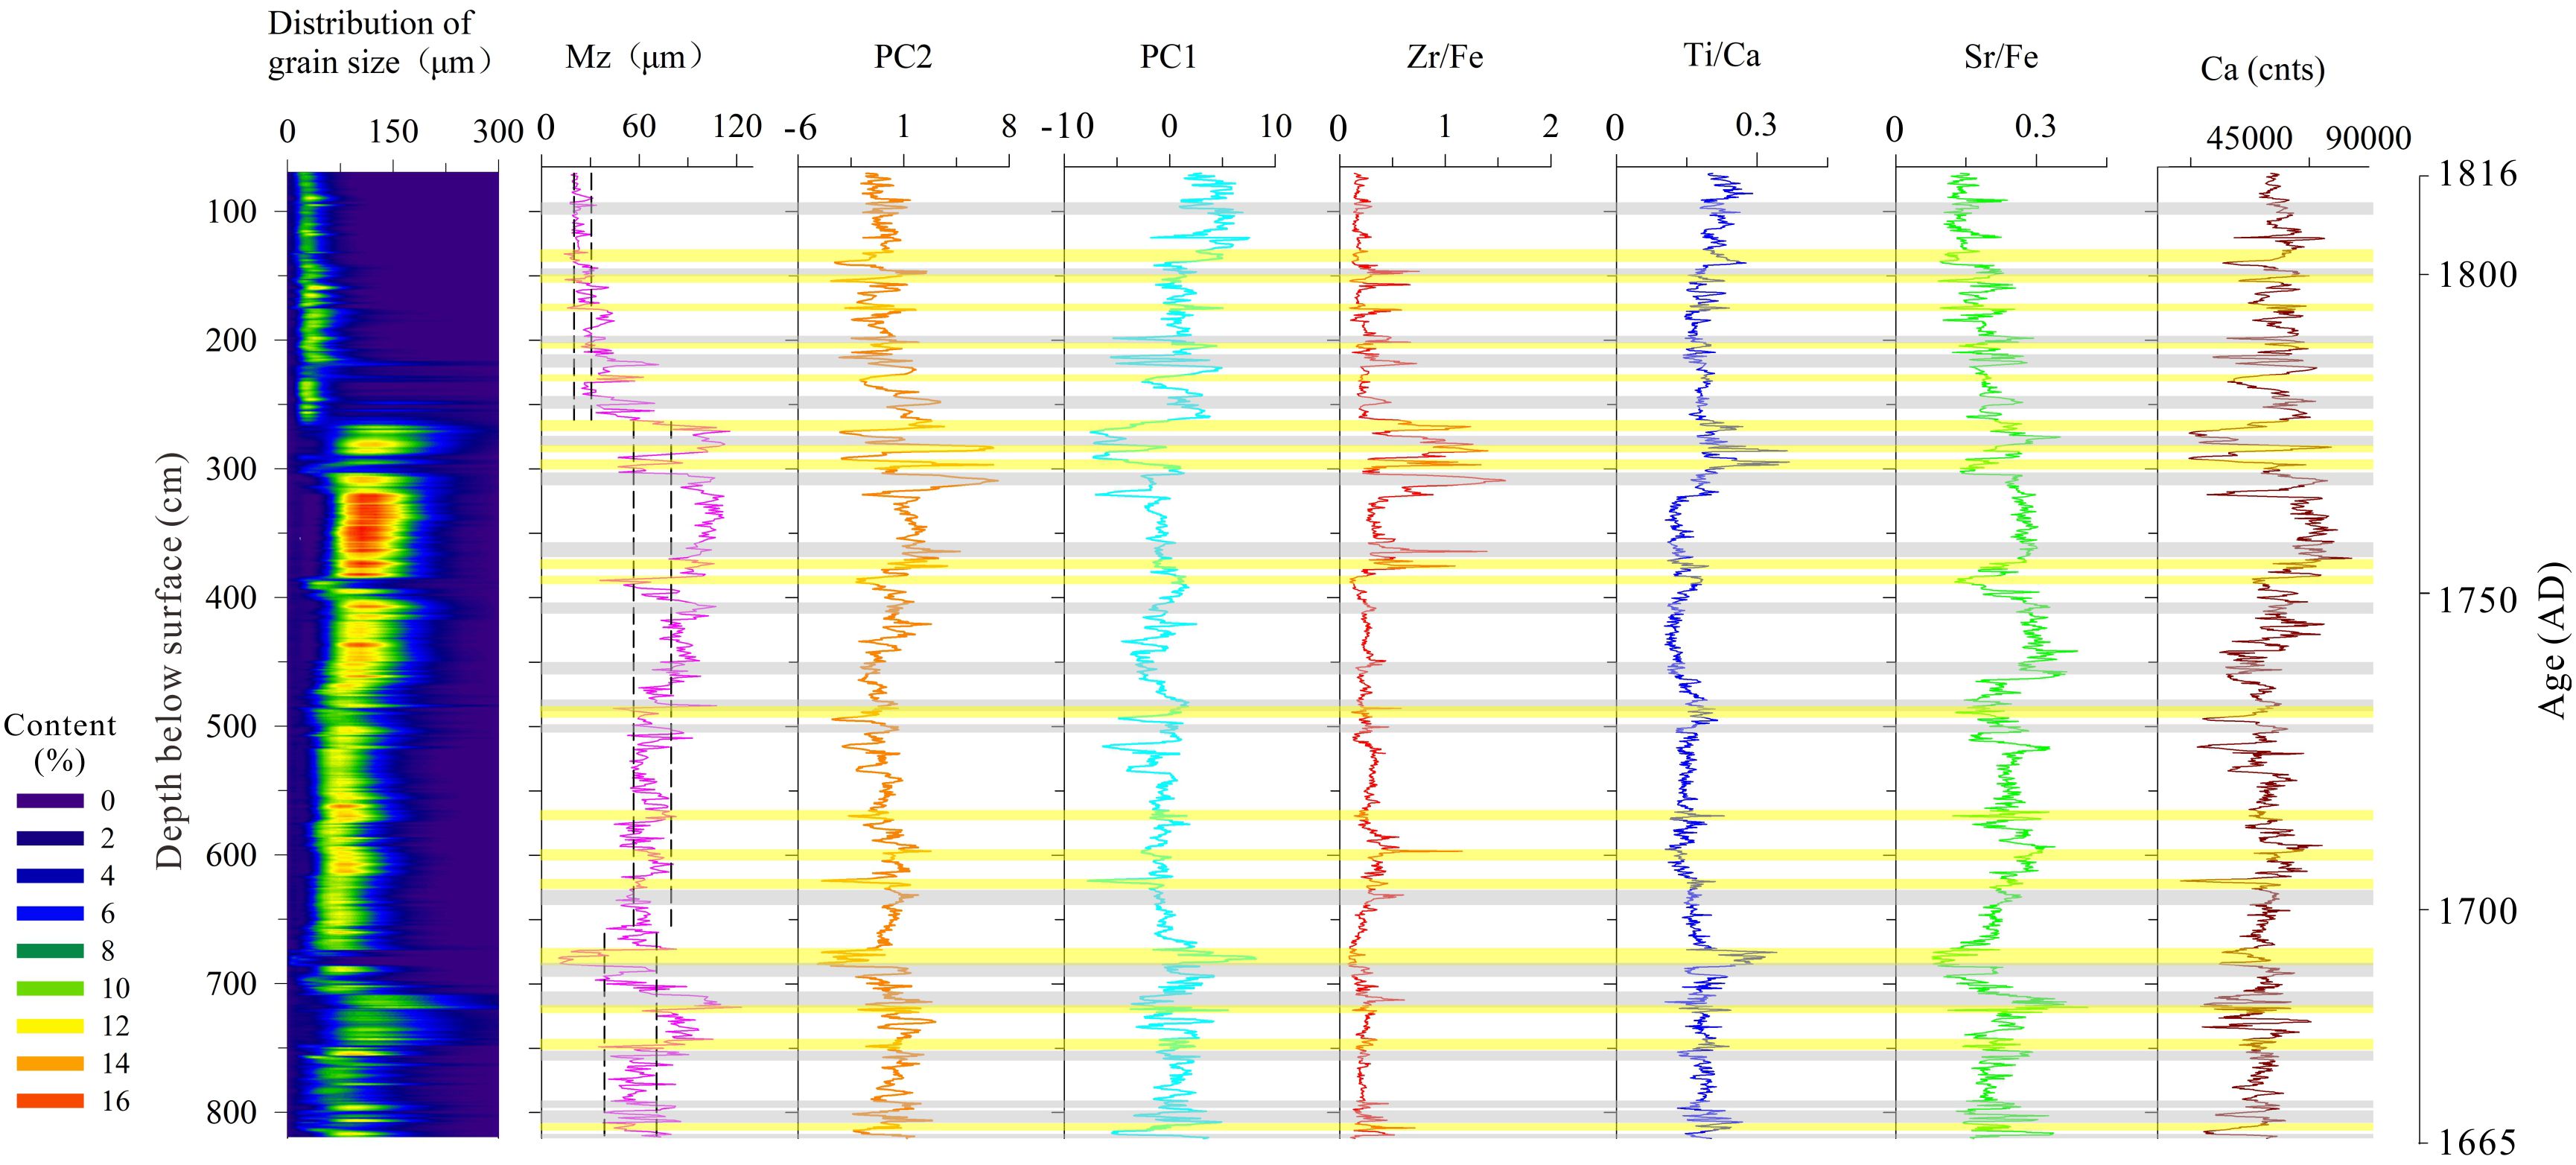
Figure 8 Multi-indicator typhoon and flood identification layer diagram of core ZP02. In the Mz diagram, the vertical dashed lines (left) represent mean grain size−one standard deviation (unit: μm) and the vertical dashed lines (right) represent mean grain size+one standard deviation (unit: μm). The horizontal light gray bands represent typhoon layers, while the yellow bands denote flood layers.
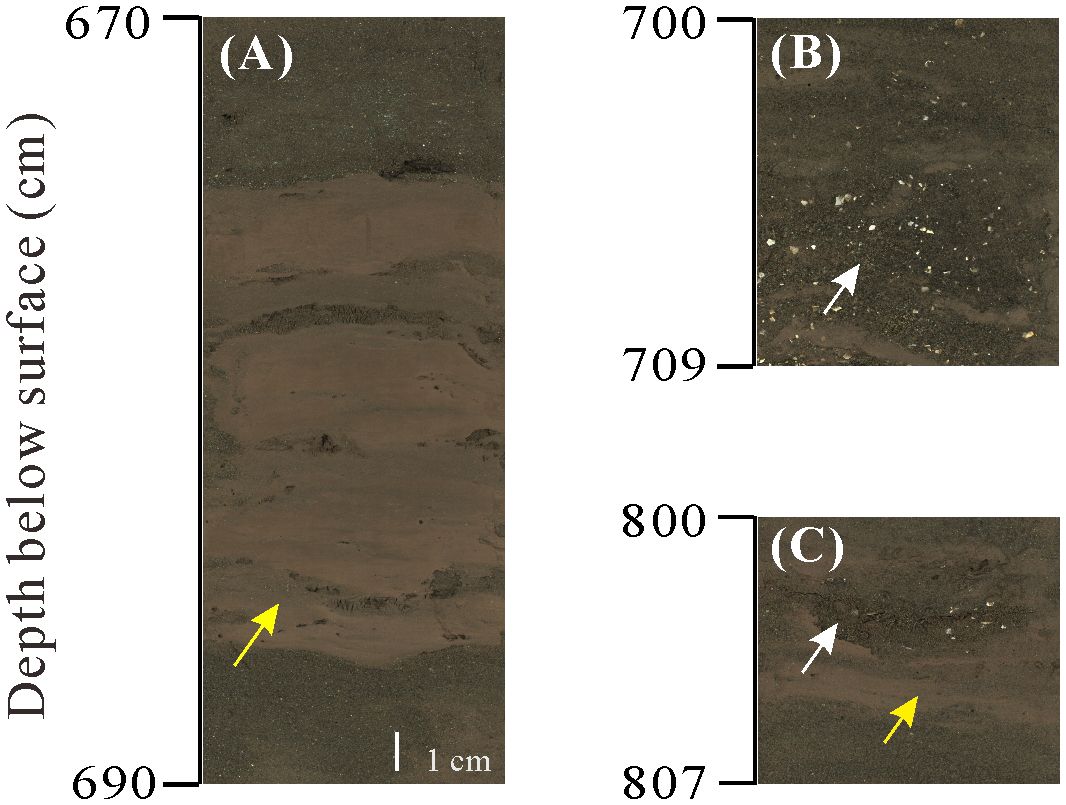
Figure 9 Photographs of typical typhoon and flood event deposits in core ZP02. The yellow arrows panels (A, C) indicate flood deposits, and white arrows panels (B, C) indicate typhoon deposits.
In summary, typhoon deposits typically exhibit sharp contact surfaces, coarser grain sizes with an upward fining trend, and often contain layers with minerogenic coarse sand and shell fragments, or just minerogenic sand (Figures 8, 9). In these layers, Principal Component 2 (PC2), as well as Zr/Fe and Sr/Fe ratios, tend to be high while the Ti/Ca ratio usually remains in a range of low values (Figure 8). Flood event deposits display either coarser or finer sediment compared to the background threshold, with Principal Component 1 (PC1) and the Ti/Ca ratio in higher value regions. Usually, PC2, Sr/Fe ratios, and Ca concentrations in flood deposits tend to be in lower-value regions. Notably, in cases where flood event deposits show coarser grain sizes, the Zr/Fe ratio also tends to be high (Figures 8, 9). The sedimentary layers deposited during typhoons and river floods also exhibit color changes in comparison with the permanent regime sediments.
Dividing the comprehensive depth-age model of Chongming Island cores into 50 years-long intervals (Table 1) suggests that more typhoon and flood event layers occurred in the periods 1665-1714 and 1765-1816 compared to 1715-1765. Generally, both typhoon and flood frequencies exhibit an ‘increase-decrease-increase’ pattern over these intervals.
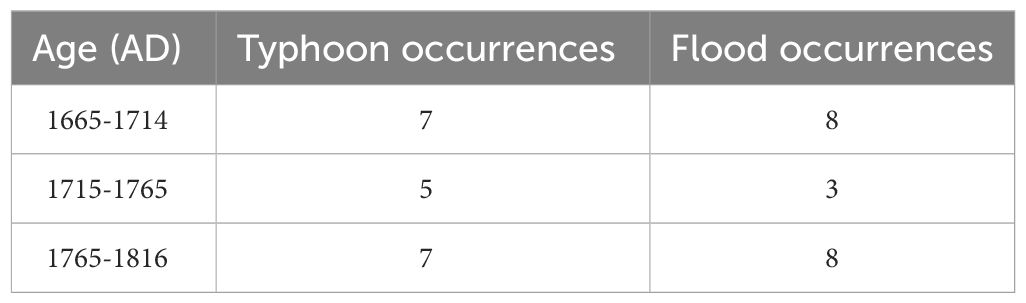
Table 1 Time variation of the occurrences of typhoon and flood events identified in core ZP02.
5.2.2 Comparison of sedimentary records with documentary records
The sedimentary column accumulated from 1665 to 1816, and sampled by Core ZP02, contains 19 typhoon layers and 19 flood layers (Figure 8). According to the sedimentary record, typhoons were more frequent in 1665-1702, 1727-1755, and 1766-1816 (Figure 10), with 7, 5, and 7 events respectively. As for flood layers, they were more frequent during 1665-1702 and 1769-1801 (Figure 11), with 7 and 6 occurrences respectively, followed by 3 events from 1733 to 1755, while no flood layers were identified in other periods. Notably, both typhoon and flood events were recorded in Core ZP02 in 1732 and 1755.
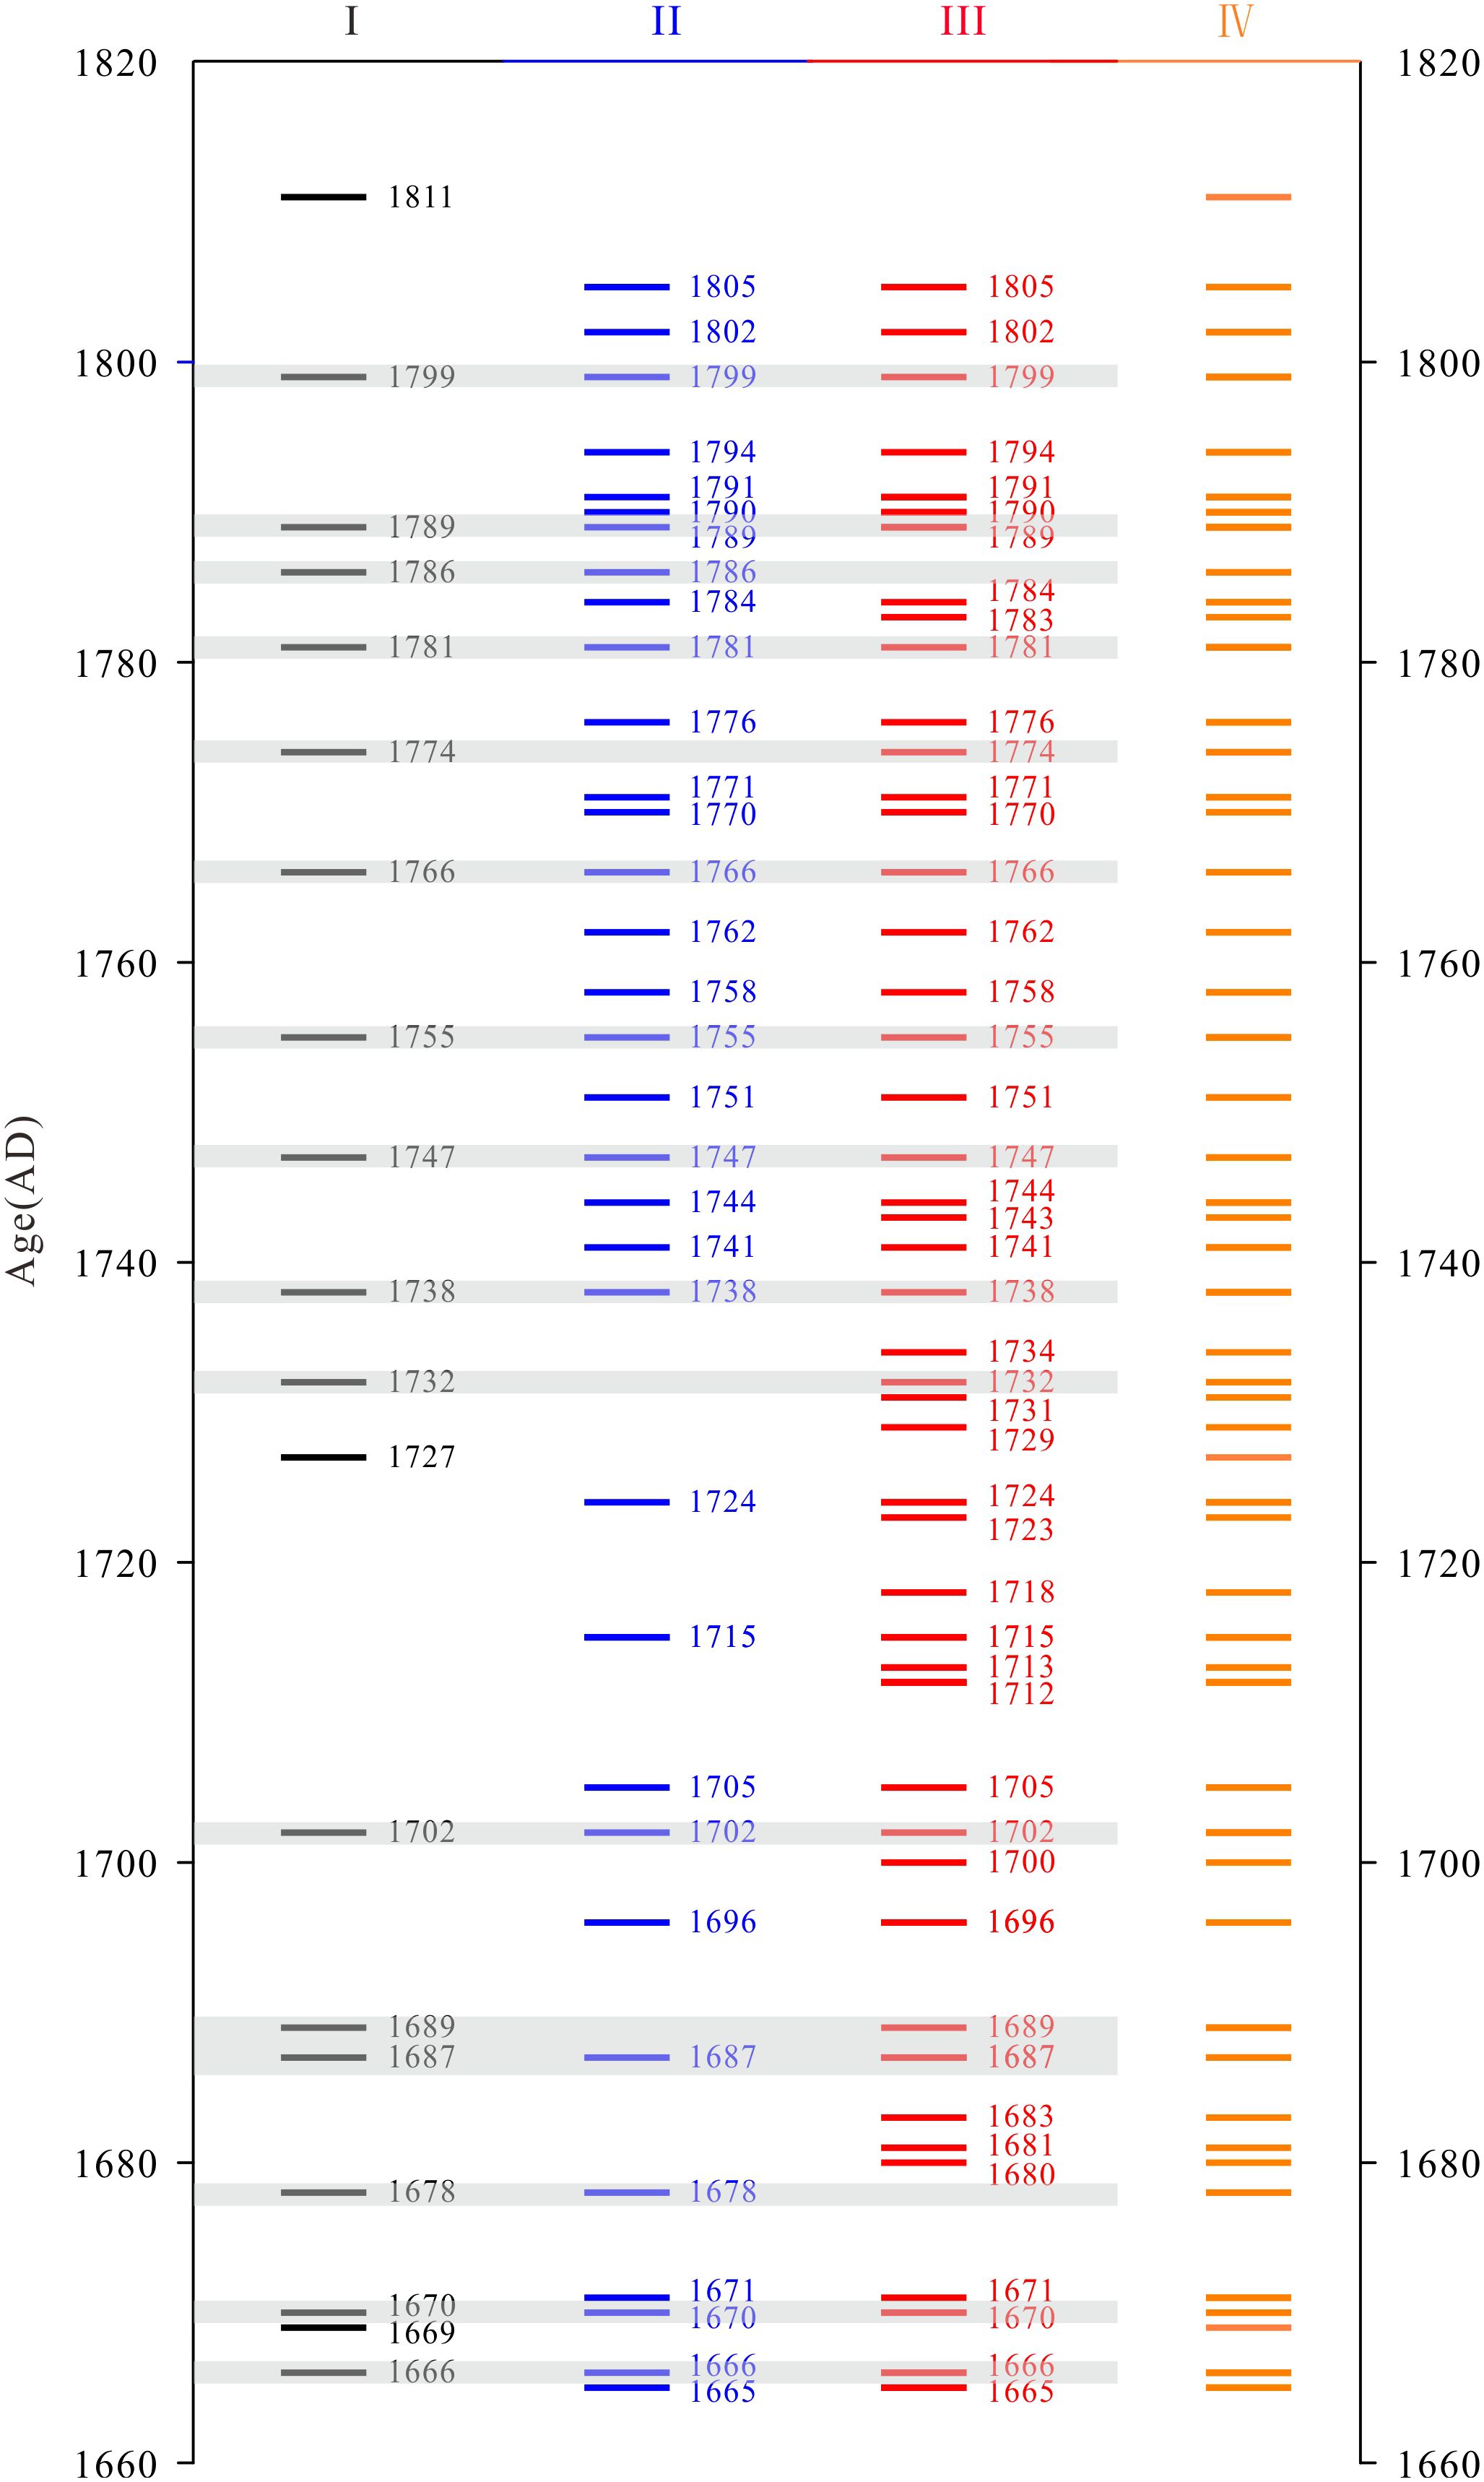
Figure 10 Typhoon chronology in core ZP02 (1665-1816). Column I indicates dates of typhoon events identified in core sediments using the tracing fingerprints proposed herein; column II indicates the dates of typhoon events according to ‘The History of Natural Disasters in Shanghai’ (Liu et al., 2010); column III indicates dates of typhoon events as per ‘The Encyclopedia of Meteorological Disasters in China: Shanghai Volume’ (Wen and Xu, 2006); column IV contains a compilation of typhoon event dates by combining the first three columns; Horizontal gray stripes indicate the alignment of typhoon events in the core with documentary records.
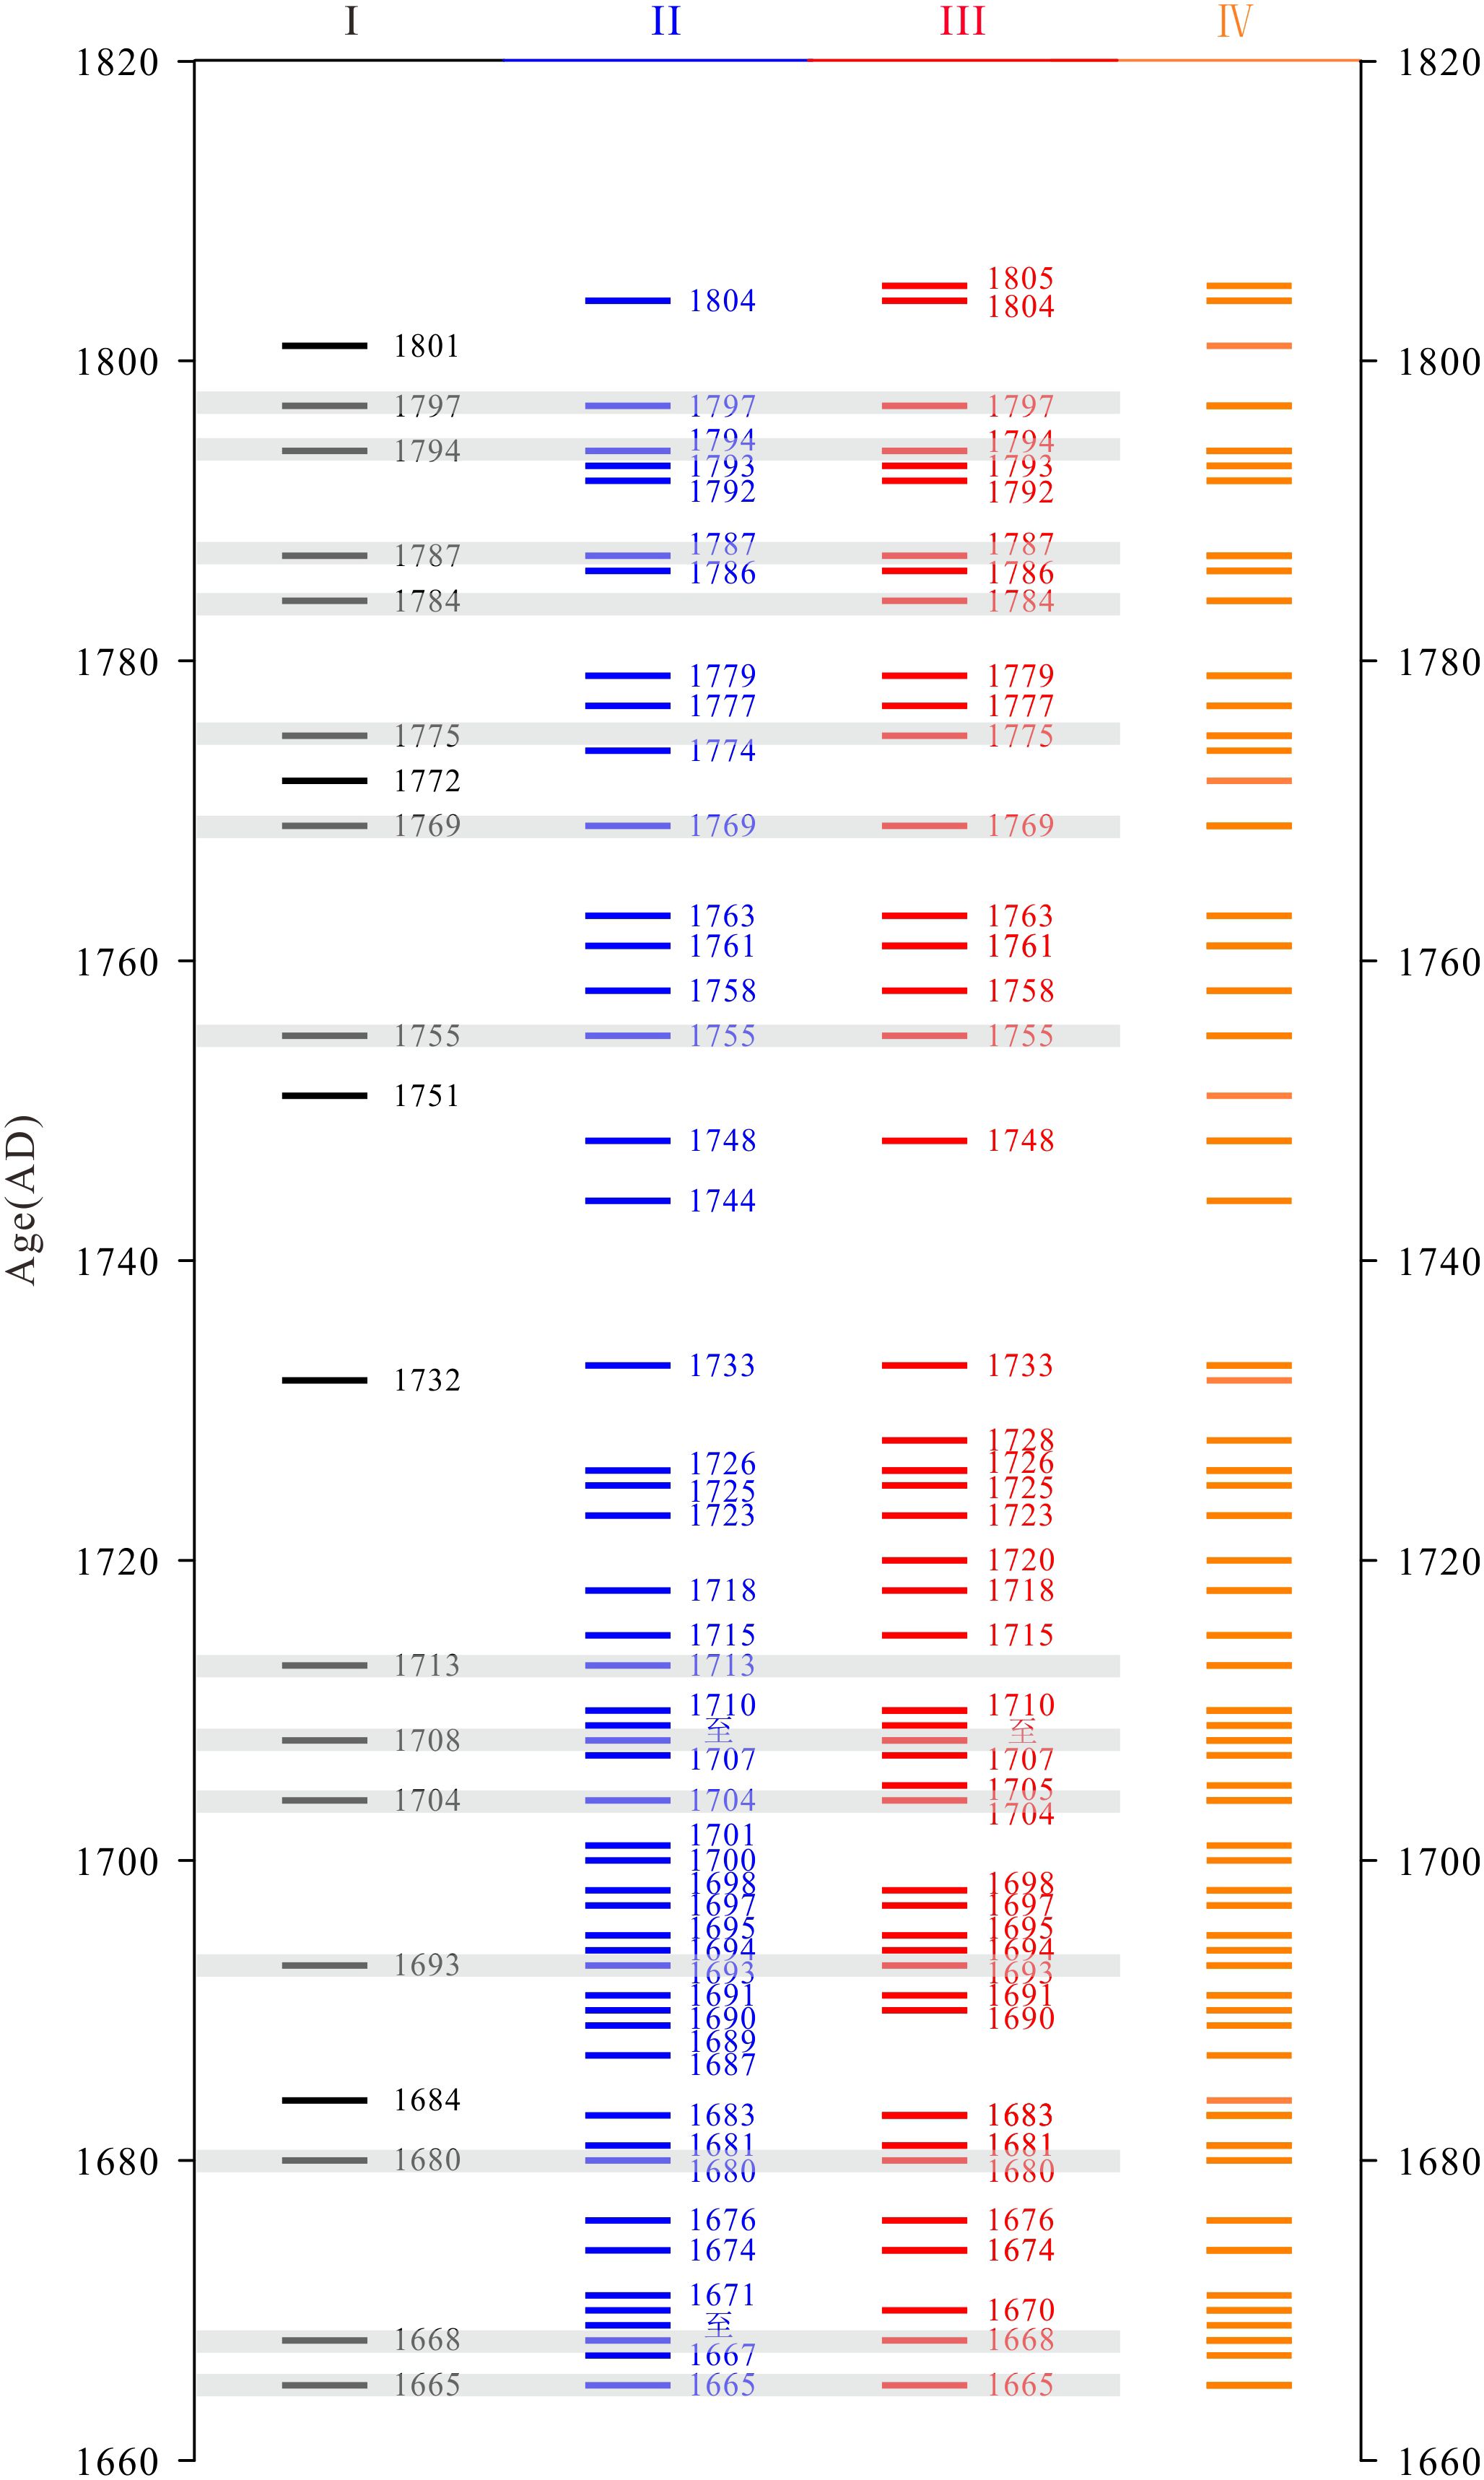
Figure 11 Flood chronology in core ZP02 (1665-1816). Column I indicates dates of flood events identified in core sediments using the tracing fingerprints proposed herein; column II indicates the dates of flood events according to ‘The History of Natural Disasters in Shanghai’ (Liu et al., 2010); column III indicates dates of with flood events as per ‘The Encyclopedia of Meteorological Disasters in China: Shanghai Volume’ (Wen and Xu, 2006); column IV contains a compilation of flood event dates by combining the first three columns; Horizontal gray stripes indicate the alignment of flood events in the core with documentary records.
According to documentary records, a total of 49 years is characterized by typhoon occurrences and 57 years by flood events from 1665 to 1816. Comparing these two types of extreme events as identified in Core ZP02 and documentary records (Figures 10, 11), it was found that in some years both typhoon and flood events occurred. For instance, in 1732, documentary records mention a storm surge on July 16th in Chongming County that caused widespread inundation and numerous deaths, but no flood event is recorded. However, in 1733, flood conditions are described, although falling within the margin of chronological error. In 1755, both typhoon and flood events are documented in the literature, with descriptions such as ‘severe storm tides’ and ‘major flood disasters’ (Wen and Xu, 2006; Liu et al., 2010). In both 1755 and 1732, flood deposits occurred before typhoon deposits. The corresponding event-layers of both flood and typhoon events exhibit coarser grain sizes and high Zr/Fe ratios. The difference lies in the PC2, Sr/Fe and Ca values, which are high in typhoon layers and low in PC1, whereas the flood layers characteristics are the opposite (Figure 8).
The event layers in core ZP02 indicate that there were 16 typhoon layers and 14 flooding layers from 1665 to 1815 correspond with documentary evidence (Table 2). Additionally, there were 3 years of typhoon and flood events recorded solely in the core and not matched in documents. Conversely, there were 33 years of typhoon and 43 years of flood events recorded in documents that were not identified in the core. Combining the sedimentary and documentary records, we conclude that during 1665-1816, there were a total of 52 years with typhoon events and 61 years with flood events. Documentary records two types of extreme events that were not identified in the sedimentary record. Firstly, extreme events may not leave positive sedimentary records in areas, where they primarily cause erosion. In these cases, only erosional surfaces appear in the sedimentary column without the formation of event deposits (Fan et al., 2006; Donnelly and Woodruff, 2007; Tian et al., 2019). Additionally, the preservation potential of event deposits is influenced by factors such as the channel meandering in the estuary, low sedimentation rates, hydrodynamic conditions, and spatial location (Gao, 2009; Feng et al., 2016; Gao et al., 2019). Conversely, documentary descriptions are susceptible to loss or damage due to wars, natural disasters, and other disturbances, leading to inevitable gaps in records. The use of sedimentary fingerprints of extreme typhoon and flood events provides a methodological foundation for interpreting sedimentary records in regions affected by these two types of events. The study of typhoon and river flood events on Chongming Island provides valuable insights for its management. It aids in formulating measures to protect and restore the ecosystem and enhances the capacity to respond to future extreme events.
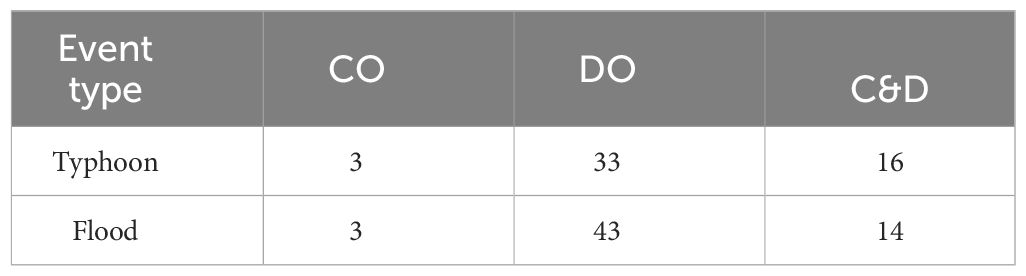
Table 2 Number of occurrences of the typhoon or flood events that were recorded in core but absent in documents (CO), in documents but absent in core (DO), and both in core and documents (C&D), from 1665 to 1816.
6 Conclusions
In this study we conduct a comprehensive analysis of the ZP02 sediment core taken from the eastern Chongming Island, using OSL dating, lithological, grain size, and geochemical properties and magnetic susceptibility assessment, for paleoenvironmental reconstruction, focusing on trace fingerprints associated with extreme river floods and typhoons. Sedimentary data were combined with documentary records of typhoons and floods. The main conclusions are as follows.
(1) Grain size and elemental composition of event deposits exhibit significant differences when triggered by typhoon and flood events. In typhoon event layers, sediment grain size coarsens, the load of diagnostic elements along Principal Component 2 (PC2) reaches peak values, and Zr/Fe and Sr/Al ratios show high variations. In river flood event layers, sediment grain size can increase, maximum loads of diagnostic elements were found along Principal Component 1 (PC1), and Zr/Fe and Ti/Ca show very large; alternatively, the grain size can decrease with PC1 at peak values, but without significant change in Zr/Fe and large variations in Ti/Ca.
(2) Utilizing the tracing fingerprints established in this study, 19 typhoon and the same number of flood event layers were identified in sediments accumulated during the 1665-1816 period. By dividing the depth-age model of Chongming Island core 50 years-long intervals, frequency of typhoons and floods was observed to change and characterized by a pattern of ‘increase-decrease-increase’.
(3) From 1665 to 1816, the extreme event layers identified in the core were compared with documentary records of typhoons and floods in the region of Shanghai, resulting in a match for 16 typhoon event years and 14 flood event years. Combining the event deposit records from Core ZP02 with documentary records, we conclude that there were 52 years with typhoon events and 61 years with flood events during that period. Part of the non-matching data may be due to gaps in the documentary compilations and inability of typhoon or flood inundations to leave positive sedimentary record. As a result, the number and frequency of typhoon and flood events recorded in documents covering the Changjiang estuary and number and frequency of the events identified in sediment are fewer and lower, respectively than the actual occurrences.
Data availability statement
The original contributions presented in the study are included in the article/Supplementary Material. Further inquiries can be directed to the corresponding authors.
Author contributions
PZ: Writing – original draft, Data curation, Formal analysis, Methodology. YY: Methodology, Writing – review & editing. JJ: Methodology, Writing – review & editing. NZ: Methodology, Writing – review & editing. WZ: Methodology, Writing – review & editing. SG: Conceptualization, Funding acquisition, Writing – review & editing.
Funding
The author(s) declare financial support was received for theresearch, authorship, and/or publication of this article. This study was financially supported by the Open Research Fund of State Key Laboratory of Estuarine and Coastal Research (Grant No. SKLEC-KF202302), National Natural Science Foundation of China grant 41530962, 42276050, 41876092, and Shanghai Pilot Program for Basic Research (Grant No. TQ20220101).
Acknowledgments
Sheng Xu, Chengfeng Xue, Yaping Mei, Zhenqiao Liu, and Zhaoxiang Yang are thanked for their assistance in core acquisition and laboratory analyses. Li Tian is thanked for the guidance during XRF experiments. Fengyue Qiu and Liang Zhou are thanked for their guidance in OSL experiments. Dan Zhang is thanked for guidance in grain size experiments. The authors thank two reviews for their critical comments on the original manuscript.
Conflict of interest
The authors declare that the research was conducted in the absence of any commercial or financial relationships that could be construed as a potential conflict of interest.
Publisher’s note
All claims expressed in this article are solely those of the authors and do not necessarily represent those of their affiliated organizations, or those of the publisher, the editors and the reviewers. Any product that may be evaluated in this article, or claim that may be made by its manufacturer, is not guaranteed or endorsed by the publisher.
Supplementary material
The Supplementary Material for this article can be found online at: https://www.frontiersin.org/articles/10.3389/fmars.2024.1366676/full#supplementary-material
References
Ballarini M., Wallinga J., Murray A. S., Van Heteren S., Oost A. P., Bos A. J. J., et al. (2003). Optical dating of young coastal dunes on a decadal time scale. Quat. Sci. Rev. 22, 1011–1017. doi: 10.1016/S0277-3791(03)00043-X
Bao J., Gao S. (2021). Wetland utilization and adaptation practice of a coastal megacity: a case study of Chongming Island, Shanghai, China. Front. Environ. Sci. 9, 627963. doi: 10.3389/fenvs.2021.627963
Bhatia K. T., Vecchi G. A., Knutson T. R., Murakami H., Kossin J., Dixon K. W., et al. (2019). Recent increases in tropical cyclone intensification rates. Nat. Commun. 10, 635. doi: 10.1038/s41467-019-08471-z
Blaauw M., Christen J. A. (2011). Flexible paleoclimate age-depth models using an autoregressive gamma process. Bayesian Anal. 6, 457–474. doi: 10.1214/11-BA618
Chagué-Goff C., Schneider J. L., Goff J. R., Dominey-Howes D., Strotz L. (2011). Expanding the proxy toolkit to help identify past events-lessons from the 2004 Indian Ocean Tsunami and the 2009 South Pacific Tsunami. Earth-Sci. Rev. 107, 107–122. doi: 10.1016/j.earscirev.2011.03.007
Chen J. Y. (1988). Comprehensive survey report on the coastal zone and tidal flat resources of Shanghai Vol. 4 (Shanghai: Shanghai Scientific and Technical Publishers).
Chen Y., Zhang W., Nian X., Sun Q., Ge C., Hutchinson S. M., et al. (2021). Greigite as an indicator for salinity and sedimentation rate change: evidence from the Yangtze River Delta, China. J. Geophys. Res. Solid Earth. 126, e2020JB021085. doi: 10.1029/2020JB021085
Chu Z. X., Zhai S. K., Lu X. X., Liu J. P., Xu J. X., Xu K. H. (2009). A quantitative assessment of human impacts on decrease in sediment flux from major Chinese rivers entering the western Pacific Ocean. Geophys. Res. Lett. 36, 1–5. doi: 10.1029/2009GL039513
Croudace I. W., Löwemark L., Tjallingii R., Zolitschka B. (2019). Current perspectives on the capabilities of high resolution XRF core scanners. Quat. Int. 514, 5–15. doi: 10.1016/j.quaint.2019.04.002
Croudace I. W., Rothwell R. G. (2015). Micro-XRF Studies of Sediment Cores: Applications of a non-destructive tool for the environmental sciences (Springer). doi: 10.1007/978-94-017-9849-5
Cunha P. P., Buylaert J. P., Murray A. S., Andrade C., Freitas M. C., Fatela F., et al. (2010). Optical dating of clastic deposits generated by an extreme marine coastal flood: the 1755 tsunami deposits in the Algarve (Portugal). Quat. Geochronol. 5, 329–335. doi: 10.1016/j.quageo.2009.09.004
Davies J. L. (1964). A morphogenic approach to world shorelines. Z. Geomorphol. 8, 127–142. doi: 10.1127/zfg/mortensen/8/1964/127
Donnelly J. P., Woodruff J. D. (2007). Intense hurricane activity over the past 5,000 years controlled by El Niño and the West African monsoon. Nature. 447, 465–468. doi: 10.1038/nature05834
Duan Z. F., Li C., Bi L., He Z. F., Li F. L., Yang S. Y. (2020). Provenance Tracing of sediment in Changjiang Estuary in the past 150 years and the implications: case study in core H12 at Chongming Island. Acta Sedimentol. Sin. 38, 204–1214. doi: 10.14027/j.issn.1000-0550.2020.002
Duller G. A. T. (2003). Distinguishing quartz and feldspar in single grain luminescence measurements. Radiat. Meas. 37, 161–165. doi: 10.1016/S1350-4487(02)00170-1
Emanuel K. (2005). Increasing destructiveness of tropical cyclones over the past 30 years. Nature. 436, 86–688. doi: 10.1038/nature03906
Ercolani C., Muller J., Collins J., Savarese M., Squiccimara L. (2015). Intense southwest Florida hurricane landfalls over the past 1000 years. Quat. Sci. Rev. 126, 17–25. doi: 10.1016/j.quascirev.2015.08.008
Fan D., Guo Y., Wang P., Shi J. Z. (2006). Cross-shore variations in morphodynamic processes of an open-coast mudflat in the Changjiang Delta, China: With an emphasis on storm impacts. Cont. Shelf Res. 26, 517–538. doi: 10.1016/j.csr.2005.12.011
Feng Z., Liu B., Zhao Y., Li X., Jiang L., Si S. (2016). Spatial and temporal variations and controlling factors of sediment accumulation in the Yangtze River estuary and its adjacent sea area in the Holocene, especially in the Early Holocene. Cont. Shelf Res. 125, 1–17. doi: 10.1016/j.csr.2016.06.007
Folk R. L., Andrews P. B., Lewis D. W. (1970). Detrital sedimentary rock classification and nomenclature for use in New Zealand. N. Z. J. Geol. Geophys. 13, 937–968. doi: 10.1080/00288306.1970.10418211
Fox-Kemper B., Hewitt H. T., Xiao C., Aðalgeirsdóttir G., Drijfhout S. S., Edwards T. L., et al. (2021). “Ocean, cryosphere and sea level change,” in Climate Change 2021: The Physical Science Basis. Contribution of Working Group I to the Sixth Assessment Report of the Intergovernmental Panel on Climate Change. Eds. Masson-Delmotte V., Zhai P., Pirani A., Connors S. L., Péan C., Berger S., et al (Cambridge University Press, Cambridge, United Kingdom and New York, NY, USA), 1211–1362.
Gao S. (2009). Modeling the preservation potential of tidal flat sedimentary records, Jiangsu coast, eastern China. Cont. Shelf Res. 29, 927–1936. doi: 10.1016/j.csr.2008.12.010
Gao S. (2017). Discover more information from sedimentary records: views based on contemporary earth surface dynamic processes. Acta Sedimentol. Sin. 35, 18–925. doi: 10.14027/j.cnki.cjxb.2017.05.005
Gao S. (2018). “Geomorphology and sedimentology of tidal flats,” in Coastal wetlands: an ecosystem integrated approach (2nd edition). Eds. Perillo G. M. E., Wolanski E., Cahoon D., Hopkinson C. (Elsevier, Amsterdam), 359–381.
Gao S. (2022). Human utilization of mega-deltas: the importance of tidally modulated ground surface elevation. Anthropocene Coasts. 5, 2. doi: 10.1007/s44218-022-00002-6
Gao S., Collins M. (1998). The use of grain size trends in marine sediment dynamic. Bull. Natl. Nat. Sci. Found. China. 27, 41–47.
Gao S., Jia J. J., Yang Y., Zhou L., Wei W., Mei Y. J., et al. (2019). Obtaining typhoon information om sedimentary records in coastal-shelf waters. Haiyang Xuebao. 41, 41–160.
Goslin J., Bernatchez P., Barnett R. L., Beland C., Ghaleb B., Didier D., et al. (2022). Importance of coarse sedimentation events in the resilience of microtidal back-barrier saltmarshes to sea-level rise. Mar. Geol. 447, 106793. doi: 10.1016/j.margeo.2022.106793
Grygar T. M., Popelka J. (2016). Revisiting geochemical methods of distinguishing natural concentrations and pollution by risk elements in fluvial sediments. J. Geochem. Explor. 170, 39–57. doi: 10.1016/j.gexplo.2016.08.003
Guan S. D., Li S. D., Hou Y. J., Hu P., Liu Z., Feng J. Q. (2018). Increasing threat of landfalling typhoons in the western North Pacific between 1974 and 2013. Int. J. Appl. Earth Obs. Geoinf. 8, 279–286. doi: 10.1016/j.jag.2017.12.017
Haug G. H., Hughen K. A., Sigman D. M., Peterson L. C., Rohl U. (2001). Southward migration of the intertropical convergence zone through the Holocene. Sci. 293, 1304–1308. doi: 10.1126/science.1059725
Hirabayashi Y., Mahendran R., Koirala S., Konoshima L., Yamazaki D., Watanabe S., et al. (2013). Global flood risk under climate change. Nat. Clim. Change 3, 816–821. doi: 10.1038/nclimate1911
Huang J. J. S., Wei K. Y., Löwemark L., Song S. R., Chuang C. K., Yang T. N., et al. (2019). What caused the cultural hiatus in the Iron-Age Kiwulan Site, northeastern Taiwan? Quat. Int. 514, 186–194. doi: 10.1016/j.quaint.2018.07.005
Huang Y. G., Yang H. F., Wang Y. P., Jia J. J., Wang Z. H., Zhu Q., et al. (2022). Swell-driven sediment resuspension in the Yangtze Estuary during tropical cyclone events. Estuar. Coast. Shelf Sci. 267, 107765. doi: 10.1016/j.ecss.2022.107765
Huntley D. J., Godfrey-Smith D. I., Thewalt M. L. (1985). Optical dating of sediments. Nature. 313, 105–107. doi: 10.1038/313105a0
Klein G. de V. (1985). “Intertidal flats and intertidal sand bodies,” in Coastal sedimentary environments, 2nd ed. Ed. Davis R. A. (Springer-Verlag, New York), 187–224.
Kuleshov Y., McGree S., Jones D., Charles A., Cottrill A., Prakash B., et al. (2014). Extreme weather and climate events and their impacts on island countries in the Western Pacific: cyclones, floods and droughts. Atmos. Clim. Sci. 4, 803–818. doi: 10.4236/acs.2014.45071
Lai Z. P., Zhang W. G., Chen X., Jia Y. L., Liu X. J., Fan Q. S., et al. (2010). OSL chronology of loess deposits in East China and its implications for East Asian monsoon history. Quat. Geochronol. 5, 154–158. doi: 10.1016/j.quageo.2009.02.006
Li C. X., Wang P. X. (1998). Late quaternary stratigraphy research in the Yangtze River Estuary (Beijing: Science Press).
Li Z. H., Jia J. J., Wu Y. S., Zong H. B., Zhang G. A., Wang Y. P., et al. (2019). Vertical distributions of suspended sediment concentrations in the turbidity maximum zone of the periodically and partially stratified Changjiang Estuary. Estuaries Coast. 42, 1475–1490. doi: 10.1007/s12237-019-00605-2
Liu C. S., Yao B. H., Zhang Z. S., Huo E. J. (2010). The history of natural disasters in Shanghai (Tongji university press).
Lu J., Li A., Zhang J., Dong J. (2023). Sedimentary record off the Yangtze River estuary and its response to typhoons and human activities over the past 70 years. Reg. Stud. Mar. Sci. 65, 103074. doi: 10.1016/j.rsma.2023.103074
Luo W., Shen F., He Q., Cao F., Zhao H., Li M. (2022). Changes in suspended sediments in the Yangtze River Estuary from 1984 to 2020: Responses to basin and estuarine engineering constructions. Sci. Total Environ. 805, 150381. doi: 10.1016/j.scitotenv.2021.150381
McManus D. A. (1963). A criticism of certain usage of the Phi-Notation. J. Sediment. Petrol. 33, 670–674. doi: 10.1306/74D70EED-2B21-11D7-8648000102C1865D
McManus J. (1988). “Grain size determination and interpretation,” Techniques in Sedimentology (Oxford: Blackwell), 63–85.
Meiler S., Ciullo A., Kropf C. M., Emanuel K., Bresch D. N. (2023). Uncertainties and sensitivities in the quantification of future tropical cyclone risk. Commun. Earth Environ. 4, 371. doi: 10.1038/s43247-023-00998-w
Ministry of water resources, Changjiang Water Resources Commission (2021). Yangtze River sediment bulletin (Changjiang Press).
Morton R. A., Gelfenbaum G., Jaffe B. E. (2007). Physical criteria for distinguishing sandy tsunami and storm deposits using modern examples. Sed. Geol. 200, 184–207. doi: 10.1016/j.sedgeo.2007.01.003
Muller J., Ercolani C., Collins J., Ellis S. (2022). Multi-proxy characterization of storm deposits on Sanibel Island, Florida: A modern analog for paleotempestology. Geomorphology. 402, 108148. doi: 10.1016/j.geomorph.2022.108148
Murakami H., Wang B. (2022). Patterns and frequency of projected future tropical cyclone genesis are governed by dynamic effects. Commun. Earth Environ. 3, 77. doi: 10.1038/s43247-022-00410-z
Nian X. M., Zhang W. G., Qiu F. Y., Qin J. T., Wang Z. H., Sun Q. L., et al. (2019). Luminescence characteristics of quartz from Holocene delta deposits of the Yangtze River and their provenance implications. Quat. Geochronol. 49, 131–137. doi: 10.1016/j.quageo.2018.04.010
Nian X., Zhang W., Wang X., Hutchinson S. M., Zhao X., Liu K. B. (2022). Multi-centennial variability of Yangtze Delta growth over the last 2000 years: interplay of climate and people. Earth’s Future 10, e2021EF002461. doi: 10.1029/2021EF002461
Nian X. M., Zhang W. G., Wang Z. H., Sun Q. L., Chen Z. Y. (2021). Inter-comparison of optically stimulated luminescence (OSL) ages between different fractions of Holocene deposits from the Yangtze delta and its environmental implications. Mar. Geol. 432, 106401. doi: 10.1016/j.margeo.2020.106401
Nian X. M., Zhang W. G., Wang Z. H., Sun Q. L., Chen J., Chen Z. Y. (2018). Optical dating of Holocene sediments from the Yangtze River (Changjiang) delta, China. Quat. Int. 467, 251–263. doi: 10.1016/j.quaint.2018.01.011
Obodoefuna D. C., Fan D. D., Guo X. J., Li B. (2020). Highly accelerated siltation of abandoned distributary channel in the Yangtze Delta under everchanging social-ecological dynamics. Mar. Geol. 429, 106331. doi: 10.1016/j.margeo.2020.106331
Peters R., Jaffe B. (2010). Identification of tsunami deposits in the geologic record; developing criteria using recent tsunami deposits. U. S. Geological Survey Open-File Report 2010-1239.
Rapuc W., Sabatier P., Arnaud F., Palumbo A., Develle A. L., Reyss J. L., et al. (2019). Holocene-long record of flood frequency in the Southern Alps (Lake Iseo, Italy) under human and climate forcing. Glob. Planet. Change. 175, 160–172. doi: 10.1016/j.gloplacha.2019.02.010
Reineck H. E., Singh I. B. (1980). Depositional sedimentary environments. 2nd ed. (Berlin: Springer-Verlag), 549. doi: 10.1007/978-3-642-81498-3
Rentschler J., Avner P., Marconcini M., Su R., Strano E., Vousdoukas M., et al. (2023). Global evidence of rapid urban growth in flood zones since 1985. Nature. 622, 87–92. doi: 10.1038/s41586-023-06468-9
Schröter K., Barendrecht M., Bertola M., Ciullo A., da Costa R. T., Cumiskey L., et al. (2021). Large-scale flood risk assessment and management: Prospects of a systems approach. Water Secur. 14, 100109. doi: 10.1016/j.wasec.2021.100109
Seki A., Tada R., Kurokawa S., Murayama M. (2019). High-resolution quaternary record of marine organic carbon content in the hemipelagic sediments of the Japan Sea from bromine counts measured by XRF core scanner. Prog. Earth Planet. Sci. 6, 1–12. doi: 10.1186/s40645-018-0244-z
Shan X., Yin J., Wang J. (2022). Risk assessment of shanghai extreme flooding under the land use change scenario. Nat. Hazards. 110, 1039–1060. doi: 10.1007/s11069-021-04978-1
Song S., Bellerby R., Liu J., Guo W., Yu P., Ge J., et al. (2023). Impacts of an extreme Changjiang flood on variations in carbon cycle components in the Changjiang Estuary and adjacent East China sea. Cont. Shelf Res. 269, 105137. doi: 10.1016/j.csr.2023.105137
Sun Q., Fang J., Dang X., Xu K., Fang Y., Li X., et al. (2022). Multi-scenario urban flood risk assessment by integrating future land use change models and hydrodynamic models. Nat. Hazards Earth Syst. Sci. 22, 3815–3829. doi: 10.5194/nhess-22-3815-2022
Swindles G. T., Galloway J. M., Macumber A. L., Croudace I. W., Emery A. R., Woulds C., et al. (2018). Sedimentary records of coastal storm surges: Evidence of the 1953 North Sea event. Mar. Geol. 403, 262–270. doi: 10.1016/j.margeo.2018.06.013
Szcześniak M., Kokociński M., Jagodziński R., Pleskot K., Zajączkowski M., Szczuciński W. (2023). Late Holocene Vistula River floods recorded in grain size distributions and diatom assemblages of marine sediments of the Gulf of Gdańsk (Baltic Sea). Palaeogeogr. Palaeoclimatol. Palaeoecol. 617, 111499. doi: 10.1016/j.palaeo.2023.111499
Tessler Z. D., Vörösmarty C. J., Grossberg M., Gladkova I., Aizenman H., Syvitski J. P., et al. (2015). Profiling risk and sustainability in coastal deltas of the world. Science. 349, 638–643. doi: 10.1126/science.aab3574
Tian Y., Fan D., Zhang X., Chen B., Wang L., Liu M., et al. (2019). Event deposits of intense typhoons in the muddy wedge of the East China Sea over the past 150 years. Mar. Geol. 410, 109–121. doi: 10.1016/j.margeo.2018.12.010
Vousdoukas M. I., Mentaschi L., Voukouvalas E., Verlaan M., Jevrejeva S., Jackson L. P., et al. (2018). Global probabilistic projections of extreme sea levels show intensification of coastal flood hazard. Nat. Commun. 9, 2360. doi: 10.1038/s41467-018-04692-w
Wang H., Li H., Si J., Zhang L., Sun Z. (2019). Geochemical features of the pseudotachylytes in the Longmen Shan thrust belt, eastern Tibet. Quat. Int. 514, 173–185. doi: 10.1016/j.quaint.2018.12.030
Wang H., Xu D., Zhang D., Pu Y., Luan Z. (2022). Shoreline dynamics of Chongming Island and driving factor analysis based on landsat images. Remote Sens. 14, 3305. doi: 10.3390/rs14143305
Wang M., Zheng H., Xie X., Fan D., Yang S., Zhao Q., et al. (2011). A 600-year flood history in the Yangtze River drainage: comparison between a subaqueous delta and historical records. Chin. Sci. Bull. 56, 188–195. doi: 10.1007/s11434-010-4212-2
Webster P. J., Holland G. J., Curry J. A., Chang H. R. (2005). Changes in tropical cyclone number, duration, and intensity in a warming environment. Science. 309, 1844–1846. doi: 10.1126/science.1116448
Wen K. G., Xu Y. M. (2006). The encyclopedia of meteorological disasters in China: Shanghai Volume (Beijing: China meteorological Press).
Woodruff J. D., Donnelly J. P., Okusu A. (2009). Exploring typhoon variability over the mid-to-late Holocene: evidence of extreme coastal flooding from Kamikoshiki, Japan. Quat. Sci. Rev. 28, 1774–1785. doi: 10.1016/j.quascirev.2009.02.005
Wu S., Chen R., Meadows M. E. (2019). Evolution of an estuarine Island in the anthropocene: complex dynamics of Chongming Island, Shanghai, PR China. Sustain. 11, 6921. doi: 10.3390/su11246921
Wu W., Yang Z., Zhang X., Zhou Y., Tian B., Tang Q. (2021). Integrated modeling analysis of estuarine responses to extreme hydrological events and sea-level rise. Estuar. Coast. Shelf Sci. 261, 107555. doi: 10.1016/j.ecss.2021.107555
Xu C., Yang Y., Zhang F., Li R., Li Z., Wang Y. P., et al. (2022). Spatial-temporal distribution of tropical cyclone activity on the eastern sea area of China since the late 1940s. Estuar. Coast. Shelf Sci. 277, 108067. doi: 10.1016/j.ecss.2022.108067
Xue C., Yang Y., Zhao P., Wei D., Gao J., Sun P., et al. (2021). Impact of ship traffic on the characteristics of shelf sediments an anthropocene prospective. Front. Mar. Sci. 8, 678845. doi: 10.3389/fmars.2021.678845
Yan D., Wünnemann B., Gao S., Zhang Y. (2020). Early Holocene tidal flat evolution in a western embayment of East China Sea, in response to sea level rise episodes. Quat. Sci. Rev. 250, 106642. doi: 10.1016/j.quascirev.2020.106642
Yan Q. S., Xu S. Y. (1987). Modern sedimentation research in the Yangtze River Delta (East China Normal University Press).
Yang S., Luo X., Temmerman S., Kirwan M., Bouma T., Xu K., et al. (2020b). Role of delta-front erosion in sustaining salt marshes under sea-level rise and fluvial sediment decline. Limnol. Oceanogr. 65, 1990–2009. doi: 10.1002/lno.11432
Yang Y., Maselli V., Normandeau A., Piper D. J., Li M. Z., Campbell D. C., et al. (2020a). Latitudinal response of storm activity to abrupt climate change during the last 6,500 years. Geophys. Res. Lett. 47, e2020GL089859. doi: 10.1029/2020GL089859
Yang Y., Piper D. J., Normandeau A., Zhou L., Jia J., Wang Y. P., et al. (2022a). A late Holocene shift of typhoon activity recorded by coastal sedimentary archives in eastern China. Sedimentology. 69, 954–969. doi: 10.1111/sed.12934
Yang J. S., Wang Y., Yin J. H., Liu Z., Jiang G. L., Zhang P., et al. (2022b). Progress and prospects in the reconstruction of flood events in Chinese alluvial plains. Earth Sci. 47, 3944–3959. doi: 10.3799/dqkx.2022.192
Yang H. F., Yang S. L., Li B. C., Wang Y. P., Wang J. Z., Zhang Z. L., et al. (2021). Different fates of the Yangtze and Mississippi deltaic wetlands under similar riverine sediment decline and sea-level rise. Geomorphology. 381, 107646. doi: 10.1016/j.geomorph.2021.107646
Yang S. L., Zhu J., Zhao Q. Y., Mao Z. C. (2000). Tidal flat morphodynamic processes of the Yangtze Estuary and their engineering implications. China Ocean Eng. 3), 307–320. doi: CNKI:SUN:CHIU.0.2000-03-004
Zhang X., Xiao X., Wang X., Xu X., Chen B., Wang J., et al. (2020). Quantifying expansion and removal of Spartina alterniflora on Chongming island, China, using time series Landsat images during 1995-2018. Remote Sens. Environ. 247, 111916. doi: 10.1016/j.rse.2020.111916
Zhao H., Liu Z., Zhao Y., Wu J., Colin C. (2023). Lunar nodal tidal cycle influences on the input of coarse sediments during the last glaciation in the deep South China Sea. Quat. Sci. Rev. 310, 108114. doi: 10.1016/j.quascirev.2023.108114
Zhao Y., Zou X., Gao J., Wang C. (2016). Recent sedimentary record of storms and floods within the estuarine-inner shelf region of the East China Sea. Holocene. 27, 439–449. doi: 10.1177/0959683616660165
Keywords: typhoon, river flooding, tracing fingerprints, sedimentary records, estuarine island deposits
Citation: Zhao P, Yang Y, Jia J, Zhao N, Zhang W and Gao S (2024) Typhoon and flooding occurrences on Chongming Island, Changjiang Estuary, as revealed by a newly acquired sedimentary record. Front. Mar. Sci. 11:1366676. doi: 10.3389/fmars.2024.1366676
Received: 07 January 2024; Accepted: 23 April 2024;
Published: 08 May 2024.
Edited by:
Paolo Ciavola, University of Ferrara, ItalyCopyright © 2024 Zhao, Yang, Jia, Zhao, Zhang and Gao. This is an open-access article distributed under the terms of the Creative Commons Attribution License (CC BY). The use, distribution or reproduction in other forums is permitted, provided the original author(s) and the copyright owner(s) are credited and that the original publication in this journal is cited, in accordance with accepted academic practice. No use, distribution or reproduction is permitted which does not comply with these terms.
*Correspondence: Shu Gao, shugao@nju.edu.cn; Yang Yang, yyang@njnu.edu.cn