Spatial distribution and environmental/biological co-regulation mechanism of dimethyl sulfur compounds in the eastern Indian Ocean
 Liying Peng
 Chenjuan Fan1†
  Xingzhou Wang
 Guicheng Zhang
 Jun Sun
- 1Research Centre for Indian Ocean Ecosystem, Tianjin University of Science and Technology, Tianjin, China
- 2State Key Laboratory of Biogeology and Environmental Geology, China University of Geosciences (Wuhan), Wuhan, China
- 3College of Marine Science and Technology, China University of Geosciences (Wuhan), Wuhan, China
Dimethyl sulfur compounds including dimethylsulfoniopropionate (DMSP), dimethyl sulfide (DMS), and dimethyl sulfoxide (DMSO), play a crucial part in global sulfur cycling. The eastern Indian Ocean (EIO), characterized by its remarkable diversity of biomes and climate dynamics, is integral to global climate regulation. However, the regulation mechanism of DMS (P, O) in the EIO remains to be elucidated in detail. This paper presented a field survey aimed at investigating the spatial distribution of DMS (P, O) and their relationships with environmental and biological factors in the EIO. The surface concentrations of DMS, DMSPt, and DMSOt varied from 0.07 to 7.37 nmol/L, 0.14 to 9.17 nmol/L, and 0.15 to 3.32 nmol/L, respectively, and their distributions are attributed to high Chl-a concentration near Sri Lanka and the influence of ocean currents (Wyrtki jets, Bay of Bengal runoff). Higher concentrations of DMS (P) and DMSOt were predominantly observed in water columns shallower than 75m and deeper than 75m deep, respectively. The monthly DMS fluxes in the study area peaked in August. Temperature and Dissolved Silica Index (DSI) were the key environmental determinants for DMS distribution, while nitrate (NO3-) was the primary factor for both DMSPt and DMSOt. In terms of biological factors, Prochlorococcus and Synechococcus were significant contributors to DMS (P, O) dynamics. Synechococcus was the dominant influence on the DMS source and DMSPt sink, whereas Prochlorococcus primarily consumed DMSOt. Furthermore, the structural equation modeling (SEM) revealed the relationship between DMS, DMSPt, DMSOt, and the key environmental/biological factors, as well as among them, and together they formed a co-regulatory network in the EIO. This contributes significantly to the advancement of global ecosystem models for DMS (P, O).
1 Introduction
Dimethyl sulfur compounds (DSCs) are sulfur-containing organic molecules produced by certain phytoplankton species, macroalgae, and angiosperms (Keller et al., 1989; Hatton and Wilson, 2007; Borges and Champenois, 2017). Dimethyl sulfide (DMS) constitutes approximately 40% of sulfur emissions (Wang et al., 2015) and potentially affects climate by forming cloud condensation nuclei (CCN) (Charlson et al., 1987). Nonetheless, the DMS feedback hypothesis continues to be a subject of debate (Quinn and Bates, 2011). Dimethylsulfoniopropionate (DMSP), an amphoteric compound predominantly found in cellular granular form, is the primary DMS precursor and serves various functions, including acting as an antioxidant (Sunda et al., 2002), cryoprotectant (Kirst et al., 1991), osmoregulatory (Vairavamurthy et al., 1985), grazing deterrent (Wolfe et al., 1997), and excess sulfur sinks (Zhang et al., 2019). Similarly, dimethyl sulfoxide (DMSO) shares some functions with DMSP but is notable for its significant membrane permeability (Hatton and Wilson, 2007). Both DMSP and DMSO can be converted to DMS by phytoplankton and bacteria upon release into the water through exudation, cell lysis, grazing, or viral attack (Stefels et al., 2007). Conversely, DMS can be oxidized to DMSO through chemical and photochemical processes (Brimblecombe and Shooter, 1986; Chen et al., 2011; Lidbury et al., 2016). The recent uncovering of the DMSP to DMSO oxidation process is noteworthy (Thume et al., 2018). Given the physiological and ecological significance of DMS (P, O), a comprehensive understanding of the sources and spatial variability of dimethyl sulfur compounds is imperative for global sulfur cycle research.
Over the past three decades, the biogeochemical cycle of dimethyl sulfur compounds has been extensively studied not only in Chinese sea areas but also in open ocean regions. For example, studies in the Yellow Sea and Bohai Sea by Guo et al. (2022) and Yang et al. (2014) revealed higher summer concentrations of DMS and DMSP compared to autumn, attributed to variations in the phytoplankton community, with dinoflagellates and diatoms predominating in summer and autumn, respectively. In the East China Sea, Li et al. (2015) found that the distributions of DMS, DMSP, and DMSO paralleled that of chlorophyll a (Chl-a), with elevated levels in coastal regions and lower levels in open sea areas, suggesting a significant role of phytoplankton biomass in controlling these sulfur compound concentrations. This conclusion was also supported by a study in the northern South China Sea (Zhai et al., 2020). Additionally, Zhang et al. (2014) noted that DMS (P, O) distributions were mainly influenced by the Yangtze River effluent and various oceanic circulations in the South Yellow Sea and East China Sea. In the Changjiang River Estuary and the coastal East China Sea, phytoplankton biomass and water mass mixing were identified as major factors influencing the distribution of dimethyl sulfur compounds (Jian et al., 2019). And Lee et al. (2010) discovered that the peak concentrations of DMS and DMSP occurred at depths of 40 m and 60-80 m, respectively, aligning with the Chl-a maximum depth range in the South Pacific Ocean. Research in the Belgian coastal zone of the North Sea by Speeckaert et al. (2018) linked seasonal variations of these compounds to phytoplankton succession, with high DMS (P, O) producers, mainly Phaeocystis globose, appearing in spring, and low DMS (P, O) producers, various diatoms species, in early spring and autumn. All these studies indicated that phytoplankton community structure was the main factor affecting DMS (P, O) concentration.
However, it was found that in addition to phytoplankton (mainly dinoflagellates, diatoms, and haptophytes), picophytoplankton, and bacteria also had important effects on DMSP concentration in some studies focusing on open oceans. Studies by Bürgermeister et al. (1990) and Merzouk et al. (2008) in the Atlantic Ocean and Zindler et al. (2013) in the Western Pacific Ocean provided insights into the influence of diatoms and bacterioplankton, respectively, on DMS concentration. Zindler et al. (2013) also emphasized the dominance of nano- and picoplankton in the western Pacific Ocean, highlighting the importance of picophytoplankton in oligotrophic marine sulfur cycling. Both heterotrophic bacteria and picophytoplankton were found to assimilate DMSP (Vila-Costa et al., 2006). In the northwest Atlantic Ocean and the Gulf of Mexico, Malmstrom et al. (2005) demonstrated the significant role of Synechococcus in the DMSP flux, with higher per-cell DMSP assimilation in Synechococcus than in other prokaryotes, especially under full sunlight conditions (Ruiz-Gonzalez et al., 2012). Some Synechococcus species, like Synechococcus elongatus, were found to lyse DMSP to produce DMS but did not assimilate DMS (Malmstrom et al., 2005).
Therefore, to accurately evaluate the contributions of marine microorganisms on DMS (P, O) concentration, it is necessary to comprehensively consider the co-regulation mechanism of phytoplankton, and bacteria on DMS (P, O). The Indian Ocean heat content has increased abruptly, due to water and heat exchange with the Pacific Ocean (Lee et al., 2015; Desbruyères et al., 2017). It provides opportunities for sulfur cycling research. Hatton et al. (1999) observed that three weeks after the end of the summer monsoon, the average concentration of dimethyl sulfide compounds in the Arabian Sea’s eutrophic region was almost twice those in oligotrophic regions. In the 2001 summer monsoon, Shenoy et al. (2006) measured DMS and DMSPt concentrations in the Bay of Bengal from 6° N to 20° N, finding both confined to the upper 40 m of the water column, with diatoms as the primary contributors. Shenoy and Kumar (2007) investigated DMS variability in the Indian Ocean, noting the highest average surface DMS in the Arabian Sea and the highest average flux in the Bay of Bengal. O’Brien et al. (2022) explored DMSPd surface distribution along the 110°E transect, discovering a high concentration of DMSPd in ultra-oligotrophic low-latitude waters, contrasting with nutrient-rich high-latitude waters. Although significant latitudinal variations in DMSP production and cleavage genes were reported, those of DMS and DMSO remain unexplored. It is not difficult to find that previous studies mainly focused on the effects of environmental factors, phytoplankton (mainly dinoflagellates, diatoms, and haptophytes), and latitude on DMS (P, O) in the eastern Indian Ocean (EIO), with the picophytoplankton being neglected. The role of picophytoplankton in the EIO is particularly crucial, with average Chl-a concentrations of picophytoplankton accounting for over 49.6% of total Chl-a (Wei et al., 2019). Their impact might be overestimated if only bacteria and phytoplankton (mainly dinoflagellates, diatoms, and haptophytes) contributions to DMS (P, O) are considered. Therefore, a more precise characterization of microorganisms’ (phytoplankton, bacteria) contributions to DMS (P, O) concentration in the EIO is essential. This study presents a field survey to ascertain the spatial distribution characteristics of DMS (P, O) in the EIO, assessing their interactions with environmental and biological factors using generalized additive models (GAMs) and structural equation modeling (SEM) to elucidate potential environmental and biological regulatory mechanisms of DMS (P, O). The findings aim to enhance understanding of the biogeochemical cycle of dimethyl sulfur compounds in the EIO.
2 Materials and methods
2.1 Study area and sample collection
The cruise took place from October to November 2020, encompassing field surveys at a total of 19 stations in the EIO, as shown in Figure 1. SA section is situated along the equator, while the SB section is located at the region perpendicular to the equator. By using conductivity-temperature-depth (CTD) sensors (Sea-Bird Electronics Inc., Bellevue, USA) equipped with 1L Niskin bottles, seawater samples in 7 depths (generally in 5, 25, 50, 75, 100, 150, and 200 m) were collected. Temperature and salinity data were obtained from the seabird CTD sensor. 40 mL seawater for DMS was gathered from CTD slowly into an amber glass via an acid-cleaned Tygon tubing. 25 mL seawater for DMSPt and DMSOt was pretreated with 100 μL 50% sulfuric acid and 100 μL 25% hydrochloric acid, respectively, as well as 25 mL seawater filtered by gravitational pressure was collected for DMSPd and DMSOd analysis, and then severally treated with sulfuric acid and hydrochloric acid (Zhai et al., 2018). All DSC samples were sealed and stored in the dark at 4°C and analyzed immediately following their transportation to the lab. The seawater samples of Chl‐a and nutrients were filtered through Whatman GF/F glass fiber membranes (25 mm diameter, 0.7 μm) and immediately stored at -20°C until they were measured. Phytoplankton samples were loaded in 1L polyethylene bottles, fixed with 3% formaldehyde solution, and placed in shade.
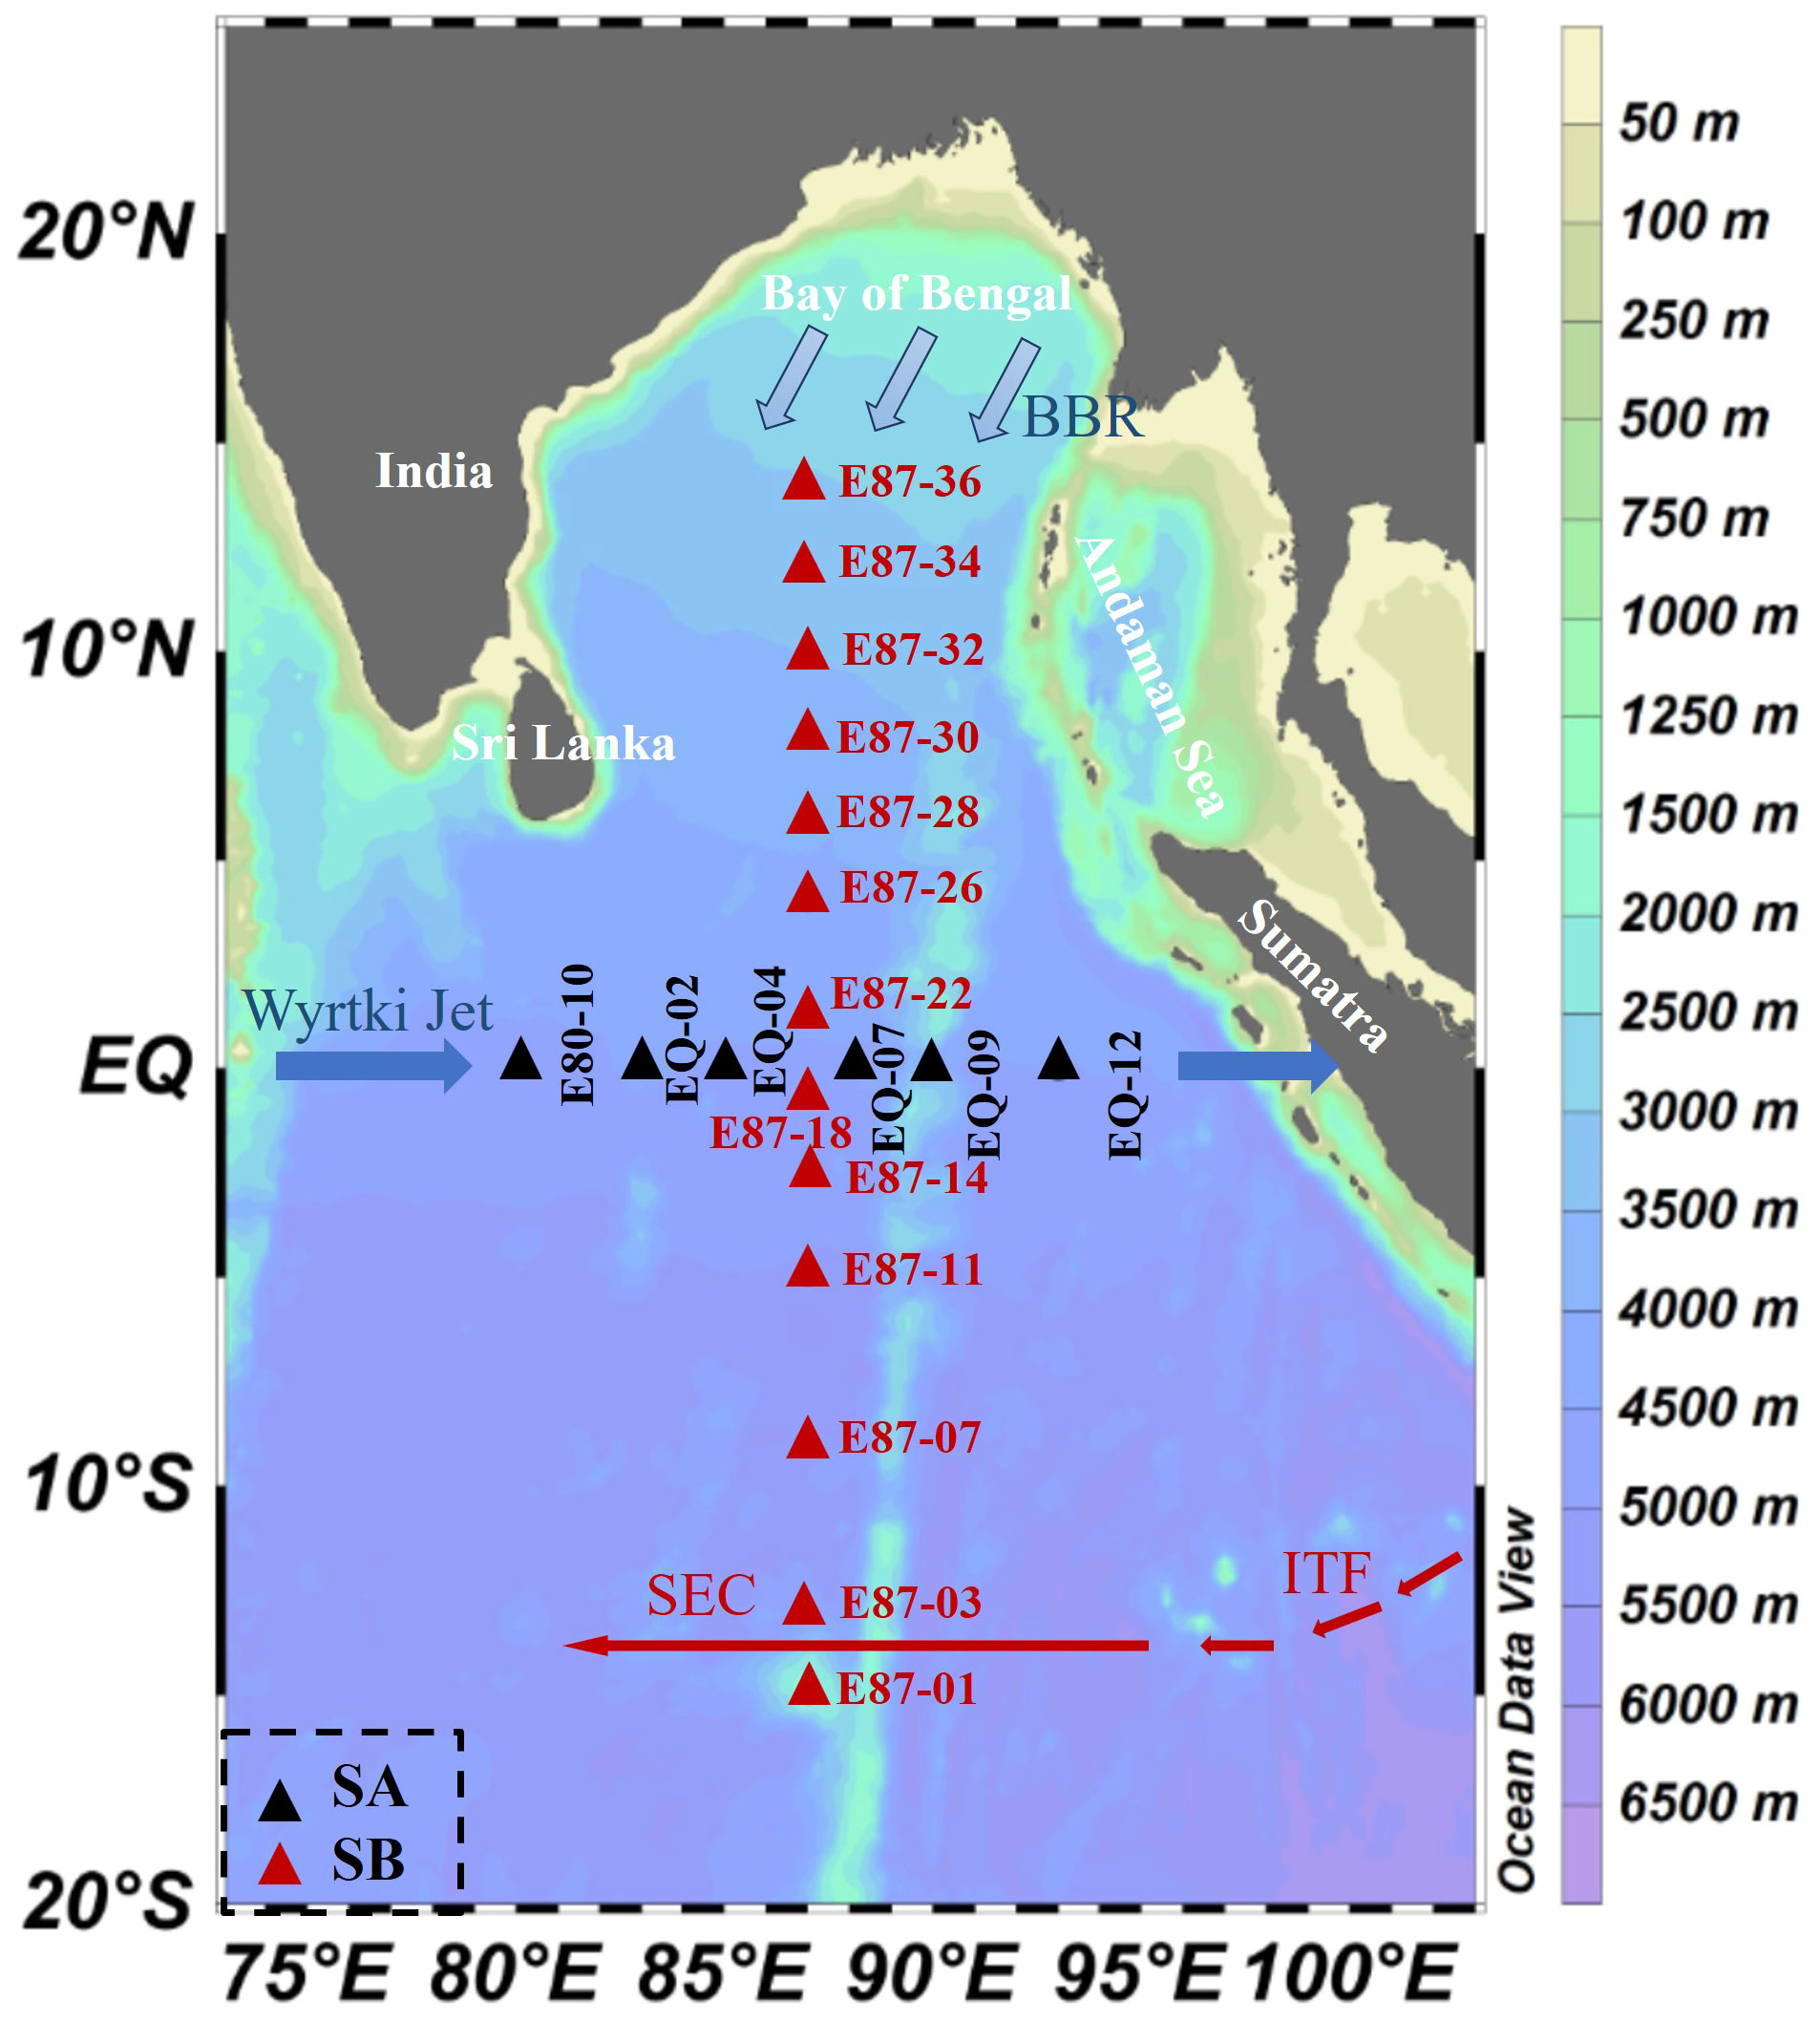
Figure 1 Map representing sampling locations and major ocean currents over the eastern Indian Ocean (EIO) from October to November 2020. The current systems include the Bay of Bengal runoff (BBR), Equatorial Jets (Wyrtki jets), South Equatorial Current (SEC), and Indonesian Through Flow (ITF). The red arrow indicates the prevailing circulation throughout the year, and the solid blue arrow indicates the Ejs (Wyrtki jets) occurring in spring and autumn. The thickness of the line indicates the corresponding circulation strength. Black triangles represent the SA section and red triangles represent the SB section (Peng et al., 2015; Wei et al., 2019; Guo et al., 2021; Liu et al., 2022; Ikhsani et al., 2023).
2.2 Analytical procedures
Samples of DMS, DMSP, and DMSO were determined using the established method based on ion mobility spectrometry (Peng et al., 2020, 2022). The concentration of DMS was measured via gas stripping, while those of DMSP and DMSO were obtained indirectly by measuring DMS content. The frozen DMSO and DMSP samples were restored to room temperature and then purged with zero air to remove any present DMS. 500 μL and 200 μL of KOH (10 mol/L) solution was added to the DMSPt and DMSPd seawater samples, respectively. Then the samples were sealed and placed in the dark at 4°C for 24 h to ensure the DMSP completely converted to detectable DMS (Yang et al., 2016). Subsequently, the concentrations of DMSPt and DMSPd were indirectly obtained by measuring the content of DMS, and the content of DMSPp could be calculated from their difference. The DMSO sample was treated with 200 μL of 20% TiCl3 solution, then sealed and placed in a constant temperature water bath at 55°C. After the complete reaction for 1 h, the DMSO in samples could be reduced to DMS and then determined (Kiene and Gerard, 1994). The DMSOp content could be defined as the difference between DMSOt and DMSOd.
According to the method of Hansen and Koroleff (1999), the nutrients in the seawater sample were determined via a Technicon AA3 autoanalyzer (Bran + Luebbe, Norderstedt, Germany). Silicates (DSI) could be determined by using the silicon-molybdenum blue method with a limit of detection (LOD) of 0.02 μmol/L (Isshiki et al., 1991). The concentrations of nitrate (NO3-) and ammonium (NH4+) were determined through the cadmium copper column reduction method with a LOD of 0.01 μmol/L (Wood et al., 1967) and the sodium salicylate method with a LOD of 0.03 μmol/L (Verdouw et al., 1978), respectively. The concentrations of phosphates (DIP) and nitrite (NO2-) were determined using the phosphomolybdenum blue method with a LOD of 0.02 μmol/L (Taguchi et al., 1985) and the naphthalene ethylenediamine method with a LOD of 0.01 μmol/L (Wang et al., 2022a), respectively.
The filter membrane of Chl-a was placed into a 10 mL brown glass tube and then extracted with 5 mL acetone with a volume fraction of 90% in the dark at 4°C for 24 h. The content of Chl-a was measured by Turner-Designs Trilogy fluorometer (Sunnyvale, CA, USA) (Welschmeyer, 1994). For phytoplankton analysis, 1L samples were concentrated in a 100 mL sedimentation column for 24 to 48 hours. The identification and counting of the phytoplankton cells were conducted by inverted microscope at 400× (or 200×). The methods of Yamaji (1984), Jin et al. (1965), and Sun et al. (2002) were used to determine the species of phytoplankton (Wang et al., 2022b). The abundances of picophytoplankton and bacteria were enumerated via a flow cytometer (FCM, Becton-Dickinson Accuri C6) equipped with a laser emitting at 488 nm (Sgorbati, 2007; Wei et al., 2019).
2.3 Statistical analyses
DMS (P, O) horizontal and vertical distributions were depicted using Ocean data view 4. The aggregated boosted tree (ABT) analysis was applied to quantify the impact of environmental and biological factors on the DMS (P, O) concentrations by the “gbmplus” package with 500 trees for boosting in R. Generalized additive models (GAMs) was adopted to fit relationship between response and explanatory variables by the R package “mgcv”. The structural equation model (SEM) was employed to reveal the causal relationship of DMS (P, O) and key factors. Only when Supplementary Figure S1 was plotted, missing data were imputed using linear interpolation according to the characteristics of the data.
3 Results
3.1 Horizontal distribution of DMS (P, O)
In the surface layer, concentrations of DMS, DMSPt, and DMSOt varied from 0.07 to 7.37 nmol/L, 0.14 to 9.17 nmol/L, and 0.15 to 3.32 nmol/L, respectively (Figures 2A–C). DMS and DMSPt showed similar distribution patterns, gradually increasing from 14°N to 6°N and then decreasing from 6°N to 14°S (Figures 2A, B). DMSOt, however, was primarily concentrated between 10°N to 5°S (Figure 2C). The highest concentration of DMS (6.56 nmol/L) and DMSPt (7.20 nmol/L) was observed at station EQ-07, while that of and for DMSOt at EQ-04 (3.06 nmol/L) and E87-18 (3.32 nmol/L) near the equator. This pattern was linked to the Wyrtki jets (WJs) within 2° of the Equator (Wang, 2017), which transported high DMS (P, O) surface seawater from west to east, resulting in higher concentrations from 85°E to 88°E (Wei et al., 2019). Perpendicular to the equator, the highest DMS and DMSPt values were 7.37 nmol/L and 9.71 nmol/L at station E87-28, respectively, correlating with high Chl-a concentrations near Sri Lanka (Figure 2D). These findings align with previous studies indicating a positive correlation between DMS, DMSP concentrations, and Chl-a in coastal regions (Zhang et al., 2014; Li et al., 2015; Zhai et al., 2020).
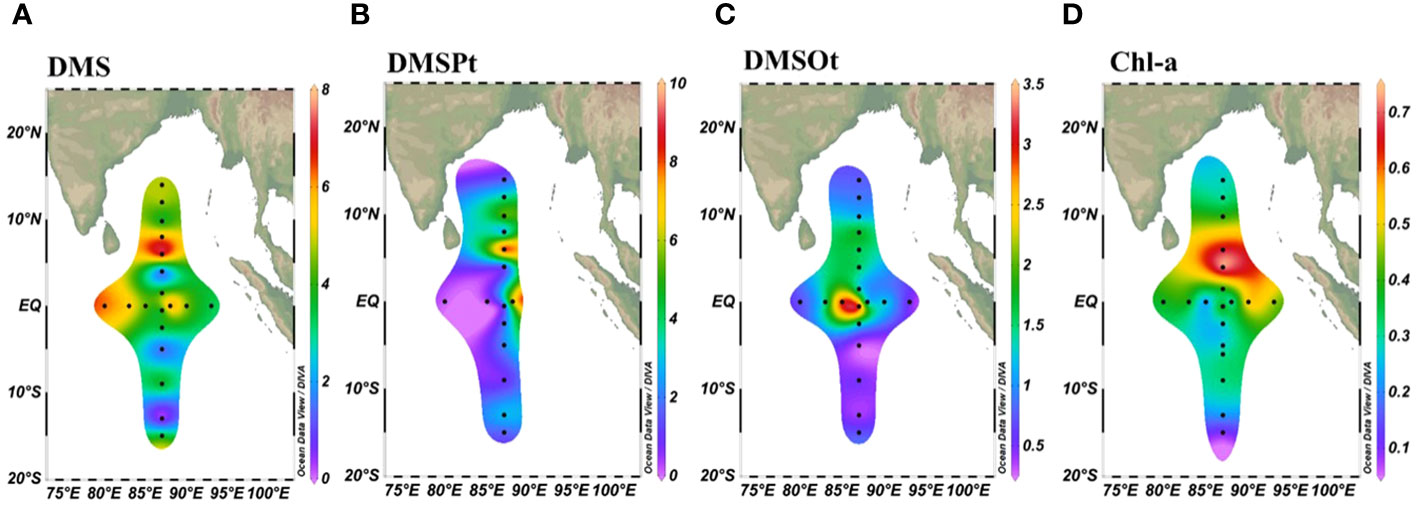
Figure 2 Spatial distribution of DMS (A), DMSPt (B), DMSOt (C), and Chl-a (D) at the sea surface (5m) in the EIO.
3.2 Vertical distribution of DMS (P, O)
3.2.1 Overall vertical variation
Figure 3 illustrates the depth-dependent variability of DMS (P, O) concentrations, consistent with findings in the Northern South China Sea (Zhai et al., 2020). Average values of DMS and DMSPt were higher at 5m, 25m, and 50m depths (Figures 3A, B), while the mean value of DMSOt was higher at 75m, 100m, and 150m depths (Figure 3C). Chl-a reached its maximum at 75m (Figure 3D), which did not coincide with the peaks of DMS and DMSPt. A notable shift in DMS (P, O) concentrations occurred at 75m: DMS and DMSPt concentrations decreased sharply beyond this depth, while DMSOt increased. Significantly differences in DMS and DMSP concentrations between 75m and 100m depths were identified, and for DMSPt between 50m and 75m, and DMSOt between 5m and 25m depths (Figures 3A–C). Based on these results, four distinct water layers were categorized: 5m (A), 25m, 50m (B), 75m (C), 100m, 150m, 200m (D). Subsequent correlation analysis between DMS (P, O) and environmental/biological factors was conducted for these layers (Supplementary Figure S1, detailed in 3.2.2). DMSPp was the major component of DMSPt from 5m to 75 m, significantly exceeding DMSPd concentrations (Figure 3E). DMSOt concentrations comprised nearly equal proportions of DMSOp and DMSOd, except at 50m and 75m depths where DMSOp was slightly higher (Figure 3F).
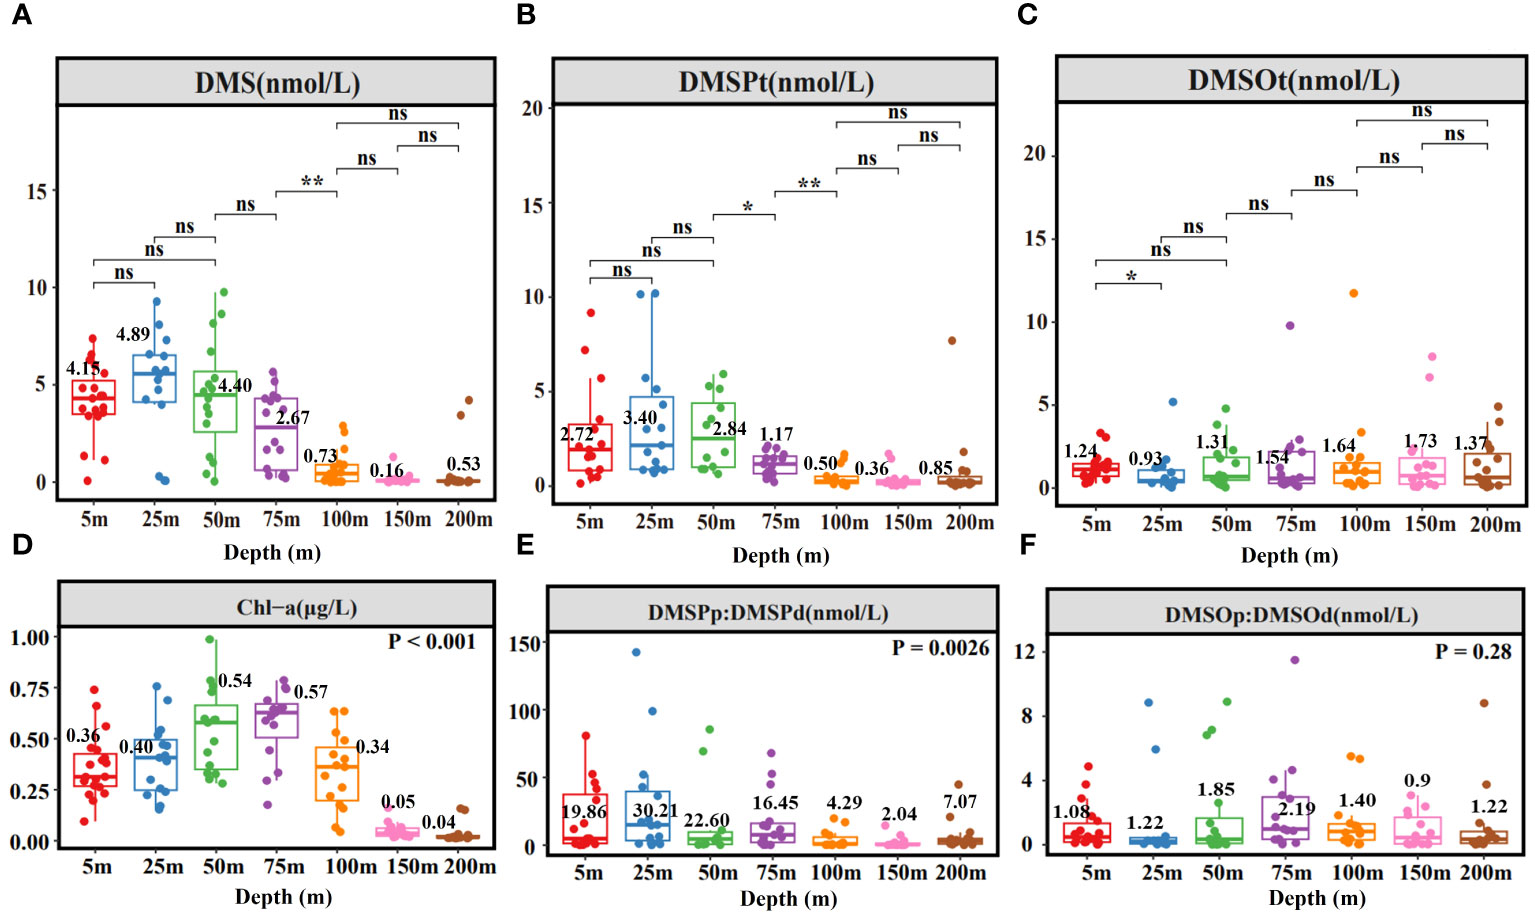
Figure 3 Depth box plot of DMS (A), DMSPt (B), DMSOt (C), Chl-a (D), DMSPp: DMSPd (E), DMSOp: DMSOd (F) in EIO. Numbers represent mean values. *, **, ns, indicate significance levels at p < 0.05, p < 0.01, and p > 0.05, respectively.
3.2.2 Section distribution
The SA and SB sections, influenced by the Wyrtki jets, Bay of Bengal runoff (BBR), and South Equatorial Current (SEC), were selected to study the impact of ocean currents on DMS (P, O) distribution. In the SA section, DMS and DMSPt concentrations were confined to depths shallower than 75 m and diminished rapidly beyond 100 m (Figures 4A, B). DMSOt was predominantly observed between 5-100 m depths from 87°E to 95°E and between 100-200m west of 80°E (Figure 4C). Notably, the highest DMS value (9.76 nmol/L) was recorded at 50 m depth at station E80-10, coinciding with a peak in bacterial concentration (Supplementary Figure S2). A significant correlation between DMS and bacteria at 50 m depth (Supplementary Figure S1) highlighted bacteria’s role in regulating DMS concentration. The highest DMSPt (10.15 nmol/L) was found at 25 m depth at station EQ-07, and DMSOt (9.79 nmol/L) at 75 m depth at station EQ-09 (Figures 4B, C), likely due to Wyrtki jets, and their distribution of higher concentration was not consistent with that of Chl-a (Figure 4D). In the SB section, DMS and DMSPt concentrations gradually decreased with depth, with peaks (9.27 nmol/L for DMS and 10.20 nmol/L for DMSPt) at 25 m depth at station E87-28 (Figures 4E, F). Significant correlations were noted between DMS, DMSPt, Prochlorococcus (Pro), and Synechococcus (Syn) at 25m depth (Supplementary Figure S1), suggesting their importance in influencing DMS and DMSPt concentrations. DMSOt distribution was more uniform, with concentrations increasing at depths beyond 75m, peaking (11.75 nmol/L) at 100 m depth at station E87-18 (Figure 4G). We observed slight increases in DMS and DMSPt at 200 m depth compared to those at 100m and 150m depths (Figures 4A, E, F). The phenomenon is possibly due to accumulation and sedimentation of suspended organic matter (Speeckaert et al., 2018). DMS (P, O) concentrations were generally higher north of the equator than south, influenced by BBR and SEC. Distinct factors impacted DMS (P, O) concentrations at different depths: at 25m and 50m, DMS concentration was linked to bacteria, while DMSPt and DMSOt correlated with picophytoplankton and temperature, respectively. From 75m to 200m, DMS was primarily associated with Chl-a, temperature, DIP, and DSI, whereas both DMSPt at 75m and DMSOt at 100-200m were related to Pro (Supplementary Figure S1).
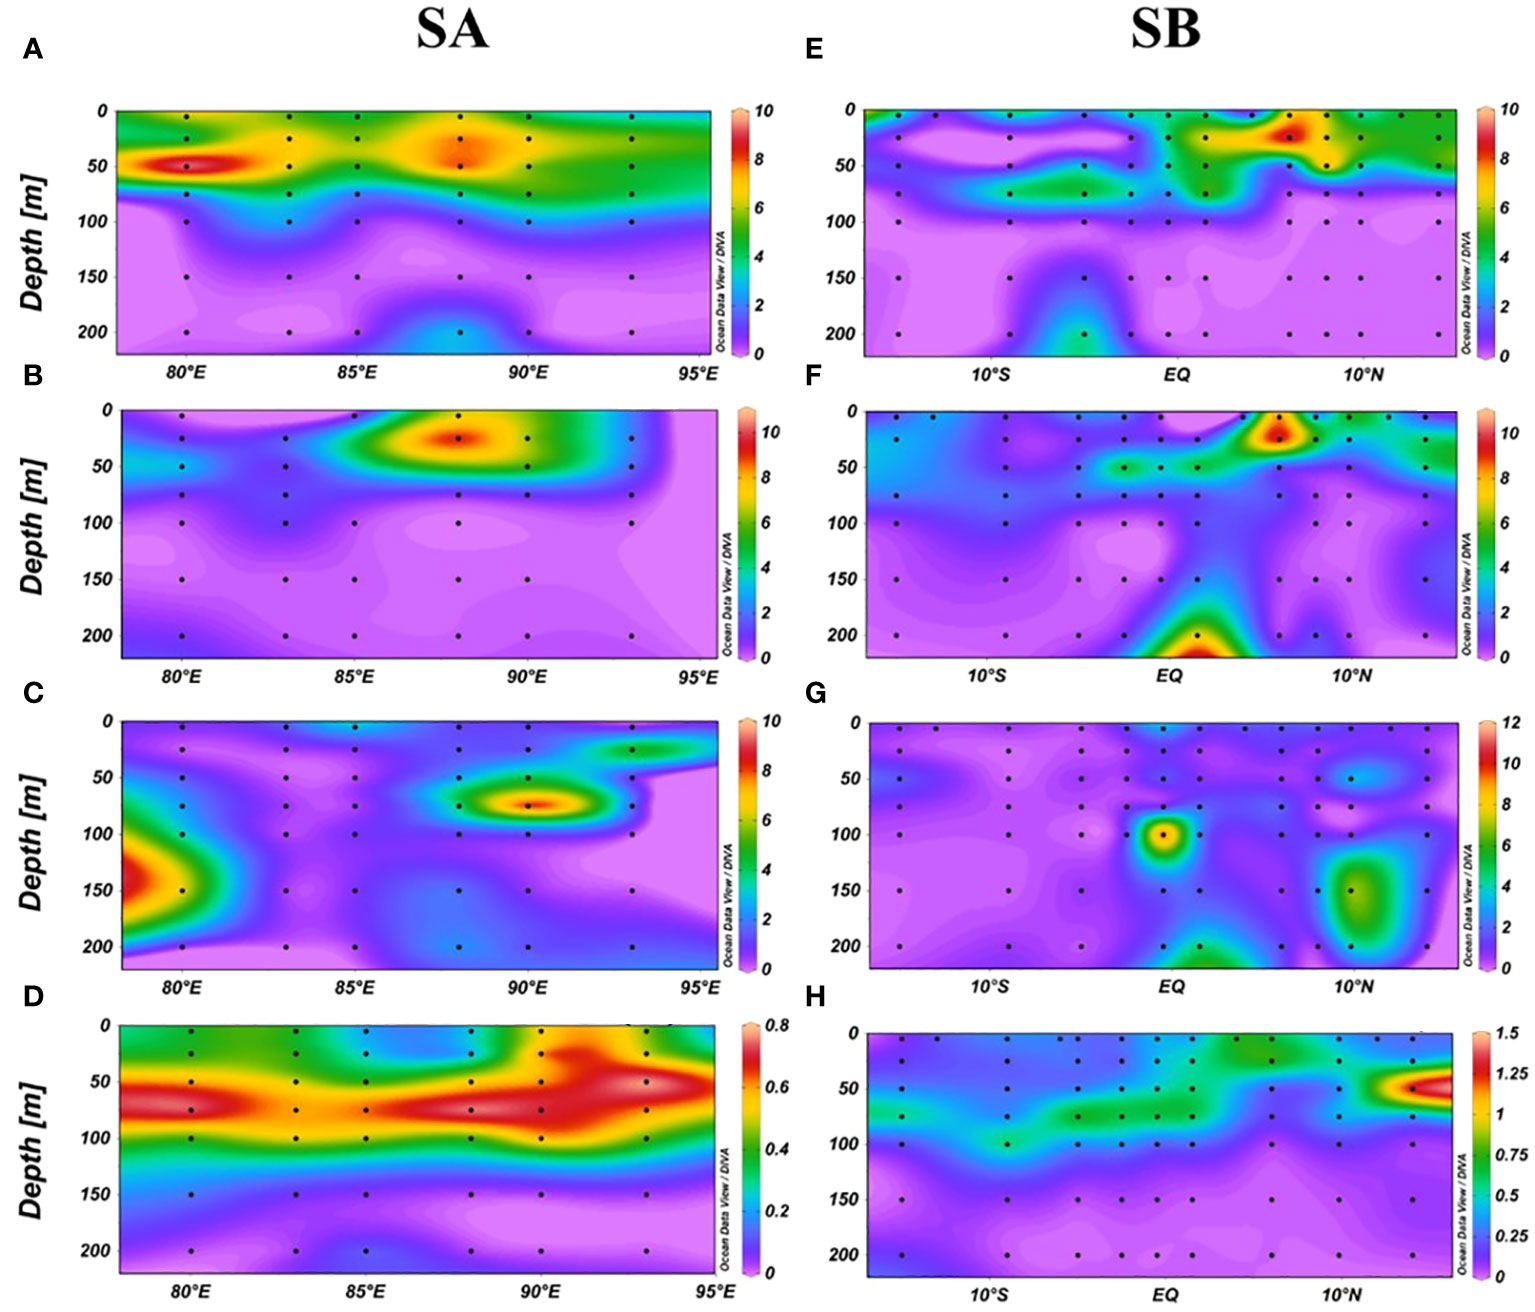
Figure 4 Vertical distribution of DMS (A), DMSPt (B), DMSOt (C), Chl-a (D) in the SA section, and DMS (E), DMSPt (F), DMSOt (G), Chl-a (H) in the SB section.
3.3 Sea-to-air fluxes of DMS
The sea-to-air exchange flux of DMS was estimated using the stagnant film model and relevant empirical equations (Saltzman et al., 1993; Nightingale et al., 2000). The fluxes ranged from 3.44 to 329.03 μmol m-2 d-1, with an average of 79.76 μmol m-2 d-1. The highest fluxes, 329.03 μmol m-2 d-1 at station E87-28 and 265.99 μmol m-2 d-1 at station E80-10 showed a general weakening trend from west to east and north to south, consistent with the surface DMS distribution (Figures 2A, 5A). DMS, temperature, and wind speed based on data collected between 1987 and 2001 of the eastern Indian Ocean (data retrieved from the DMS Database: https://saga.pmel.noaa.gov/dms/) were analyzed to determine if there was a transient change of DMS concentration and sea-to-air flux (Figures 5B, C). DMS concentration with no significant correlation to the sampling site (Figures 5D, E). While the sampling site’s impact was less pronounced for fluxes (Figures 5G, H), there was a peak in sea-to-air flux around 15°N -20°N (Figure 5G). Both DMS concentration and fluxes varied seasonally but with different trends, probably due to wind speed (Figures 5F, I). DMS concentration increased monotonically from June to November (Figure 5F). However, the fluxes increased from June to August and decreased from September to November (Figure 5I), which aligns with the previous study indicating DMS emissions elevated during the Central Indian Ocean summer (Hulswar et al., 2022). The monthly mean fluxes in these six years (1987, 1998, 1999, 2000, 2001, 2020) were shown in Supplementary Table S1.
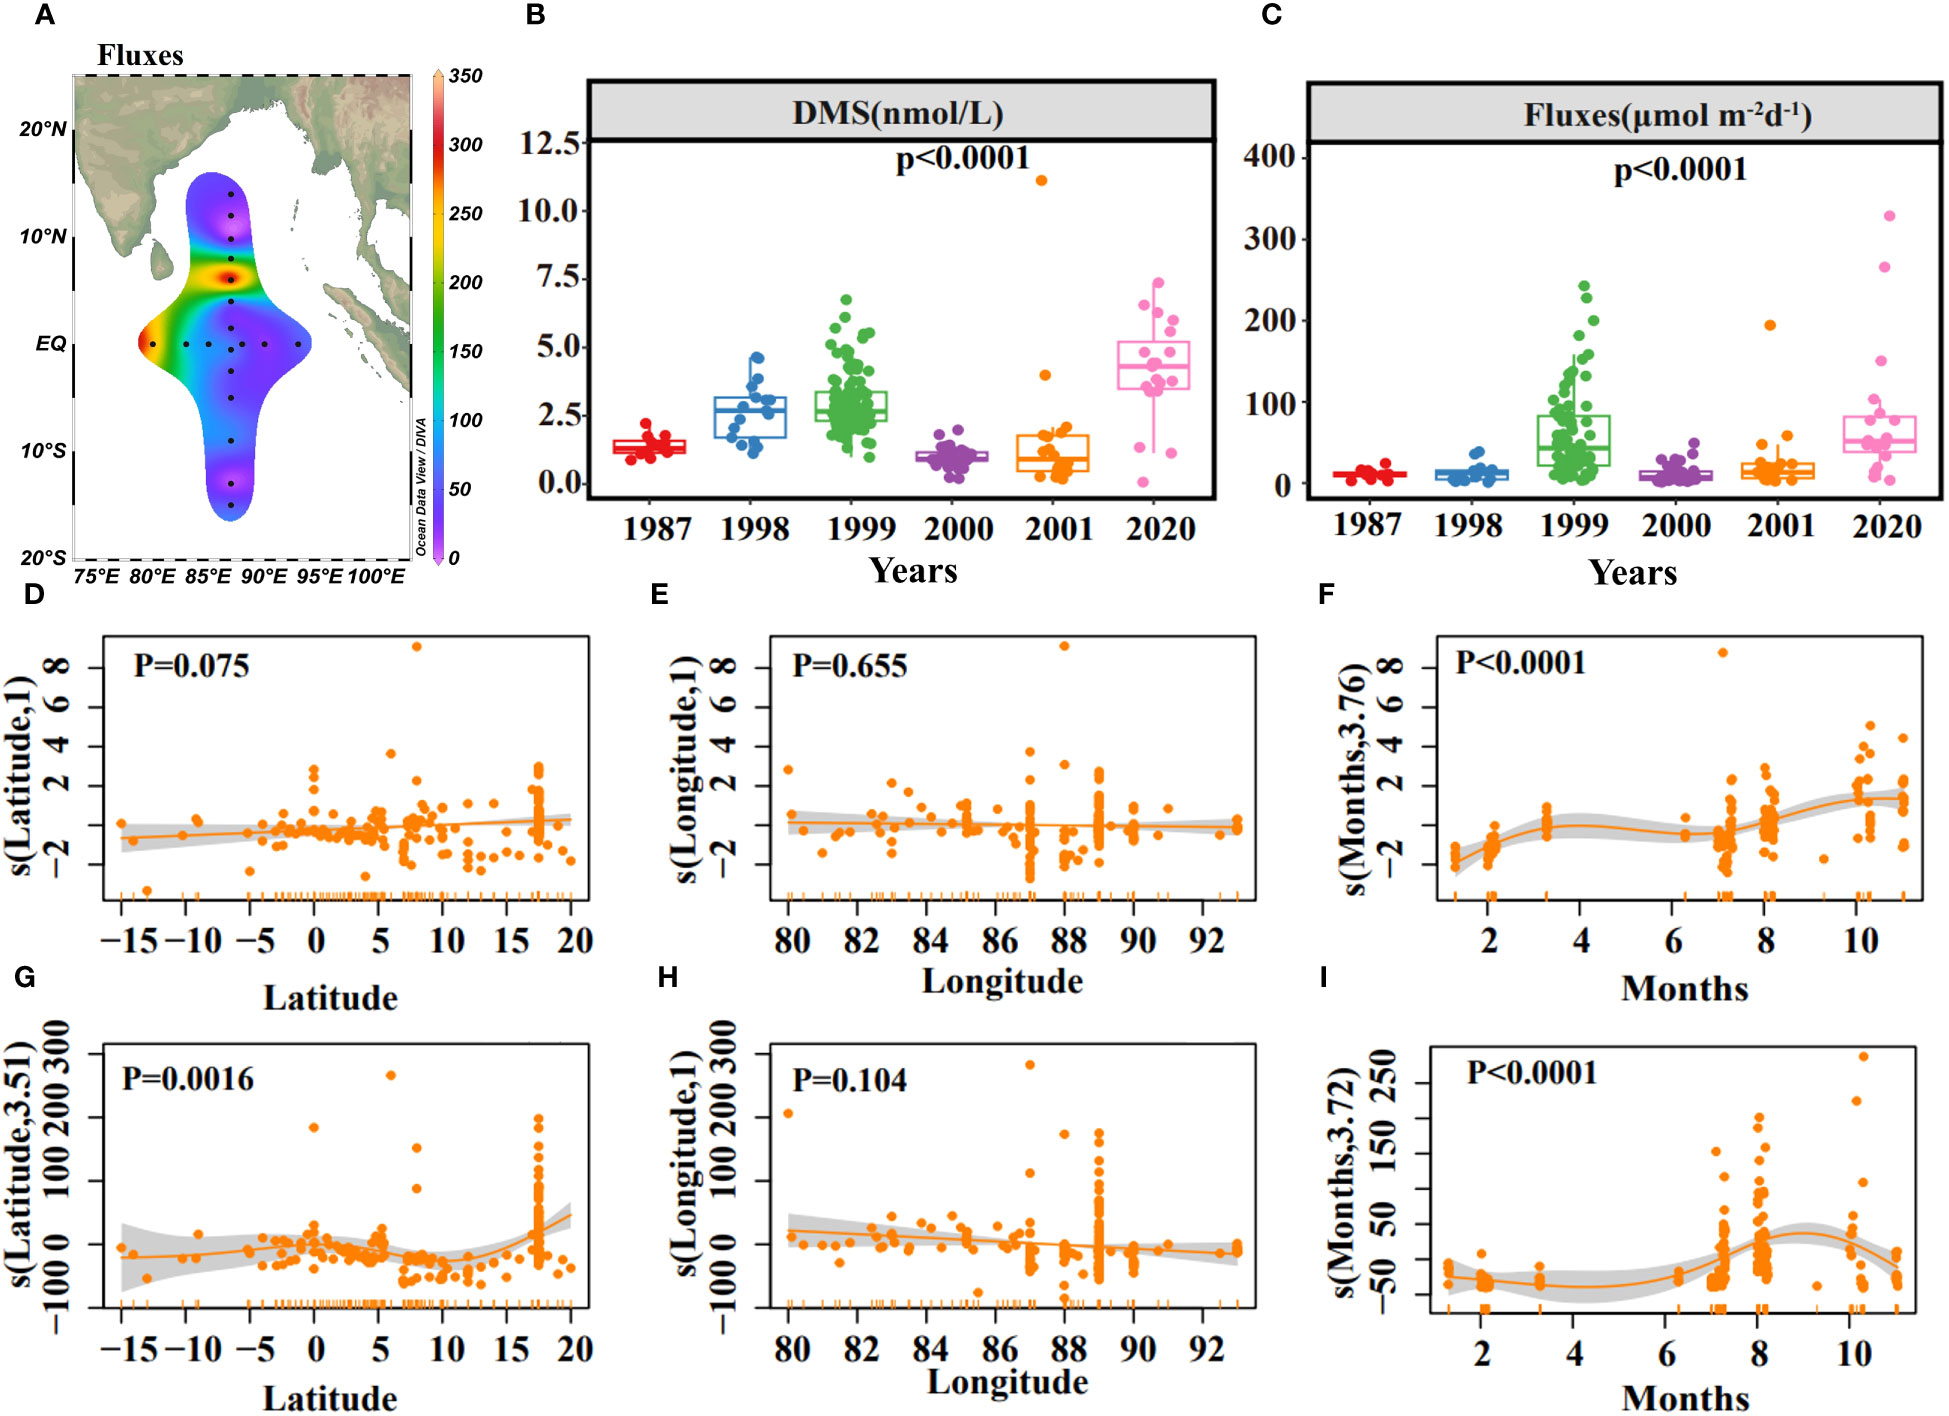
Figure 5 Horizontal distribution of sea-to-air fluxes of DMS (A). The concentrations of DMS (B) and sea-to-air fluxes (C) in different years. Results of GAMs describing the DMS concentration variability with Latitude (D), Longitude (E), Months (F), and R2 = 0.311, explained = 33.4%. Results of GAMs describing the sea-to-air fluxes variability with Latitude (G), Longitude (H), Months (I), and R2 = 0.183, explained = 20.9%. Solid yellow lines represent smoothed mean relationships from GAMs, and shaded areas are 95% confidence intervals.
3.4 The relation between DMS (P, O) and environmental/biological factors
Spearman’s correlation analysis elucidated the relationship between DMS (P, O) and environmental/biological factors throughout the water column. Temperature showed a significant positive correlation with DMS (P), while NO3-, DIP, and DSI were negatively correlated. Chl-a, Pro, and Syn all correlated positively with DMS (P). However, no factors were significantly correlated with DMSOt (Figure 6A). These results aligned with those for different groups in Supplementary Figure S1. An aggregated boosted tree (ABT) analysis quantified the relative impacts of different parameters on the DMS (P, O), indicating temperature and DSI as the most significant for DMS, and NO3- for DMSPt and DMSOt. Pro significantly affected the concentrations of DMS, DMSPt, and DMSOt, with latitude also having a notable effect on DMSOt (23.33%). In addition, Syn significantly affected DMS contents. Bacteria and Chl-a were important biological factors affecting DMSPt, while Chl-a and PEuks for DMSOt (Figures 6B–D). The top four important parameters of the ABT model would be fitted nonlinearly using generalized additive models (GAMs).
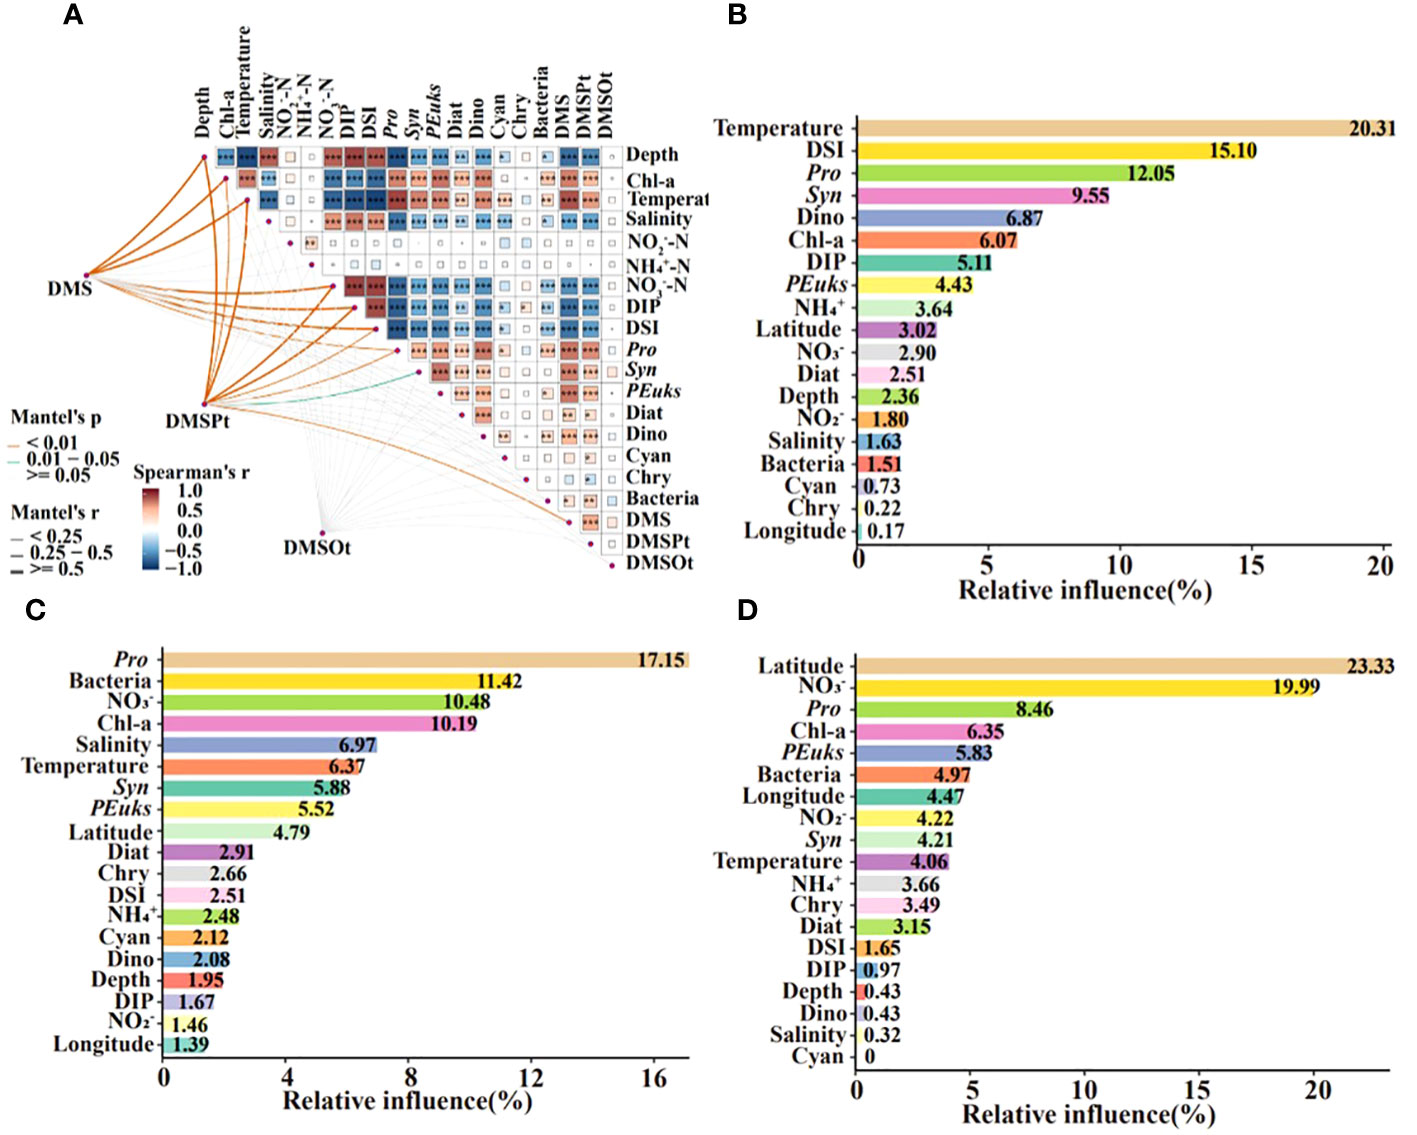
Figure 6 Correlation analysis between DMS (P, O) and environmental/biological factors in the EIO (A). Square colors and sizes represent Spearman’s correlation coefficients (r). *, **, and ***indicate significance levels at p < 0.05, p < 0.01, and p < 0.001, respectively. Aggregated boosted tree (ABT) analysis demonstrated the relative effect of environmental/biological factors on the DMS (B), DMSPt (C), and DMSOt (D) in the EIO. DSI: SiO32-; DIP: PO43-; Pro, Prochlorococcus; Syn, Synechococcus; PEuks, Picoeukaryotes; Diat, Diatom; Dino, Dinoflagellate; Cyan, Cyanobacteria; Chry, Chrysophyceae.
Generalized additive models (GAMs) confirmed temperature, DSI, Pro, and Syn as strong predictors of DMS (all P < 0.05). DMS concentration increased with rising temperature and decreasing DSI (Figures 7A, B). An increased abundance of Syn and Pro was beneficial for higher DMS concentrations (Figures 7C, D). The interaction model indicated that DMS concentration increased significantly after 23°C and decreased with rising DSI (Figure 8A). The interplay between Pro and Syn suggested that maximum DMS contents occurred at their highest abundance, with Syn contributing more to DMS concentration than Pro (Figure 8B).
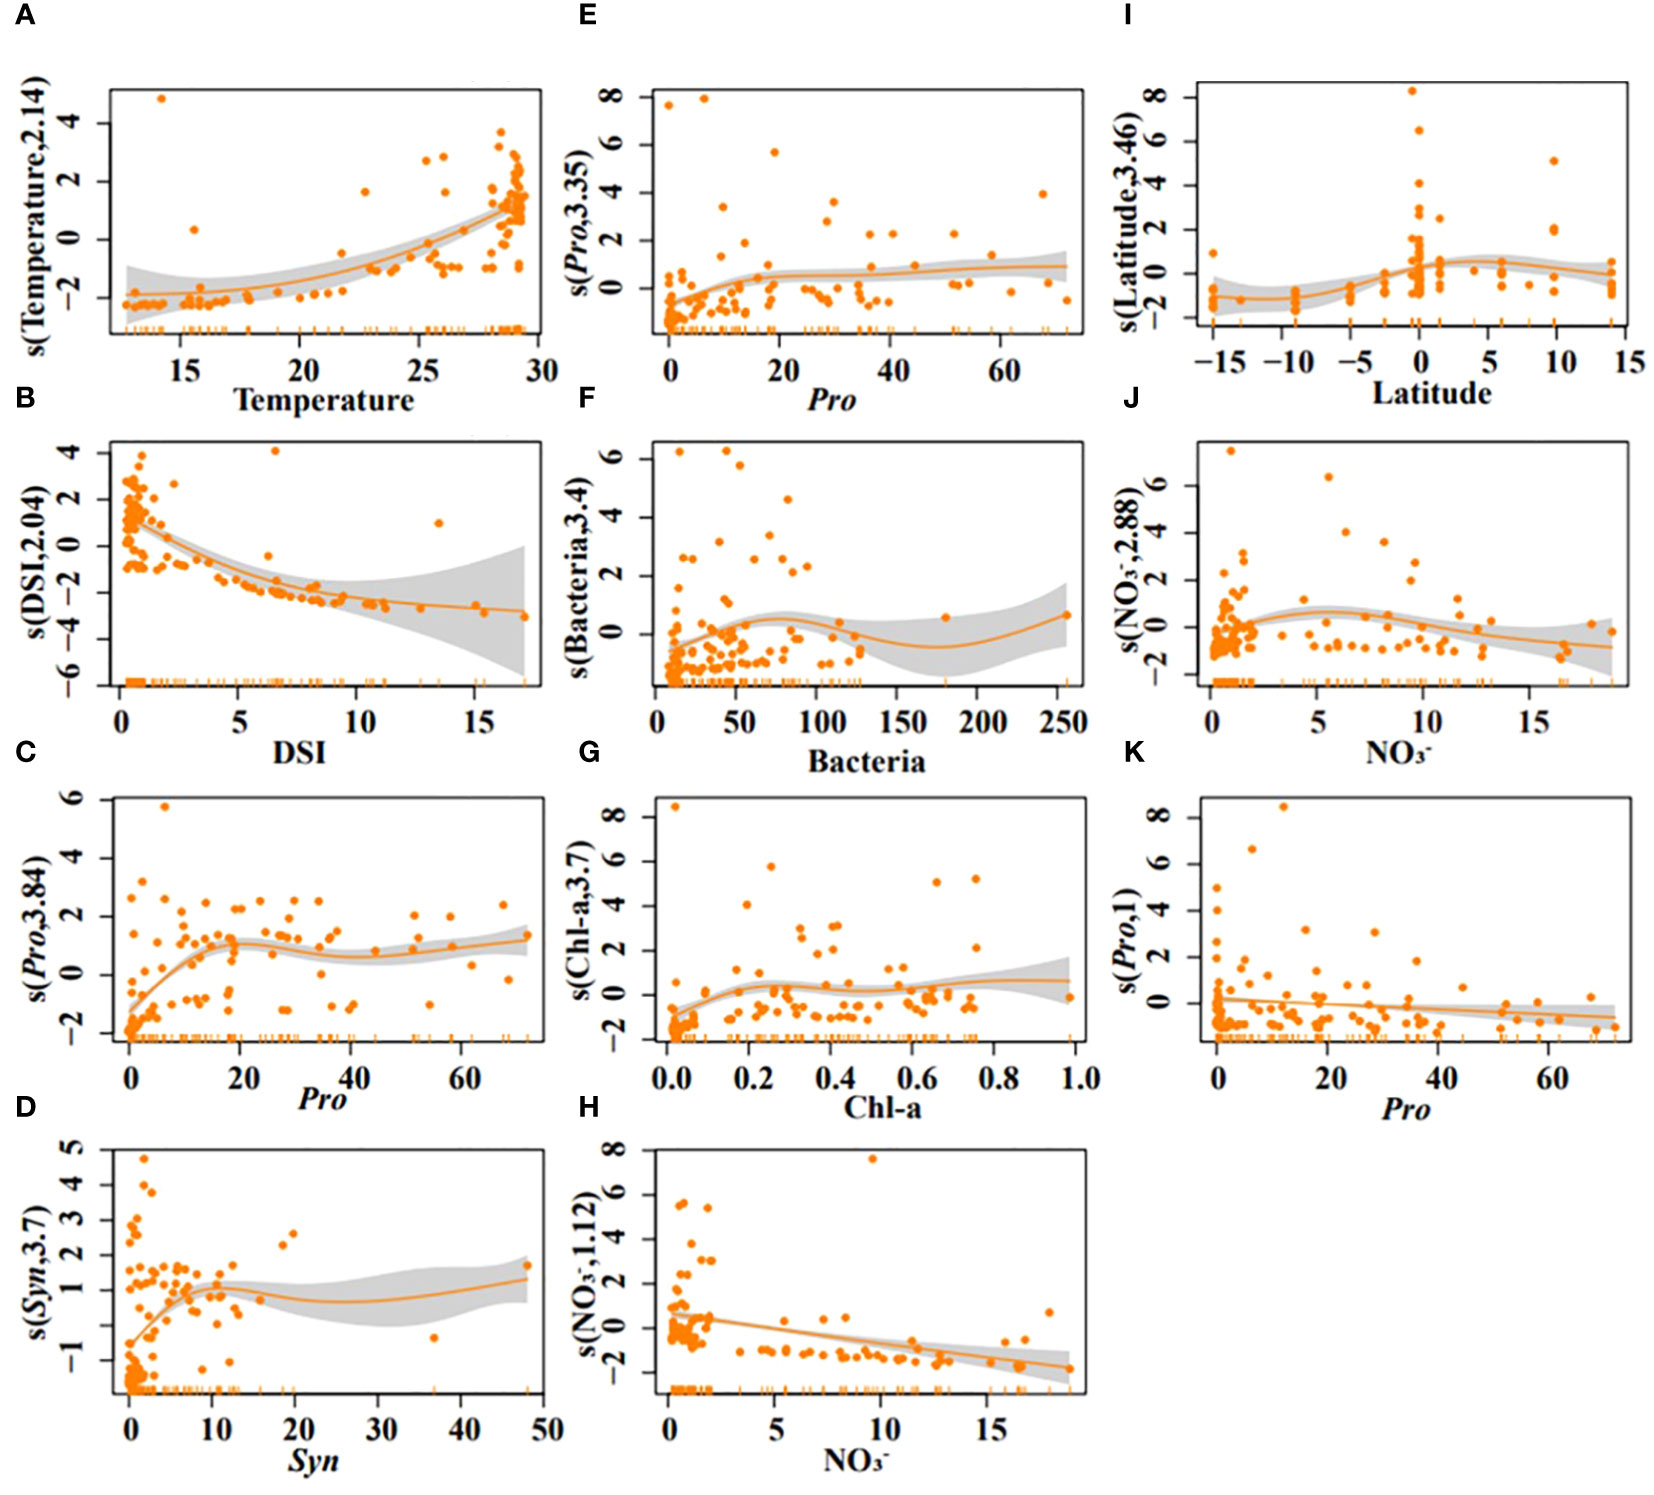
Figure 7 Results of GAMs describing the variability of DMS (A–D), DMSPt (E–H), and DMSOt (I–K) with environmental/biological factors in the EIO. Temperature (A), DSI (B), Pro (C), and Syn (D); Pro (E), bacteria (F), Chl-a (G), and NO3- (H); Latitude (I), NO3- (J), Pro (K).
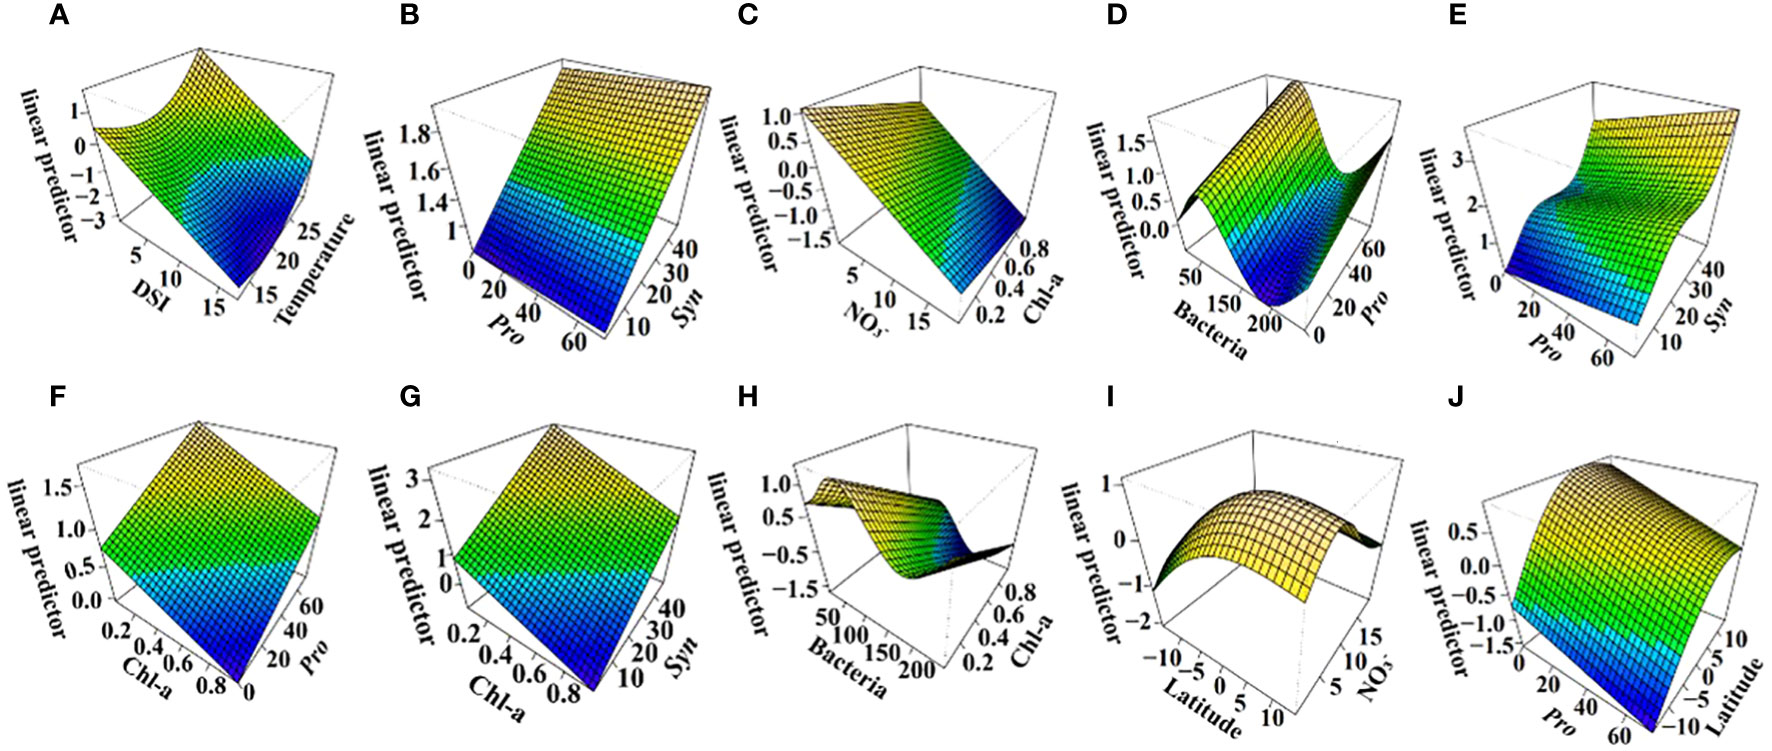
Figure 8 Linear predictor of DMS (A, B), DMSPt (C–H), and DMSOt (I, J) with interaction of environmental/biological factors based on GAMs in the EIO. R2 = 0.638, explained = 68.3% (A, B); R2 = 0.421, explained = 46.4% (C–H); R2 = 0.12, explained = 23.7% (I, J).
For DMSPt, Pro, bacteria, Chl-a, and NO3- were strong predictors (all P < 0.05). DMSPt concentration increased with a rising abundance of Pro, bacteria, and Chl-a, but decreased with increasing NO3- (Figures 7E–H). Surprisingly, in the interaction of Chl-a and NO3-, DMSPt concentration decreased with increasing Chl-a (Figure 8C). The interaction between Pro and bacteria showed a unique peak in DMSPt concentration at around 50 bacteria (Figure 8D). The DMSPt concentration first increased and then decreased with rising bacteria abundance, while it continuously increased with Pro abundance. The highest DMSPt was observed when bacteria were around 50 and Pro abundance was at its maximum. If both X and Y axes were zero, axis Z still had intercepted, indicating the presence of other vital microorganisms affecting DMSPt in the EIO (Figures 8C, D). Based on the ABT results, we proceeded to explore the effect of Pro and Syn interaction on DMSPt. Syn had a greater impact on DMSPt than Pro (Figure 8E), and DMSPt decreased with increasing Chl-a in the interaction of Chl-a and other biological factors (Figures 8F–H).
Latitude, NO3-, and Pro were significant indicators for DMSOt in GAMs (Figures 7I–K, all P < 0.05), while the relationship between DMSOt and Chl-a could not be fitted (R2 < 0, data not shown). DMSOt concentration enhanced as the location approached the northern latitude (Figure 7I) and had a broad peak around 5 μmol/L NO3- (Figure 7J). The correlation between Pro and DMSOt was monotonically negative (Figure 7K). The interaction between NO3- and latitude was complex, with a single peak in DMSOt concentration at 5°N and 10 μmol/L NO3- (Figure 8I). Lower Pro abundance near the equator favored increased DMSOt (Figure 8J).
4 Discussion
4.1 DMS (P, O) distribution variations
In surface seawater, the DMS concentrations observed in this study were within the range reported for open sea areas (Table 1), yet the mean value was marginally higher. The mean DMSPt concentration resembled that in the Western Pacific Ocean during the survey period 2009.10.9 to 10.24 but was lower compared to other regions. The mean DMSOt value aligned with those in the Arabian Sea, but was lower than in the Western Mediterranean and Western Pacific Ocean. Notably, even in identical sea areas and seasons, the range and mean value of DMS (P, O) exhibited slight variations due to differences in specific sampling locations and timings, as exemplified by studies in two different periods in the Western Pacific Ocean in Table 1. The temporal and spatial variability of the DMS (P, O) might correlate with distinct microbial community structures in various oceanic regions (Shenoy and Kumar, 2007).
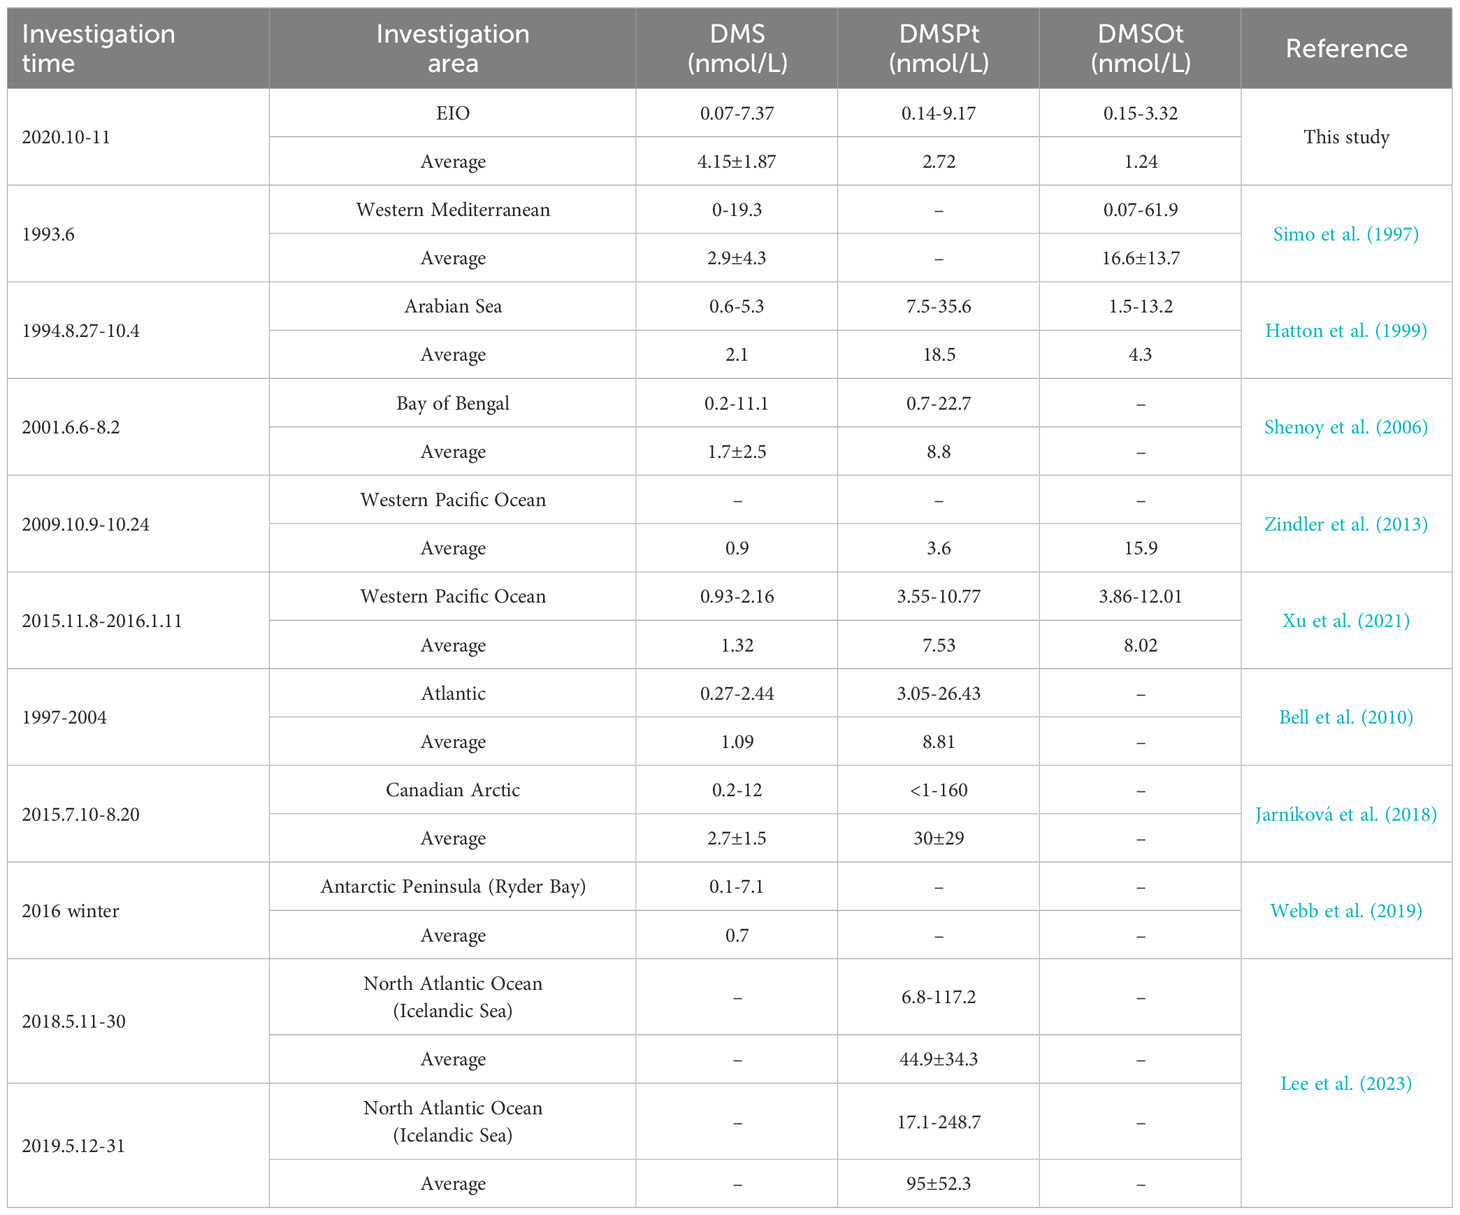
Table 1 The concentrations of DMS, DMSPt, and DMSOt in surface seawater in areas of the open sea.
Vertically, DMS and DMSPt concentrations were primarily found in water columns shallower than 75 m, whereas higher DMSOt concentrations occurred at depths deeper than 75 m. Influenced by the west-to-east Wyrtki jets, elevated DMS (P, O) values were primarily observed near the equator between 87°E and 90°E in the SA section. In the SB section, DMS (P, O) distribution was influenced by the BBR and SEC. The greater precipitation than evaporation in the Bay of Bengal resulted in a low salinity layer north of 8°N (Supplementary Figure S2H) (Rao and Jayaraman, 1968; Sengupta et al., 2006), which stimulated phytoplankton production (Figure 4H). Concurrently, the SEC transported high-nutrient and high-Chl-a seawater from east to west south of 5°S (Figure 4H; Supplementary Figures S2I–K), leading to lower DMS (P, O) values (Gao et al., 2021). However, due to missing data from some sampling sites south of the equator, biomass and DMS (P, O) concentrations were likely underestimated (Figures 4E–H).
4.2 Environmental factors in relation to DMS (P, O)
Temperature emerged as the most critical environmental factor affecting DMS concentration, in line with previous studies (Boyd et al., 2013; Guo et al., 2022). The metabolic processes of phytoplankton, including those involving enzymes essential for DMS production and metabolism, are temperature-dependent (Gao et al., 2017). Notably, the impact of temperature on DMS was modulated by the interaction between temperature and DSI (Figures 7A, 8A). DSI indirectly regulated DMS concentration by influencing the biomass of Pro and Syn. The significant negative correlation between DSI and these organisms suggested that high DSI concentrations inhibited their growth (Figure 6A), corroborating findings from Wang et al. (2022c). DMSPt content increased with intensifying nitrogen limitation, as illustrated in Figure 7H. Previous research highlighted the role of the transamination reaction in the DMSPt synthesis pathway, allocating nitrogen to new amino acids (Dacey et al., 1987; Hanson et al., 1994; Colmer et al., 1996; Gage et al., 1997; Curran et al., 1998). Therefore, abundant DMSPt could conserve nitrogen in cells under nitrogen-limited conditions (Stefels, 2000), particularly in the oligotrophic waters of the EIO. Meanwhile, NO3- was identified as the most influential environmental factor for DMSOt through ABT analysis (Figure 6D) and SEM (Figure 9A). The optimal NO3- concentration for DMSOt production was around 5 μmol/L, as indicated in Figure 7J, with an interaction effect of NO3- and latitude observed at 10 μmol/L (Figure 8I). These results suggest an optimum NO3- concentration for DMSOt production; relevant Laboratory evidence is needed to validate the result.
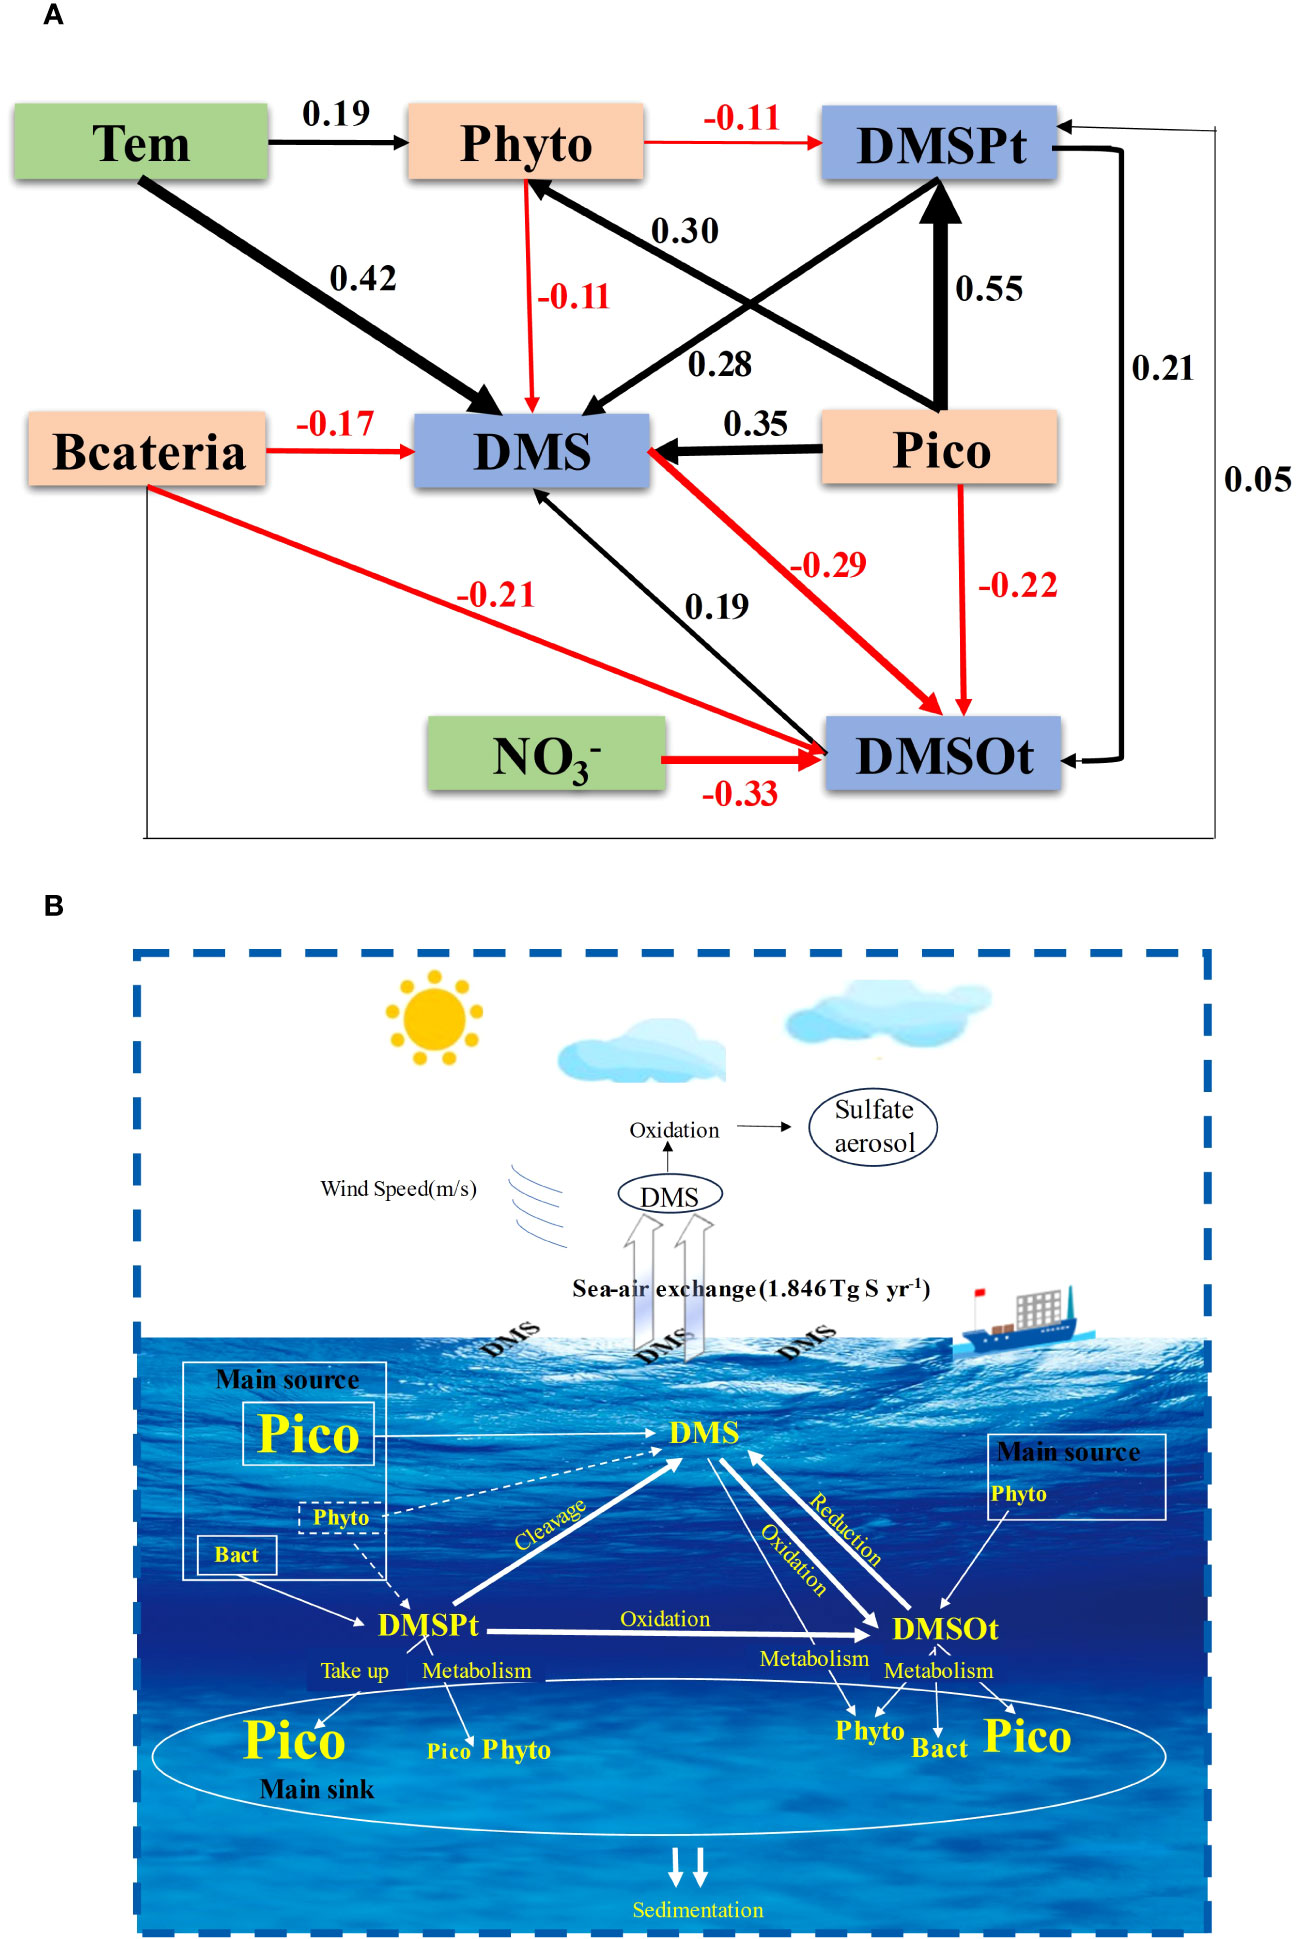
Figure 9 The structural equation model (SEM) examined the contributions of the key environmental/biological factors to DMS (P, O) in the EIO (A). (Chi-square = 1.402, P = 0.966, GFI = 0.996, RMSEA < 0.05). A schematic diagram of the main source and main sink for DMS (P, O) in the EIO (B). The dashed line indicated the underlying process but not the result. Pico (picophytoplankton) included Syn, Pro, and PEuks; Phyto (phytoplankton) included diatom, dinoflagellate, cyanobacteria, and chrysophyceae.
4.3 Biological factors in relation to DMS (P, O)
4.3.1 Biological factors in relation to DMS
Current understanding posits that Syn and Pro impact to DMS concentration via two pathways: cleaving DMSP to produce DMS or synthesizing DMS directly. While some studies suggested that certain cyanobacteria cleaved DMSP to yield DMS (Malmstrom et al., 2005), the consistently positive correlation between DMSPt and Syn, Pro in this study indicated that this pathway was not predominant. If Syn and Pro produced DMS by cleaving DMSP, a negative correlation between DMSPt and these organisms would be expected; however, we observed the opposite (Figure 8E). Additionally, Carrion et al. (2015) discovered that cyanobacteria possess the gene mddA, which encodes a methyltransferase that methylates methanethiol (MeSH) to generate DMS. More importantly, Syn and Pro can uptake MeSH from the ocean, with Syn exhibiting a higher assimilation capacity than other prokaryotic communities (Malmstrom et al., 2005), providing precursors for DMS synthesis. Therefore, the positive correlation between DMS and Syn and Pro likely arises from their synthetic capability. Given its high MeSH assimilation efficiency and widespread distribution (Supplementary Figure S3), Syn is likely a significant DMS source in the EIO.
4.3.2 Biological factors in relation to DMSPt
The monotonically positive correlation between DMSPt and the abundance of Syn, Pro, as seen in Figure 8E, contradicts Keller et al.’s (Keller et al., 1989) finding that cyanobacteria produce negligible DMSPt. This suggests that the observed correlation is not due to direct synthesis by Syn and Pro. We propose that Pro and Syn efficiently uptake and store DMSPt. Previous research indicated that low- or non-DMSP-producing species like diatoms and cyanobacteria absorbed DMSPt, while strong DMSPt producers such as chrysophyceae and dinoflagellate cannot (Vila-Costa et al., 2006). Cyanobacteria, due to their larger size, incorporate more DMSPt per cell than heterotrophic bacterium. However, on a per biovolume basis, heterotrophic bacteria demonstrate the highest DMSPt uptake efficiency, followed closely by Syn, Pro, and PEuks (Vila-Costa et al., 2006; Ruiz-Gonzalez et al., 2012). Spielmeyer et al. (2011) used isotopically labeled DMSP ([13C2D6]DMSP) to study its fate in phytoplankton, finding that diatoms, which do not produce DMSP, exhibited intense uptake signals without converting the absorbed DMSPt to other substances. This supports the notion that absorbed DMSPt is stored rather than metabolized. Petrou and Nielsen (2018) also observed that Thalassiosira weissflogii, a non-DMSP-producing diatom, completely retained ingested DMSPt within the cell for at least 6 hours, indicating a significant DMSPt sink in non-producing species. DMSPt uptake, an energy-expending process, is presumably more efficient in incorporating reduced sulfur from DMSPt directly than from sulfate (Kiene et al., 2000). In this study, Pro was the dominant prokaryotic phytoplankton numerically, followed by Syn (Supplementary Figure S3). However, Syn exhibited a notably higher DMSPt absorption capacity than Pro (Ruiz-Gonzalez et al., 2012), making it an important DMSPt sink in the EIO.
The positive correlation of DMSPt with Chl-a in Figure 7G was consistent with previous findings (Zhang et al., 2014; Zhai et al., 2020), yet a negative synergy of Chl-a with other factors was presented in Figures 8F–H. Despite Chl-a’s positive effect on DMSPt, the consumption of DMSPt by chlorophyll-rich phyto- and picoplankton appeared more significant under the influence of Chl-a and other biological factors. Given bacteria’s capacity to synthesize and metabolize DMSPt (Stefels et al., 2007; Curson et al., 2017), DMSPt contents fluctuated with bacteria abundance, as shown in Figures 7F, 8D. At lower bacterial abundance levels, an initial promoting effect on DMSPt was observed, followed by an inhibitory effect as bacteria abundance increased. When bacterial abundance exceeded 200, DMSPt was again stimulated to increase (Figure 8D). This fluctuation suggests that bacteria communities modulate their response (production or degradation) to DMSPt based on their abundance, though the underlying regulatory mechanism remains unexplored.
4.3.3 Biological factors in relation to DMSOt
A negative correlation between Pro and DMSOt was observed in Figures 7K, 8J, yet relationships of DMSOt and other biological factors could not be fitted by GAMs (R2 < 0, data not shown). Combined with SEM results (discussed in 4.4), Pro emerged as the most important factor for DMSOt consumption.
4.4 The contributions of the key factors to DMS (P, O)
The SEM not only elucidated the causal relationships among different microorganisms and DMS (P, O), but also clarified the interconversion process among DMS, DMSPt, and DMSOt (Figure 9A). The total effects of phytoplankton (-0.141) and bacteria (-0.196) on DMS were negative, whereas those of picophytoplankton (0.429), DMSPt (0.32), and DMSOt (0.19) were positive. These findings suggest that DMS is mainly produced by picophytoplankton, DMSPt cleavage, and DMSOt reduction, yet is predominantly consumed by phytoplankton and bacteria in the EIO. The direct effect of picophytoplankton (0.55) on DMSPt was positive, while the indirect effect was negative (-0.033), consistent with observations that most picophytoplankton take up DMSPt for intracellular storage, and certain species cleave DMSP. The overall effects of bacteria and phytoplankton on DMSPt were positive (0.05) and negative (-0.11), respectively, indicating that bacteria contribute to the DMSPt source, whereas phytoplankton primarily depletes it. The overall effect of picophytoplankton on DMSOt was negative (-0.206), exceeding that of bacteria (-0.15). In addition, the indirect positive effect of phytoplankton on DMSOt (0.0088) suggests that phytoplankton are biological producers of DMSOt. Moreover, the total positive effect (0.1288) of DMSPt on DMSOt demonstrates that DMSPt oxidation is a significant source of DMSOt in the EIO. (The calculation procedure of direct effect, indirect effect, and total effect was shown in Supplementary Table S2).
The SEM results are consistent with GAM’s conclusions and provide insights into the possible sources and sinks of DMS (P, O) in the EIO (Figure 9B). DMS primarily originates from picophytoplankton production, followed by DMSPt cleavage, and DMSOt reduction. Phytoplankton and bacteria act as DMS sinks. For DMSPt, aside from bacteria, macroalgae, angiosperms, and some corals are also important sources (Shaw et al., 2022). Picophytoplankton serves as a significant DMSP sink through assimilative storage, while the relatively low proportion of phytoplankton (Supplementary Figure S3) consumes DMSP as a carbon and sulfur source (Simo, 2001). The primary sources of DMSOt are dominated by DMSPt oxidation, with picophytoplankton and bacteria as the main consumers.
4.5 DMS efflux into the atmosphere
The sea-to-air fluxes of DMS in various sea areas are compiled in Supplementary Table S3 in Supplementary Material. The DMS fluxes of 79.76 μmol m-2 d-1 in this study exceeded those in other seas, attributed to higher wind speeds ranging from 2.4 to 14.5 m/s, averaging 8.58 m/s in our survey areas. Although our wind speeds were lower than those reported by Zhai et al. (2020), the lower DMS concentration led to lower sea-to-air flux in the Northern South China Sea. The monthly mean fluxes changing in this investigation area were different from those of global monthly mean fluxes but were similar to those of the Northern Hemisphere reported by Wang et al. (2020), which increased from February to August and decreased from September to November, with a peak in August (Supplementary Table S1). This is mainly because of the higher fluxes in this study area located in the Northern Hemisphere (Figure 5G). The survey regions cover 6.29 × 10⁶ km2, accounting for 8.91% of the total EIO and 1.65% of the global ocean area, respectively. Missing data, including fluxes of April, May, and December were imputed using spline interpolation, and the monthly mean fluxes over the 12 months were summed to obtain the annual fluxes (1.846 Tg S yr-1) (Supplementary Table S1). If this annual flux is used to evaluate the contribution of DMS emissions in this study area to global DMS emissions, it accounted for 9.17% of the global DMS annual fluxes based on reported by Wang et al. (2020) (20.12 Tg S yr-1) and occupied 6.81% based on reported by Hulswar et al. (2022) (27.1 Tg S yr-1). DMS is a known major source of cloud condensation nuclei (CCN), and increased atmospheric DMS can enhance CCN formation, potentially amplifying the albedo effect and mitigating the greenhouse effect (Charlson et al., 1987). The emission flux in the Indian Ocean thus has an important impact on global climate change. Although the survey area and months are limited and cannot represent the monthly flux variation of the whole eastern Indian Ocean, we hope that the results of this study will provide data support for further assessment of monthly climatology of DMS fluxes for the entire Indian Ocean.
5 Conclusion
This study elucidated the spatial distribution and environmental/biological co-regulation mechanism of dimethyl sulfur compounds in the EIO during 2020. Elevated concentrations of DMS, DMSPt, and DMSOt were predominantly observed at stations E87-28, E87-18, and EQ-07, areas characterized by coastal influences and oceanic currents. Vertically, peak concentrations of DMS and DMSPt were identified at depths of 25 m and 50m, respectively, whereas the maximum for DMSOt varied, being observed at 75 m in the SA section and 150 m in the SB section. Critical environmental determinants for DMS (P, O) were identified as temperature, DSI, and NO3-, with picophytoplankton emerging as the most influential biological factor. Syn was pinpointed as not only the primary source of DMS but also the main sink of DMSPt, while Pro was found to be the principal consumer of DMSOt. Overall, the interplay of DMS (P, O), biological elements, and environmental factors collectively governs the occurrence and distribution of dimethyl sulfur compounds in the EIO. Furthermore, the monthly DMS fluxes increased from June to August and decreased from September to November in this study. These insights are significant for advancing our understanding of the biogeochemical cycling of dimethyl sulfur compounds in the EIO and offer a crucial scientific foundation for broader global sulfur cycle research. Looking ahead, a comprehensive understanding of the genes related to DMS (P) synthesis and metabolism in the EIO remains a key objective for future research.
Data availability statement
The original contributions presented in the study are included in the article/Supplementary Material. Further inquiries can be directed to the corresponding author.
Author contributions
LP: Investigation, Methodology, Visualization, Writing – original draft, Writing – review & editing. CF: Visualization, Writing – original draft, Writing – review & editing. YG: Data curation, Writing – review & editing. CD: Data curation, Writing – review & editing. XW: Data curation, Writing – review & editing. GZ: Data curation, Writing – review & editing. JS: Conceptualization, Methodology, Project administration, Resources, Supervision, Visualization, Writing – review & editing.
Funding
The author(s) declare financial support was received for the research, authorship, and/or publication of this article. This research was financially supported by the National Natural Science Foundation of China (41876134) and the Changjiang Scholar Program of the Chinese Ministry of Education (T2014253) to JS. Data and samples were collected onboard R/V Shiyan-3 implementing the open research cruise NORC2020-10 supported by NSFC Ship time Sharing Project (project number: 41949910) and China-Sri Lanka Joint Center for Education and Research (Chinese Academy of Sciences).
Acknowledgments
We are grateful to Wenzhe Xu for language help with this study.
Conflict of interest
The authors declare that the research was conducted in the absence of any commercial or financial relationships that could be construed as a potential conflict of interest.
The author(s) declared that they were an editorial board member of Frontiers, at the time of submission. This had no impact on the peer review process and the final decision.
Publisher’s note
All claims expressed in this article are solely those of the authors and do not necessarily represent those of their affiliated organizations, or those of the publisher, the editors and the reviewers. Any product that may be evaluated in this article, or claim that may be made by its manufacturer, is not guaranteed or endorsed by the publisher.
Supplementary material
The Supplementary Material for this article can be found online at: https://www.frontiersin.org/articles/10.3389/fmars.2024.1395292/full#supplementary-material
References
Bell T. G., Poulton A. J., Malin G. (2010). Strong linkages between dimethylsulphoniopropionate (DMSP) and phytoplankton community physiology in a large subtropical and tropical Atlantic Ocean data set. Global Biogeochem. Cycles. 24, GB3009. doi: 10.1029/2009GB003617
Borges A. V., Champenois W. (2017). Preservation protocol for dimethylsulfoniopropionate and dimethylsulfoxide analysis in plant material of the Mediterranean seagrass Posidonia oceanica, and re-evaluation of dimethylsulfoniopropionate leaf content. Aquat. Bot. 143, 8–10. doi: 10.1016/j.aquabot.2017.08.004
Boyd P. W., Rynearson T. A., Armstrong E. A., Fu F., Hayashi K., Hu Z., et al. (2013). Marine phytoplankton temperature versus growth responses from polar to tropical waters–outcome of a scientific community-wide study. PloS One 8, e63091. doi: 10.1371/journal.pone.0063091
Brimblecombe P., Shooter D. (1986). Photo-oxidation of dimethylsulphide in aqueous solution. Mar. Chem. 19, 343–353. doi: 10.1016/0304-4203(86)90055-1
Bürgermeister S., Zimmermann R. L., Georgii H. W., Bingemer H. G., Kirst G. O., Janssen M., et al. (1990). On the biogenic origin of dimethylsulfide: relation between chlorophyll, ATP, organismic DMSP, phytoplankton species, and DMS distribution in Atlantic surface water and atmosphere. J. Geophys. Res.: Atmos. 95, 20607–20615. doi: 10.1029/JD095iD12p20607
Carrion O., Curson A. R. J., Kumaresan D., Fu Y., Lang A. S., Mercade E., et al. (2015). A novel pathway producing dimethylsulphide in bacteria is widespread in soil environments. Nat. Commun. 6, 6579. doi: 10.1038/ncomms7579
Charlson R. J., Lovelock J. E., Andreae M. O., Warren S. G. (1987). Oceanic phytoplankton, atmospheric sulphur, cloud albedo and climate. Nature 326, 655–661. doi: 10.1038/326655a0
Chen Y., Patel N. A., Crombie A., Scrivens J. H., Murrell J. C. (2011). Bacterial flavin containing monooxygenase is trimethylamine monooxygenase. Proceedings of the National Academy of. Science 108, 17791–17796. doi: 10.1073/pnas.1112928108
Colmer T. D., Teresa WM F., Lauchli A., Higashi R. M. (1996). Interactive effects of salinity, nitrogen and sulphur on the organic solutes in Spartina alterniflora leaf blades. J. Exp. Bot. 47, 369–375. doi: 10.1093/jxb/47.3.369
Curran M. A., Jones G. B., Burton H. (1998). Spatial distribution of dimethylsulfide and dimethylsulfoniopropionate in the Australasian sector of the Southern Ocean. J. Geophys. Res.: Atmos. 103, 16677–16689. doi: 10.1029/97JD03453
Curson A. R., Liu J., Bermejo Martinez A., Green R. T., Chan Y., Carrion O., et al. (2017). Dimethylsulfoniopropionate biosynthesis in marine bacteria and identification of the key gene in this process. Nat. Microbiol. 2, 1–9. doi: 10.1038/nmicrobiol.2017.9
Dacey J. W. H., King G. M., Wakeham S. G. (1987). Factors controlling emission of dimethylsulphide from salt marshes. Nature 330, 643–645. doi: 10.1038/330643a0
Desbruyères D., Mcdonagh E. L., King B. A., Thierry V. (2017). Global and full-depth ocean temperature trends during the early twenty-first century from Argo and repeat hydrography. J. Climate. 30, 1985–1997. doi: 10.1175/JCLI-D-16-0396.1
Gage D. A., Rhodes D., Nolte K. D., Hicks W. A., Leustek T., Cooper A. J. L., et al. (1997). A new route for synthesis of dimethylsulphoniopropionate in marine algae. Nature 387, 891–894. doi: 10.1038/43160
Gao N., Yang G. P., Zhang H. H., Liu L. (2017). Temporal and spatial variations of three dimethylated sulfur compounds in the Changjiang Estuary and its adjacent area during summer and winter. Environ. Chem. 14, 160–177. doi: 10.1071/EN16158
Gao P., Du G., Zhao D., Wei Q., Zhang X., Qu L., et al. (2021). Influences of seasonal monsoons on the taxonomic composition and diversity of bacterial community in the eastern tropical Indian ocean. Front. Microbiol. 11. doi: 10.3389/fmicb.2020.615221
Guo Y., Peng L., Liu Z., Fu X., Zhang G., Gu T., et al. (2022). Study on the seasonal variations of dimethyl sulfide, its precursors and their impact factors in the Bohai Sea and North Yellow Sea. Front. Mar. Sci. 9. doi: 10.3389/fmars.2022.999350
Guo C., Sun J., Wang X., Jian S., Abu Noman M., Huang K., et al. (2021). Distribution and settling regime of transparent exopolymer particles (TEP) potentially associated with bio-physical processes in the eastern Indian ocean. J. Geophys. Research-Biogeosci. 126, e2020JG005934. doi: 10.1029/2020JG005934
Hansen H. P., Koroleff F. (1999). Determination of nutrients. Methods Seawater Anal. 10, 159–228. doi: 10.1002/9783527613984.ch10
Hanson A. D., Rivoal J., Paquet L., Gage D. A. (1994). Biosynthesis of 3-dimethylsulfoniopropionate in Wollastonia biflora (L.) DC. (evidence that S-methylmethionine is an intermediate). Plant Physiol. 105, 103–110. doi: 10.1104/pp.105.1.103
Hatton A. D., Malin G., Liss P. S. (1999). Distribution of biogenic sulphur compounds during and just after the southwest monsoon in the Arabian Sea. Deep Sea Res. Part II: Topical Stud. Oceanogr. 46, 617–632. doi: 10.1016/S0967-0645(98)00120-9
Hatton A. D., Wilson S. T. (2007). Particulate dimethylsulphoxide and dimethylsulphoniopropionate in phytoplankton cultures and Scottish coastal waters. Aquat. Sci. 69, 330–340. doi: 10.1007/s00027-007-0891-4
Hulswar S., Simó R., Galí M., Bell T. G., Lana A., Inamdar S., et al. (2022). Third revision of the global surface seawater dimethyl sulfide climatology (DMS-Rev3). Earth Sys. Sci. Data. 14, 2963–2987. doi: 10.5194/essd-14-2963-2022
Ikhsani I. Y., Wong K. H., Ogawa H., Obata H. (2023). Dissolved trace metals (Fe, Mn, Pb,Cd, Cu, and Zn) in the eastern Indian Ocean. Mar. Chem. 248, 104208. doi: 10.1016/j.marchem.2023.104208
Isshiki K., Sohrin Y., Nakayama E. (1991). Form of dissolved silicon in seawater. Mar. Chem. 32, 1–8. doi: 10.1016/0304-4203(91)90021-N
Jarníková T., Dacey J., Lizotte M., Levasseur M., Tortell P. (2018). The distribution of methylated sulfur compounds, DMS and DMSP, in Canadian subarctic and Arctic marine waters during summer 2015. Biogeosciences 15, 2449–2465. doi: 10.5194/bg-15-2449-2018
Jian S., Zhang H. H., Yang G. P., Li G. L. (2019). Variation of biogenic dimethylated sulfur compounds in the changjiang river estuary and the coastal East China Sea during spring and summer. J. Mar. Sys. 199, 103222. doi: 10.1016/j.jmarsys.2019.103222
Jin D. X., Chen J. H., Huang K. G. (1965). Chinese Marine Planktonic Diatoms (Shanghai, China: Shanghai Scientific and Technical Publishers).
Keller M. D., Bellows W. K., Guillard R. R. L. (1989). Dimethyl sulfide production in marine phytoplankton. Am. Chem. Soc. 393, 167–182. doi: 10.1021/bk-1989
Kiene R. P., Gerard G. (1994). Determination of trace levels of dimethylsulfoxide (DMSO) in seawater and rainwater. Mar. Chem. 47, 1–12. doi: 10.1016/0304-4203(94)90009-4
Kiene R. P., Linn L. J., Bruton J. A. (2000). New and important roles for DMSP in marine microbial communities. J. Sea Res. 43, 209–224. doi: 10.1016/S1385-1101(00)00023-X
Kirst G. O., Thiel C., Wolff H., Nothnagel J., Wanzek M., Ulmke R. (1991). Dimethylsulfoniopropionate (DMSP) in icealgae and its possible biological role. Mar. Chem. 35, 381–388. doi: 10.1016/S0304-4203(09)90030-5
Lee K., Kim J. S., Park K. T., Park M. J., Jang E., Gudmundsson K., et al. (2023). Observational evidence linking ocean sulfur compounds to atmospheric dimethyl sulfide during Icelandic Sea phytoplankton blooms. Sci. Total Environ. 879, 163020. doi: 10.1016/j.scitotenv.2023.163020
Lee S. K., Park W., Baringer M. O., Gordon A. L., Huber B., Liu Y. (2015). Pacific origin of the abrupt increase in Indian Ocean heat content during the warming hiatus. Nat. Geosci. 8, 445–449. doi: 10.1038/ngeo2438
Lee G., Park J., Jang Y., Lee M., Kim K. R., Oh J. R., et al. (2010). Vertical variability of seawater DMS in the South Pacific Ocean and its implication for atmospheric and surface seawater DMS. Chemosphere 78, 1063–1070. doi: 10.1016/j.chemosphere.2009.10.054
Li J.p., Zhang H. H., Yang G. P. (2015). Distribution of biogenic organic dimethylated sulfur compounds and its influencing factors in the east China Sea in summer. Huan jing ke xue= Huanjing kexue 36, 49–55. doi: 10.13227/j.hjkx.2015.01.007
Lidbury I., Krober E., Zhang Z., Zhu Y., Murrell J. C., Chen Y., et al. (2016). A mechanism for bacterial transformation of dimethylsulfide to dimethylsulfoxide: a missing link in the marine organic sulfur cycle. Environ. Microbiol. 18, 2754–2766. doi: 10.1111/1462-2920.13354
Liu M., Zheng H., Chen M., Liang J., Duan M., Du H., et al. (2022). Dissolved PAHs impacted by air-sea interactions: Net volatilization and strong surface current transport in the Eastern Indian Ocean. J. Hazard. Mater. 431, 128603. doi: 10.1016/j.jhazmat.2022.128603
Malmstrom R. R., Kiene R. P., Vila M., Kirchman D. L. (2005). Dimethylsulfoniopropionate (DMSP) assimilation by Synechococcus in the Gulf of Mexico and northwest Atlantic Ocean. Limnol Oceanogr. 50, 1924–1931. doi: 10.4319/lo.2005.50.6.1924
Merzouk A., Levasseur M., Scarratt M., Michaud S., Lizotte M., Rivkin R. B., et al. (2008). Bacterial DMSP metabolism during the senescence of the spring diatom bloom in the Northwest Atlantic. Mar. Ecol. Prog. Series. 369, 1–11. doi: 10.3354/meps07664
Nightingale P. D., Malin G., Law C. S., Watson A. J., Liss P. S., Liddicoat M. I., et al. (2000). In situ evaluation of air-sea gas exchange parameterizations using novel conservative and volatile tracers. Global Biogeochem. Cycles. 14, 373–387. doi: 10.1029/1999GB900091
O’Brien J., Focardi A., Deschaseaux E. S., Petrou K., Ostrowski M., Beckley L. E., et al. (2022). Microbial dimethylsulfoniopropionate (DMSP) cycling in the ultraoligotrophic eastern Indian Ocean. Deep-Sea Res. Part II Topical Stud. Oceanogr. 206, 105195. doi: 10.1016/j.dsr2.2022.105195
Peng L., Guo Y., Gu T., Li H., Jian S., Jia D., et al. (2020). Benzene-assisted photoionization positive ion mobility spectrometry coupled with a time-resolved introduction for field detecting dimethyl sulfide in seawater. Anal Methods 12, 5168–5176. doi: 10.1039/D0AY01242D
Peng L., Guo Y., Lou T., Cui X., Zhang G., Fu X., et al. (2022). Field investigation of dimethyl sulfur in the Bohai Sea and northern Yellow Sea by ion mobility spectrometry. Haiyang Xuebao. 44, 1–10. doi: 10.12284/hyxb2022008
Peng S., Qian Y. K., Lumpkin R., Du Y., Wang D., Li P. (2015). Characteristics of the near surface currents in the Indian ocean as deduced from satellite-tracked surface drifters. Part I: pseudo-eulerian statistics. J. Phys. Oceanogr. 45, 441–458. doi: 10.1175/JPO-D-14-0050.1
Petrou K., Nielsen D. (2018). Uptake of dimethylsulphoniopropionate (DMSP) by the diatom Thalassiosira weissflogii: a model to investigate the cellular function of DMSP. Biogeochemistry 141, 265–271. doi: 10.1007/s10533-018-0507-1
Quinn P. K., Bates T. S. (2011). The case against climate regulation via oceanic phytoplankton sulphur emissions. Nature 480, 51–56. doi: 10.1038/nature10580
Rao L. V. G., Jayaraman R. (1968). Hydrographic features of the southern and central Bay of Bengal during the transition period between winter and summer. Bull. Natl. Instit Sci. India. 38, 184e205. Available at: drs.nio.org/drs/handle/2264/5970.
Ruiz-Gonzalez C., Simo R., Vila-Costa M., Sommaruga R., Gasol J. M. (2012). Sunlight modulates the relative importance of heterotrophic bacteria and picophytoplankton in DMSP-sulphur uptake. ISME J. 6, 650–659. doi: 10.1038/ismej.2011.118
Saltzman E. S., King D. B., Holmen K., Leck C. (1993). Experimental determination of the diffusion coefficient of dimethylsulfide in water. J. Geophys. Res.: Oceans 98, 16481–16486. doi: 10.1029/93JC01858
Sengupta D., Bharath Raj G. N., Shenoi S. S. C. (2006). Surface fresh water from Bay of Bengal runoff and Indonesian throughflow in the tropical Indian Ocean. Geophys. Res. Lett. 33, L22609. doi: 10.1029/2006GL027573
Sgorbati S. (2007). “Phytoplankton analysis using flow cytometry,” in Water Quality Measurements Series (Chichester (England): Wiley-Blackwell), 91–105. doi: 10.1002/9780470511107
Shaw D. K., Sekar J., Ramalingam P. V. (2022). Recent insights into oceanic dimethylsulfoniopropionate biosynthesis and catabolism. Environ. Microbiol. 24, 2669–2700. doi: 10.1111/1462-2920.16045
Shenoy D. M., Kumar M. D. (2007). Variability in abundance and fluxes of dimethyl sulphide in the Indian Ocean. Phaeocystis major link biogeochem. cycling climate-relevant elem. 83, 277–292. doi: 10.1007/s10533-007-9092-4
Shenoy D. M., Paul J. T., Gauns M., Ramaiah N., Kumar M. D. (2006). Spatial variations of DMS, DMSP and phytoplankton in the Bay of Bengal during the summer monsoon 2001. Mar. Environ. Res. 62, 83–97. doi: 10.1016/j.marenvres.2006.03.005
Simo R. (2001). Production of atmospheric sulfur by oceanic plankton: biogeochemical, ecological and evolutionary links. Trends Ecol. Evol. 16, 287–294. doi: 10.1016/S0169-5347(01)02152-8
Simo R., Grimalt J. O., Albaigés J. (1997). Dissolved dimethylsulphide, dimethylsulphoniopropionate and dimethylsulphoxide in western Mediterranean waters. Deep sea Res. Part ii: Topical Stud. oceanogr. 44, 929–950. doi: 10.1016/S0967-0645(96)00099-9
Speeckaert G., Borges A. V., Champenois W., Royer C., Gypens N. (2018). Annual cycle of dimethylsulfoniopropionate (DMSP) and dimethylsulfoxide (DMSO) related to phytoplankton succession in the Southern North Sea. Sci. Total Environ. 622, 362–372. doi: 10.1016/j.scitotenv.2017.11.359
Spielmeyer A., Gebser B., Pohnert G. (2011). Investigations of the uptake of dimethylsulfoniopropionate by phytoplankton. Chembiochem 12, 2276–2279. doi: 10.1002/cbic.201100416
Stefels J. (2000). Physiological aspects of the production and conversion of DMSP in marine algae and higher plants. J. Sea Res. 43, 183–197. doi: 10.1016/S1385-1101(00)00030-7
Stefels J., Steinke M., Turner S., Malin G., Belviso S. (2007). Environmental constraints on the production and removal of the climatically active gas dimethylsulphide (DMS) and implications for ecosystem modelling. Biogeochemistry 83, 245–275. doi: 10.1007/s10533-007-9091-5
Sun J., Liu D., Qian S. (2002). A quantative research and analysis method for marine phytonplankton: an introduction to utermohl method and its modification (in Chinese with English abstract). Oceanogr Huanghai Bohai Seas. 20, 105–112. doi: 10.3969/j.issn.1671-6647.2002.02.016
Sunda W. K. D. J., Kieber D. J., Kiene R. P., Huntsman S. (2002). An antioxidant function for DMSP and DMS in marine algae. Nature 418, 317–320. doi: 10.1038/nature00851
Taguchi S., Ito-Oka E., Masuyama K., Kasahara I., Goto K. (1985). Application of organic solvent-soluble membrane filters in the preconcentration and determination of trace elements: spectrophotometric determination of phosphorus as phosphomolybdenum blue. Talanta 32, 391–394. doi: 10.1016/0039-9140(85)80104-1
Thume K., Gebser B., Chen L., Meyer N., Kieber D. J., Pohnert G. (2018). The metabolite dimethylsulfoxonium propionate extends the marine organosulfur cycle. Nature 563, 412–415. doi: 10.1038/s41586-018-0675-0
Vairavamurthy A., Andreae M. O., Iverson R. L. (1985). Biosynthesis of dimethylsulfide and dimethylpropiothetin by Hymenomonas carterae in relation to sulfur source and salinity variations. Limnol Oceanogr. 30, 59–70. doi: 10.4319/lo.1985.30.1.0059
Verdouw H., Van Echteld C. J. A., Dekkers E. M. J. (1978). Ammonia determination based on indophenol formation with sodium salicylate. Water Res. 12, 399–402. doi: 10.1016/0043-1354(78)90107-0
Vila-Costa M., Simo R., Harada H., Gasol J. M., Slezak D., Kiene R. P. (2006). Dimethylsulfoniopropionate uptake by marine phytoplankton. Science 314, 652–654. doi: 10.1126/science.1131043
Wang J. (2017). Observational bifurcation of Wyrtki Jets and its influence on the salinity balance in the eastern Indian Ocean. Atmos. Ocean. Sci. Lett. 10, 36–43. doi: 10.1080/16742834.2017.1239506
Wang S., Elliott S., Maltrud M., Cameron-Smith P. (2015). Influence of explicit Phaeocystis parameterizations on the global distribution of marine dimethyl sulfide. J. Geophys. Res.: Biogeosci. 120, 2158–2177. doi: 10.1002/2015JG003017
Wang W. L., Song G., Primeau F., Saltzman E. S., Bell T. G., Moore J. K. (2020). Global ocean dimethyl sulfide climatology estimated from observations and an artificial neural network. Biogeosciences 17, 5335–5354. doi: 10.5194/bg-17-5335-2020
Wang X., Sun J., Wei Y., Wu X. (2022a). Response of the phytoplankton sinking rate to community structure and environmental factors in the eastern Indian ocean. Plants 11, 1534. doi: 10.3390/plants11121534
Wang X., Sun J., Yu H. (2022b). Distribution and environmental impact factors of phytoplankton in the bay of bengal during autumn. Diversity 14, 361. doi: 10.3390/d14050361
Wang X., Wang F., Sun J. (2022c). Distribution and environmental impact factors of picophytoplankton in the eastern Indian ocean. J. Mar. Sci. Eng. 10, 628. doi: 10.3390/jmse10050628
Webb A., Van Leeuwe M., Os D. D., Meredith M., Venables H. J., Stefels J. (2019). Extreme spikes in DMS flux double estimates of biogenic sulfur export from the Antarctic coastal zone to the atmosphere. Sci. Rep. 9, 2233. doi: 10.1038/s41598-019-38714-4
Wei Y., Zhang G., Chen J., Wang J., Ding C., Zhang X., et al. (2019). Dynamic responses of picophytoplankton to physicochemical variation in the eastern Indian Ocean. Ecol. evol. 9, 5003–5017. doi: 10.1002/ece3.5107
Welschmeyer N. A. (1994). Fluorometric analysis of chlorophyll a in the presence of chlorophyll b and pheopigments. Limnol oceanogr 39, 1985–1992. doi: 10.4319/lo.1994.39.8.1985
Wolfe G. V., Steinke M., Kirst G. O. (1997). Grazing-activated chemical defence in a unicellular marine alga. Nature 387, 894–897. doi: 10.1038/43168
Wood E. D., Armstrong F. A. J., Richards F. A. (1967). Determination of nitrate in sea water by cadmium-copper reduction to nitrite. J. Mar. Biol. Assoc. United Kingdom. 47, 23–31. doi: 10.1017/S002531540003352X
Xu F., Yan S. B., Zhang H. H., Wu Y. C., Ma Q. Y., Song Y. C., et al. (2021). Occurrence and cycle of dimethyl sulfide in the western Pacific Ocean. Limnol Oceanogr. 66, 2868–2884. doi: 10.1002/lno.11797
Yamaji I. (1984). Illustrations of the marine plankton of Japan (Osakafor: Hoikusha Publishing Company).
Yang G. P., Song Y. Z., Zhang H. H., Li C. X., Wu G. W. (2014). Seasonal variation and biogeochemical cycling of dimethylsulfide (DMS) and dimethylsulfoniopropionate (DMSP) in the Yellow Sea and Bohai Sea. J. Geophys. Res.: Oceans. 119, 8897–8915. doi: 10.1002/2014JC010373
Yang J., Yang G., Zhang H., Zhang S. (2016). Temporal variations of dimethylsulfide and dimethylsulfoniopropionate in the southern Yellow Sea in spring and autumn. Acta Oceanol. Sinica. 35, 76–87. doi: 10.1007/s13131-015-0780-y
Zhai X., Song Y. C., Li J. L., Yang J., Zhang H. H., Yang G. P. (2020). Distribution Characteristics of dimethylated sulfur compounds and turnover of dimethylsulfide in the northern South China Sea during summer. J. Geophys. Res.: Biogeosci. 125, e2019JG005363. doi: 10.1029/2019JG005363
Zhai X., Zhang H. H., Yang G. P., Li J. L., Yuan D. (2018). Distribution and sea-air fluxes of biogenic gases and relationships with phytoplankton and nutrients in the central basin of the South China Sea during summer. Mar. Chem. 200, 33–44. doi: 10.1016/j.marchem.2018.01.009
Zhang X. H., Liu J., Liu J., Yang G., Xue C. X., Curson A. R., et al. (2019). Biogenic production of DMSP and its degradation to DMS—their roles in the global sulfur cycle. Sci. China Life Sci. 62, 1296–1319. doi: 10.1007/s11427-018-9524-y
Zhang S. H., Yang G. P., Zhang H. H., Yang J. (2014). Spatial variation of biogenic sulfur in the south Yellow Sea and the East China Sea during summer and its contribution to atmospheric sulfate aerosol. Sci. total Environ. 488, 157–167. doi: 10.1016/j.scitotenv.2014.04.074
Keywords: the eastern Indian Ocean, dimethyl sulfur compounds, co-regulation mechanism, spatial distribution, picophytoplankton
Citation: Peng L, Fan C, Guo Y, Ding C, Wang X, Zhang G and Sun J (2024) Spatial distribution and environmental/biological co-regulation mechanism of dimethyl sulfur compounds in the eastern Indian Ocean. Front. Mar. Sci. 11:1395292. doi: 10.3389/fmars.2024.1395292
Received: 03 March 2024; Accepted: 08 April 2024;
Published: 08 May 2024.
Edited by:
Guangchao Zhuang, Ocean University of China, ChinaReviewed by:
Chun-Ying Liu, Ocean University of China, ChinaWei-Lei Wang, University of California, Irvine, United States
Copyright © 2024 Peng, Fan, Guo, Ding, Wang, Zhang and Sun. This is an open-access article distributed under the terms of the Creative Commons Attribution License (CC BY). The use, distribution or reproduction in other forums is permitted, provided the original author(s) and the copyright owner(s) are credited and that the original publication in this journal is cited, in accordance with accepted academic practice. No use, distribution or reproduction is permitted which does not comply with these terms.
*Correspondence: Jun Sun, phytoplankton@163.com
†These authors have contributed equally to this work