


Abstract
Neutral hydrogen (H i) is the primary component of the cool interstellar medium (ISM) and is the reservoir of fuel for star formation. Owing to the sensitivity of existing radio telescopes, our understanding of the evolution of the ISM in galaxies remains limited, as it is based on only a few hundred galaxies detected in H i beyond the local Universe. With the high sensitivity of the Five-hundred-meter Aperture Spherical radio Telescope (FAST), we carried out a blind H i search, the FAST Ultra-Deep Survey, which extends to redshifts up to 0.42 and a sensitivity of 50 μJy beam−1. Here, we report the first discovery of six galaxies in H i at z > 0.38. For these galaxies, the FAST angular resolution of ∼4' corresponds to a mean linear size of  Mpc. These galaxies are among the most distant H i emission detections known, with one having the most massive H i content (
 ). Using recent data from the DESI survey and new observations with the Hale, Big Telescope Alt-azimuth, and Keck telescopes, optical counterparts are detected for all galaxies within the 3σ positional uncertainty (
 Mpc) and 200 km s−1 in recession velocity. Assuming that the dominant source of H i is the identified optical counterpart, we find evidence of evolution in the H i content of galaxies over the last 4.2 Gyr. Our new high-redshift H i galaxy sample provides the opportunity to better investigate the evolution of cool gas in galaxies. A larger sample size in the future will allow us to refine our knowledge of the formation and evolution of galaxies.
Export citation and abstract BibTeX RIS

Original content from this work may be used under the terms of the Creative Commons Attribution 4.0 licence. Any further distribution of this work must maintain attribution to the author(s) and the title of the work, journal citation and DOI.
1. Introduction
Hydrogen is the most common element in the Universe. In its neutral form (H i), it is abundant in spiral galaxies such as our Milky Way. It also indirectly regulates star formation by feeding the molecular clouds that are responsible for initiating star formation (Sancisi et al. 2008). H i commonly extends far beyond the stellar disk of galaxies, making it an excellent probe for tracing interactions between galaxies or between galaxies and the circumgalactic medium.
One of the most significant questions in astronomy is how the Universe evolved into its present form. To answer this, it is necessary to study galaxies over a range of cosmic times and therefore redshifts. The Hubble Space Telescope reported the oldest galaxy in the optical band at z = 11.1 (Oesch et al. 2016), which is only ∼400 Myr after the Big Bang. Such detections allow measurements of the evolution of the molecular gas fraction of galaxies (Heintz et al. 2023), the evolution of supermassive black holes (Behroozi & Silk 2018), and tests of the galaxy formation theory inside the standard ΛCDM cosmological framework (Behroozi & Silk 2018). However, by comparison with the detection of stellar components of galaxies in optical or infrared (IR) bands, detection of cool H i is much harder owing to the weakness of the 21 cm emission line. Almost all H i detections (Barnes et al. 2001; Meyer et al. 2004, 2009; Giovanelli et al. 2005; Verheijen et al. 2007; Freudling et al. 2011; Catinella & Cortese 2015; Hoppmann et al. 2015; Blyth et al. 2016; Fernández et al. 2016; Jarvis et al. 2016; Baker et al. 2018; Li et al. 2018; Zhang et al. 2019; Koribalski et al. 2020; Xi et al. 2021) are confined to z < 0.35, with only two detections beyond this, the most distant unlensed detection being at z = 0.376 from the Karl G. Jansky Very Large Array (VLA) CHILES survey (Fernández et al. 2016), and the most distant lensed H i galaxy detection being at z = 1.3 (Chakraborty & Roy 2023).
The Five-hundred-meter Aperture Spherical radio Telescope (FAST) Ultra-Deep Survey (FUDS; Xi et al. 2022) is one of the deepest H i surveys, having a sensitivity of ∼50 μJy beam−1, a frequency resolution of 22.9 kHz (velocity resolution of 6.76 km s−1 at z ∼ 0.4), a redshift limit of z = 0.42 (a lookback time of 4.4 Gyr), and an angular resolution of  (physical resolution of
  Mpc) at the redshift limit. Hence, it is well suited to the exploration of gas evolution over 30% of the age of the Universe. Here, we report six H i galaxy candidates directly detected in the 21 cm emission line in the pilot survey of FUDS (FUDS0) that have higher redshifts (0.38 < z < 0.40) than the highest-redshift CHILES detections and are unlensed so that their intrinsic properties are well understood. In this paper, we use the flat universe model with parameters of H0 = 70 h70 km s−1 Mpc−1, ΩM = 0.3, and ΩΛ = 0.7.
2. Detections by FAST
FAST is not only the largest single-dish telescope in the world, but it hosts a 19-beam receiver (Dunning et al. 2017), which dramatically boosts its capability to make multiple simultaneous observations and increases its ability to survey and map large areas of sky. For the first FUDS field (FUDS0), a region centered at R.A. (J2000) = 08h17m12s, decl. (J2000) = +22°10'48 0 was observed for a total of 95 hr. This yielded a sensitivity of 50 μJy beam−1 over an area of 0.72 deg2. The observations were performed in on-the-fly (OTF) mode from 2019 August 25 to 2020 May 22. More details of the observations, calibration, data reduction, and noise analysis are described in Appendixes A and B.
We searched for sources with a signal-to-noise ratio (S/N) larger than 7 in the final cube by averaging channels on different scales (25, 50, 100, and 200 kHz) using a custom algorithm (see Section 4.1 in Xi et al. 2022). Our initial study focuses on H i detections with z > 0.38 (f < 1.03 GHz). Candidate signals were visually inspected to remove obvious artifacts—e.g., some discrete ranges of frequency with bad spectral baselines contain an excess of positive and negative signals due to radio frequency interference (RFI). The final list consists of six H i galaxy candidates with z > 0.38. We present H i column-density contours overlaid on top of Dark Energy Spectroscopic Instrument (DESI) Legacy Imaging Survey
14
(Zou et al. 2017; Dey et al. 2019) three-band optical images and their spectra in Figure 1. A 2D Gaussian fit to the column-density maps is used to derive positions with a 1σ uncertainty of  (based on the offset of 62 FUDS galaxies from their optical counterparts with spectroscopic redshift measurements). The busy function (Westmeier et al. 2014) was employed to derive model spectra, which are overlaid in Figure 1.
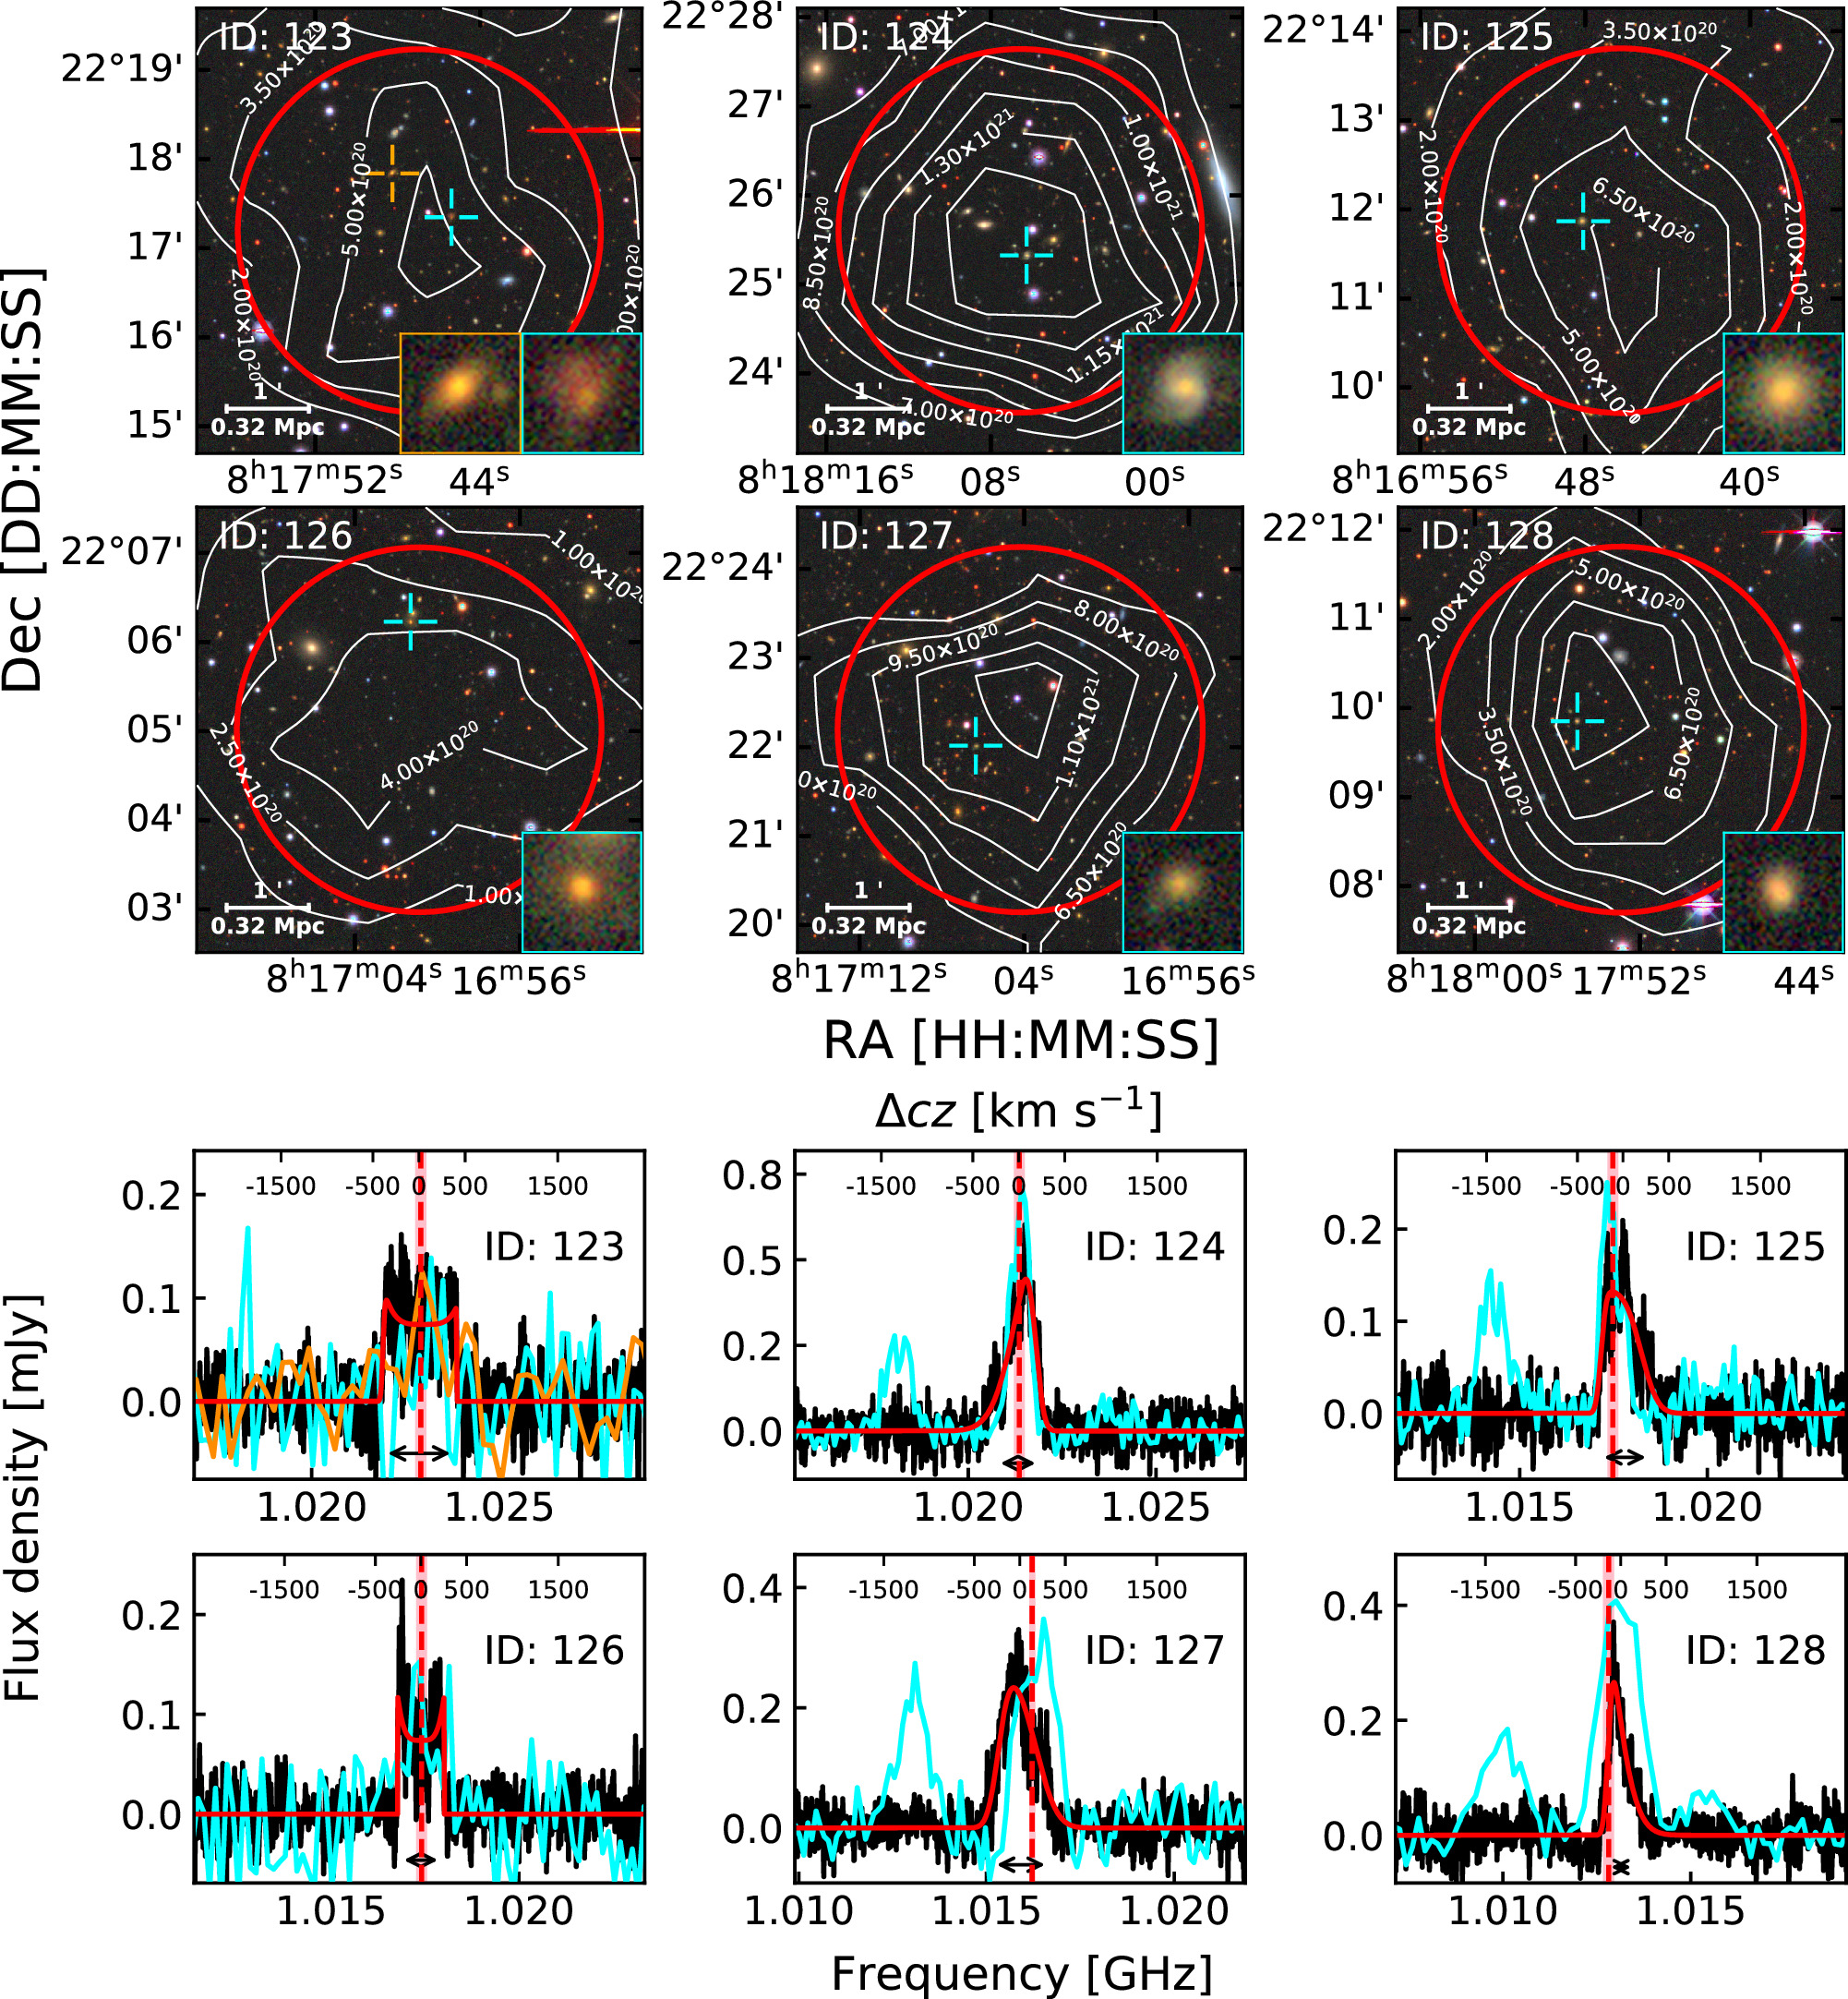
Figure 1. Six high-redshift H i detections in the FUDS0 field. Upper panels: the contours of column density overlaid on optical images from the DESI Legacy Imaging Surveys. The cyan crosses indicate the positions of the optical counterparts, for which zoomed-in images are shown in the bottom right insets. The red circles are the beam size in the final cube. Lower panels: the spatially integrated spectra from the final cube. The red lines are the best-fit busy function, and the black lines with double arrow heads indicate the line width  after correcting for frequency resolution. Optical spectra from the DESI legacy survey (ID: 123, 124, 125, and 126), Keck (ID: 127), and Hale (ID: 128) are overlaid in cyan (Hα for galaxies 124, 125, 127, and 128; [O ii] λ3727 (refers to the sum of [O ii] λ3726 and [O ii] λ3729) for galaxies 123 and 126 owing to the absence of Hα). The second candidate optical counterpart of galaxy 123 is also shown, both image and spectrum ([O ii] λ3727 captured by BTA), in orange.
Download figure:
Standard image High-resolution imageIn order to further confirm the detections, we split our raw data in two (P1 and P2). The P1 data are from observations performed between 2019 August 25 and 2020 March 1; P2 data are from observations between 2020 March 2 and 2020 May 22. Both sets of data have similar integration times, yielding two independent cubes. Each cube has higher noise by a factor of  . Using similar line widths and beam sizes, H i column-density images and spatially integrated spectra were produced from both data sets. All six detections were identified in both P1 and P2 cubes. Cubes from two individual polarization channels also show the reality of the six detections.
The H i properties of the six galaxy candidates are listed in Table 1 (more details in Appendix C, Table 2). They lie in the redshift range of 0.389 < z < 0.402 and have logarithmic H i masses,  , between 10.37 and 10.93. The most H i-massive galaxy candidate (ID 124) has the largest H i mass to date. Considering the 1σ uncertainty, it is slightly more massive than Malin 1 (
 ; Lelli et al. 2010; Huang et al. 2014), HIZOA J0836–43 (
 ; Kraan-Korteweg et al. 2005; Cluver et al. 2010), or the two highest-mass HIGHz (Catinella & Cortese 2015) galaxies (J160938.00+312958.5 and J165940.12+344307.8, both with a H i mass of
  ). A caveat is that the H i mass may have contributions from other galaxies at the same redshift within the FAST beam. This requires high angular resolution observations and prohibitively long integration times (e.g., a few hundred hours with the VLA to detect them at S/N = 5).
Table 1. The H i and Optical Properties of the Six High-redshift Galaxy Candidates
| H i Properties | Optical Properties | |||||||||
|---|---|---|---|---|---|---|---|---|---|---|
| ID | R.A., decl. (J2000) | z |

|

| R.A., decl. (J2000) | z |

|

| Offset | Δcz |
| - | HH:MM:SS.S ± DD:MM:SS | − | km s−1 |

| HH:MM:SS.S ± DD:MM:SS | − |

|
 [ [ |
 kpc kpc | km s−1 |
| (1) | (2) | (3) | (4) | (5) | (6) | (7) | (8) | (9) | (10) | (11) |
| 123 | 08:17:47.1, +22:17:14 | 0.38867 (2) | 587 (6) | 10.54 (0.04) | 08:17:45.4, +22:17:20 | 0.38860 (21) | 11.28 (0.09) | 0.18 (0.45) | 127 (120) | 21 (39) |
| 124 | 08:18:06.6, +22:25:35 | 0.39072 (2) | 372 (8) | 10.93 (0.04) | 08:18:06.3, +22:25:19 | 0.39070 (10) | 10.97 (0.09) | 1.10 (0.14) | 87 (114) | 7 (19) |
| 125 | 08:16:46.2, +22:11:49 | 0.39563 (2) | 427 (18) | 10.51 (0.04) | 08:16:48.1, +22:11:52 | 0.39600 (10) | 11.12 (0.08) | 0.88 (0.18) | 148 (125) | 112 (31) |
| 126 | 08:17:00.7, +22:04:58 | 0.39612 (1) | 366 (2) | 10.37 (0.04) | 08:17:01.3, +22:06:13 | 0.39610 (10) | 11.25 (0.09) | 0.03 (0.37) | 401 (156) | 7 (19) |
| 127 | 08:17:04.2, +22:22:11 | 0.39819 (5) | 478 (16) | 10.79 (0.05) | 08:17:06.4, +22:22:00 | 0.39774 (3) | 10.60 (0.13) | −0.20 (0.36) | 170 (129) | 136 (19) |
| 128 | 08:17:53.2, +22:09:44 | 0.40199 (4) | 258 (17) | 10.56 (0.05) | 08:17:55.0, +22:09:51 | 0.40158 (10) | 10.92 (0.09) | 1.10 (0.22) | 145 (126) | 134 (33) |
Note. Column (1) shows the candidate ID in the FUDS0 catalog. The J2000 coordinates and redshifts from the H i emission line are given in columns (2) and (3), and the rest-frame line width ( ), corrected for instrumental resolution, is given in column (4) (the frequency resolution is 22.9 kHz, equivalent to 6.8 km s−1 at z ≈ 0.4). The logarithmic H i mass is given in column (5). J2000 coordinates of the identified optical counterparts are listed in column (6), while the spectroscopic redshift is given in column (7). Logarithmic stellar mass (M*) and SFR are given in columns (8) and (9), respectively. Column (10) lists the spatial offset in
  kpc for fitted H i positions from their identified optical counterparts. Column (11) gives their velocity separation in km s−1. The 1σ uncertainties are given in parentheses.
Download table as: ASCIITypeset image
3. Discussion
The comoving volume in the FUDS0 survey at 0.38 < z < 0.42 is  Mpc3. We computed the completeness, cosmic variance, and detectable volume for the six galaxies by following the methods used for the Arecibo Ultra-Deep Survey (AUDS; Hoppmann et al. 2015; Xi et al. 2021). The
  method (Schmidt 1968) gives us a higher H i mass function (H i MF;
  at
at  ) than that from local surveys HIPASS and ALFALFA. This indicates a more extended H i MF at the high-mass end, more massive H i galaxies than in the local Universe, and significant evolution over the last ∼4.2 Gyr. The full AUDS catalog (Xi et al. 2021) previously suggested a weak evolutionary trend for an increase of the characteristic mass of the H i MF with increasing redshift. Our result is consistent with this trend and may indicate rapid gas consumption following the epoch of peak star formation density at z ≈ 2. Again, our result is an upper limit on the H i MF taking into account the confusing mass.
In our sample, all six optical counterparts are found within a spatial separation of  Mpc (the 3σ uncertainty of fitted H i positions) and a velocity separation of <200 km s−1. Four candidates (ID: 123, 124, 125, and 126) have spectroscopic confirmations from the unreleased data of DESI (DESI Collaboration et al. 2016a, 2016b). The optical counterparts of the two remaining galaxy candidates (ID: 127 and 128) were identified in spectroscopic observations using the Keck
15
and Hale
16
telescopes, respectively. For galaxy 123, our Big Telescope Alt-azimuth (BTA) data reveal a second candidate optical counterpart at a similar redshift. Being further from the beam center, this is not the preferred counterpart. Nevertheless, it may contribute confusing flux to the H i spectrum. The Hα
(or [O ii], if both Lyman and Balmer series are not detected) emission lines are overlaid on top of H i spectra in Figure 1 (refer to Appendix D for the whole optical spectra). To derive the stellar mass (M*) and star formation rate (SFR), we employed MAGPHYS
17
(da Cunha et al. 2008, 2012) to fit the spectral energy distributions (SEDs). The optical data cover five bands (u, g, r, i, and z) from the Sloan Digital Sky Survey (SDSS), while the IR data cover four bands (W1, W2, W3, and W4) from the Wide-field Infrared Survey Explorer (WISE
18
; Wright et al. 2010). In Appendix D, we describe the fitting method in more detail. The optical properties are listed in Table 1 (more details given in Appendix D, Table 3). The SEDs are also shown in Appendix D, Figure 6.
Mpc (the 3σ uncertainty of fitted H i positions) and a velocity separation of <200 km s−1. Four candidates (ID: 123, 124, 125, and 126) have spectroscopic confirmations from the unreleased data of DESI (DESI Collaboration et al. 2016a, 2016b). The optical counterparts of the two remaining galaxy candidates (ID: 127 and 128) were identified in spectroscopic observations using the Keck
15
and Hale
16
telescopes, respectively. For galaxy 123, our Big Telescope Alt-azimuth (BTA) data reveal a second candidate optical counterpart at a similar redshift. Being further from the beam center, this is not the preferred counterpart. Nevertheless, it may contribute confusing flux to the H i spectrum. The Hα
(or [O ii], if both Lyman and Balmer series are not detected) emission lines are overlaid on top of H i spectra in Figure 1 (refer to Appendix D for the whole optical spectra). To derive the stellar mass (M*) and star formation rate (SFR), we employed MAGPHYS
17
(da Cunha et al. 2008, 2012) to fit the spectral energy distributions (SEDs). The optical data cover five bands (u, g, r, i, and z) from the Sloan Digital Sky Survey (SDSS), while the IR data cover four bands (W1, W2, W3, and W4) from the Wide-field Infrared Survey Explorer (WISE
18
; Wright et al. 2010). In Appendix D, we describe the fitting method in more detail. The optical properties are listed in Table 1 (more details given in Appendix D, Table 3). The SEDs are also shown in Appendix D, Figure 6.
We now compare the H i properties with the derived stellar properties, namely, M*, SFR, stellar mass surface density ( ), and concentration index (R90/R50), comparing with galaxies from the extended GALEX Arecibo SDSS survey
19
(xGASS; Catinella et al. 2018), CHILES, and the HIGHz (Catinella & Cortese 2015) sample of 39 H i galaxies with 0.17 < z < 0.25. This gives us an insight into possible evolution in the properties of the most H i-massive galaxies. Considering possible confusion, our results are upper limits for MH i
and the gas fraction (fH i
= MH i
/M*). In the upper panels of Figure 2, MH i
is shown as a function of M* and SFR. The FUDS galaxy candidates clearly have large values of MH i
and SFR but consistent with the properties of HIGHz galaxies. Unsurprisingly, the FUDS candidates also have high M*, though not quite as high as the highest in xGASS. Given the tightness of the MH i
–SFR correlation, depletion times (the ratio of the two) are also consistent with xGASS and HIGHz galaxies. In the lower panels of Figure 2, the gas fraction is shown as a function of μ* and R90/R50. The FUDS candidates show reasonable consistency with the xGASS scaling relations. The gas fractions for the FUDS candidates are high, though well below the most gas-rich galaxies in xGASS. Values for μ* and R90/R50 are low but consistent with HIGHz galaxies and the trend for xGASS galaxies. Low values for μ*, indicative of a large halo spin parameter, are also consistent with the ALFALFA HIghMass (Huang et al. 2014) sample. Therefore, the FUDS galaxies appear to be extreme high-H i mass analogs of galaxies in the local Universe, with properties similar to the lower-redshift, SFR-selected HIGHz sample. The results here indicate that such galaxies are more numerous at z ≈ 0.4 than in the local Universe, therefore suggesting significant evolution over the last ∼4.2 Gyr. Although there is only a single CHILES galaxy at a similar redshift (z = 0.376), it has similar properties to the FUDS candidates, albeit with a higher SFR, and is therefore consistent with this picture.
), and concentration index (R90/R50), comparing with galaxies from the extended GALEX Arecibo SDSS survey
19
(xGASS; Catinella et al. 2018), CHILES, and the HIGHz (Catinella & Cortese 2015) sample of 39 H i galaxies with 0.17 < z < 0.25. This gives us an insight into possible evolution in the properties of the most H i-massive galaxies. Considering possible confusion, our results are upper limits for MH i
and the gas fraction (fH i
= MH i
/M*). In the upper panels of Figure 2, MH i
is shown as a function of M* and SFR. The FUDS galaxy candidates clearly have large values of MH i
and SFR but consistent with the properties of HIGHz galaxies. Unsurprisingly, the FUDS candidates also have high M*, though not quite as high as the highest in xGASS. Given the tightness of the MH i
–SFR correlation, depletion times (the ratio of the two) are also consistent with xGASS and HIGHz galaxies. In the lower panels of Figure 2, the gas fraction is shown as a function of μ* and R90/R50. The FUDS candidates show reasonable consistency with the xGASS scaling relations. The gas fractions for the FUDS candidates are high, though well below the most gas-rich galaxies in xGASS. Values for μ* and R90/R50 are low but consistent with HIGHz galaxies and the trend for xGASS galaxies. Low values for μ*, indicative of a large halo spin parameter, are also consistent with the ALFALFA HIghMass (Huang et al. 2014) sample. Therefore, the FUDS galaxies appear to be extreme high-H i mass analogs of galaxies in the local Universe, with properties similar to the lower-redshift, SFR-selected HIGHz sample. The results here indicate that such galaxies are more numerous at z ≈ 0.4 than in the local Universe, therefore suggesting significant evolution over the last ∼4.2 Gyr. Although there is only a single CHILES galaxy at a similar redshift (z = 0.376), it has similar properties to the FUDS candidates, albeit with a higher SFR, and is therefore consistent with this picture.

Figure 2. The relations between H i (H i mass and gas fraction) and optical/IR (stellar mass, SFR, stellar mass surface density, and concentration index) properties. Note that we use the H i mass as upper limits (red plus signs) for our six galaxy candidates. For comparison, the distribution of xGASS galaxies is also shown with the gray dots. The light green triangles represent H i upper limits in xGASS. The galaxies from HIGHz and CHILES are shown by green squares and the orange dot, respectively.
Download figure:
Standard image High-resolution imageFurthermore, using the stacking technique at higher redshift (z ≈ 1), optically selected blue galaxies appear to have H i masses that are a factor of 3.5 higher for their stellar mass than their z = 0 counterparts (Chowdhury et al. 2021, 2022). Depletion timescales have also been reported to be lower at this redshift (Chowdhury et al. 2021, 2022) and at intermediate redshifts (z ≈ 0.35; Sinigaglia et al. 2022; Bera et al. 2023). Considering the possible confusion, the real depletion time in our sample could be lower and more consistent with CHILES. These results therefore also seem consistent with a galaxy evolution picture where gas consumption exceeds gas replenishment for high-mass galaxies following the peak of SFR density at "cosmic noon," following which there is an almost exponential decrease of their H i mass with time and a gradual truncation of the high-mass cutoff in the H i MF from high redshift to low redshift. In the immediate future, the ongoing "blind" FUDS survey will provide even more direct detections of individual galaxies in a larger survey volume and therefore a more accurate measurement of the evolution of the H i MF, allowing further exploration of the cool gas evolution of galaxies out to z ≈ 0.4. Future observations with the Square Kilometre Array will offer the possibility of both high sensitivity and high angular resolution and so will avoid the requirement to confirm optical counterparts through deep optical spectroscopy.
4. Summary
The FUDS is a deep, blind H i galaxy survey designed to explore the evolutionary trend in the cool gas content of galaxies. We have now completed the observation and data reduction for the first of the six target fields, FUDS0. In this paper, we focus on the highest-redshift detections in the field. The main findings are summarized below.
- 1.Six galaxies are discovered through blind detection in 21 cm emission line observations with redshifts z > 0.38. These are at the redshift limit of the 19-beam FAST receiver and the first such direct detections at this redshift to date, other than through gravitational lensing.
- 2.All have optical counterparts identified using data from DESI or from new spectroscopic observations, which we conducted with the Hale, BTA, and Keck telescopes.
- 3.Comparison with galaxies in xGASS reveals that the six galaxies are extreme high-H i mass analogs of galaxies in the local Universe.
- 4.The significantly larger H i MF that is implied for high-mass galaxies at z ≈ 0.4 indicates their significant consumption of cool gas over the last ∼4.2 Gyr.
Acknowledgments
This work made use of the data from the Five-hundred-meter Aperture Spherical radio Telescope (FAST). FAST is a Chinese national megascience facility, operated by the National Astronomical Observatories, Chinese Academy of Sciences. The work is supported by the National Key R&D Program of China under grant No. 2018YFA0404703 and the FAST Collaboration. Parts of this research were supported by the Australian Research Council Centre of Excellence for All Sky Astrophysics in 3 Dimensions (ASTRO 3D) through project No. CE170100013. This research used data obtained with the Dark Energy Spectroscopic Instrument (DESI). DESI construction and operations are managed by the Lawrence Berkeley National Laboratory. This material is based upon work supported by the U.S. Department of Energy (DOE), Office of Science, Office of High-Energy Physics, under contract No. DEAC0205CH11231, and by the National Energy Research Scientific Computing Center, a DOE Office of Science User Facility under the same contract. Additional support for DESI was provided by the U.S. National Science Foundation (NSF), Division of Astronomical Sciences, under contract AST-0950945 to the NSF's National Optical-Infrared Astronomy Research Laboratory; the Science and Technology Facilities Council of the United Kingdom; the Gordon and Betty Moore Foundation; the Heising-Simons Foundation; the French Alternative Energies and Atomic Energy Commission (CEA); the National Council of Science and Technology of Mexico (CONACYT); the Ministry of Science and Innovation of Spain (MICINN); and the DESI Member Institutions. 20 Any opinions, findings, and conclusions or recommendations expressed in this material are those of the authors and do not necessarily reflect the views of the NSF, the DOE, or any of the listed funding agencies. H.Z. and S.X. acknowledge support from the National Natural Science Foundation of China with grant 12120101003 and the National Key R&D Program of China with grant 2022YFA1602902. J.W. is supported by the National Natural Science Foundation of China under grants 12173009 and the Natural Science Foundation of Guangxi (2020GXNSFDA238018). Y.Y. appreciates the generous financial support provided to the supernova group at U.C. Berkeley (PI: A.V. Filippenko) by Gary and Cynthia Bengier, Clark and Sharon Winslow, Sanford Robertson, and numerous other donors. A.V.F.'s group has received additional financial assistance from the Christopher R. Redlich Fund, Alan Eustace (W.K.Z. is a Eustace Specialist in Astronomy), Briggs and Kathleen Wood (T.G.B. is a Wood Specialist in Astronomy), and many other donors. The data presented herein were obtained in part at the W. M. Keck Observatory, which is operated as a scientific partnership among the California Institute of Technology, the University of California, and the National Aeronautics and Space Administration (NASA); the observatory was made possible by the generous financial support of the W. M. Keck Foundation. This research also uses data obtained through the Telescope Access Program (TAP). Z.H. would like to acknowledge support received from the CAS Project for Young Scientists in Basic Research (No. YSBR-063). Observations with the SAO RAS 6m telescope are supported by the Ministry of Science and Higher Education of the Russian Federation. The analysis of SCORPIO-2 spectra was performed as part of the SAO RAS government contract approved by the Ministry of Science and Higher Education of the Russian Federation. The authors would like to thank Guo Chen for help with the optical observations by the Palomar P200 telescope and Dr. Marat Musin for timely coordination of the Directors Discretionary Time observation using the 6 m BTA telescope at SAO.
Facilities: FAST - Fast Auroral SnapshoT explorer satellite, Hale - Palomar Observatory's 5.1m Hale Telescope, BAT - Bolshoi Azimuthal Telescope, Keck:I - KECK I Telescope
Software: astropy (Astropy Collaboration et al. 2013, 2018), LPipe (Perley 2019), Pypeit (Prochaska et al. 2020a, 2020b), slinefit (Schreiber et al. 2018).
Appendix A: Observations
The FUDS survey consists of six target fields aiming at exploring the gas evolution in galaxies.The FUDS0 field covers an area of 0.72 deg2 and was chosen to overlap with the GAL2577 field of the AUDS (Freudling et al. 2011; Hoppmann et al. 2015; Xi et al. 2021). AUDS has a lower sensitivity (∼75 μJy beam−1) and a smaller redshift coverage (z < 0.16) than FUDS but nevertheless provides a useful comparison with the FAST results in order to verify the calibration and data reduction methods. An important selection criterion is the avoidance of strong continuum sources. In the NVSS catalog (Condon et al. 1998), there are four continuum sources with flux densities greater than 50 mJy in or close to the FUDS0 field. The strongest source is located at R.A. (J2000) = 08h17m35s, decl. (J2000) = +22°37'119 with a 20 cm flux density of 1.28 Jy.
The observations were taken between 2019 August 25 and 2020 May 22, mostly during the FAST commissioning phase. The FUDS0 field was scanned in both the R.A. and decl. directions with the 19-beam receiver in OTF mode (Xi et al. 2022). The 500 MHz bandwidth (1.0–1.5 GHz) was split into 65,536 channels, which gives a frequency resolution of 7.63 kHz (with equivalent velocity resolution of 2.25 km s−1 at z = 0.4). The spectra were recorded with a 1 s integration time. The total observation time was 129 hr, consisting of 15 hr on the calibrator, 95 hr on FUDS0, and 19 hr overhead.
Appendix B: Data Reduction
The data reduction method has been previously described (Xi et al. 2022). The final cube for the FUDS0 field covers 1° × 1°, as shown in the left panel of Figure 3, with a pixel size of  . The gridded beam size is
  at z = 0.4, and its associated frequency dependence is given in our previous study (Xi et al. 2022). The Hanning-smoothed cube has a frequency resolution of 22.9 kHz (6.76 km s−1 at z = 0.4). Since the field is not uniformly sampled, the noise rises from the center to the edge, with the lowest noise being about 50 μJy beam−1 in the RFI-free frequency range in the center of the field.
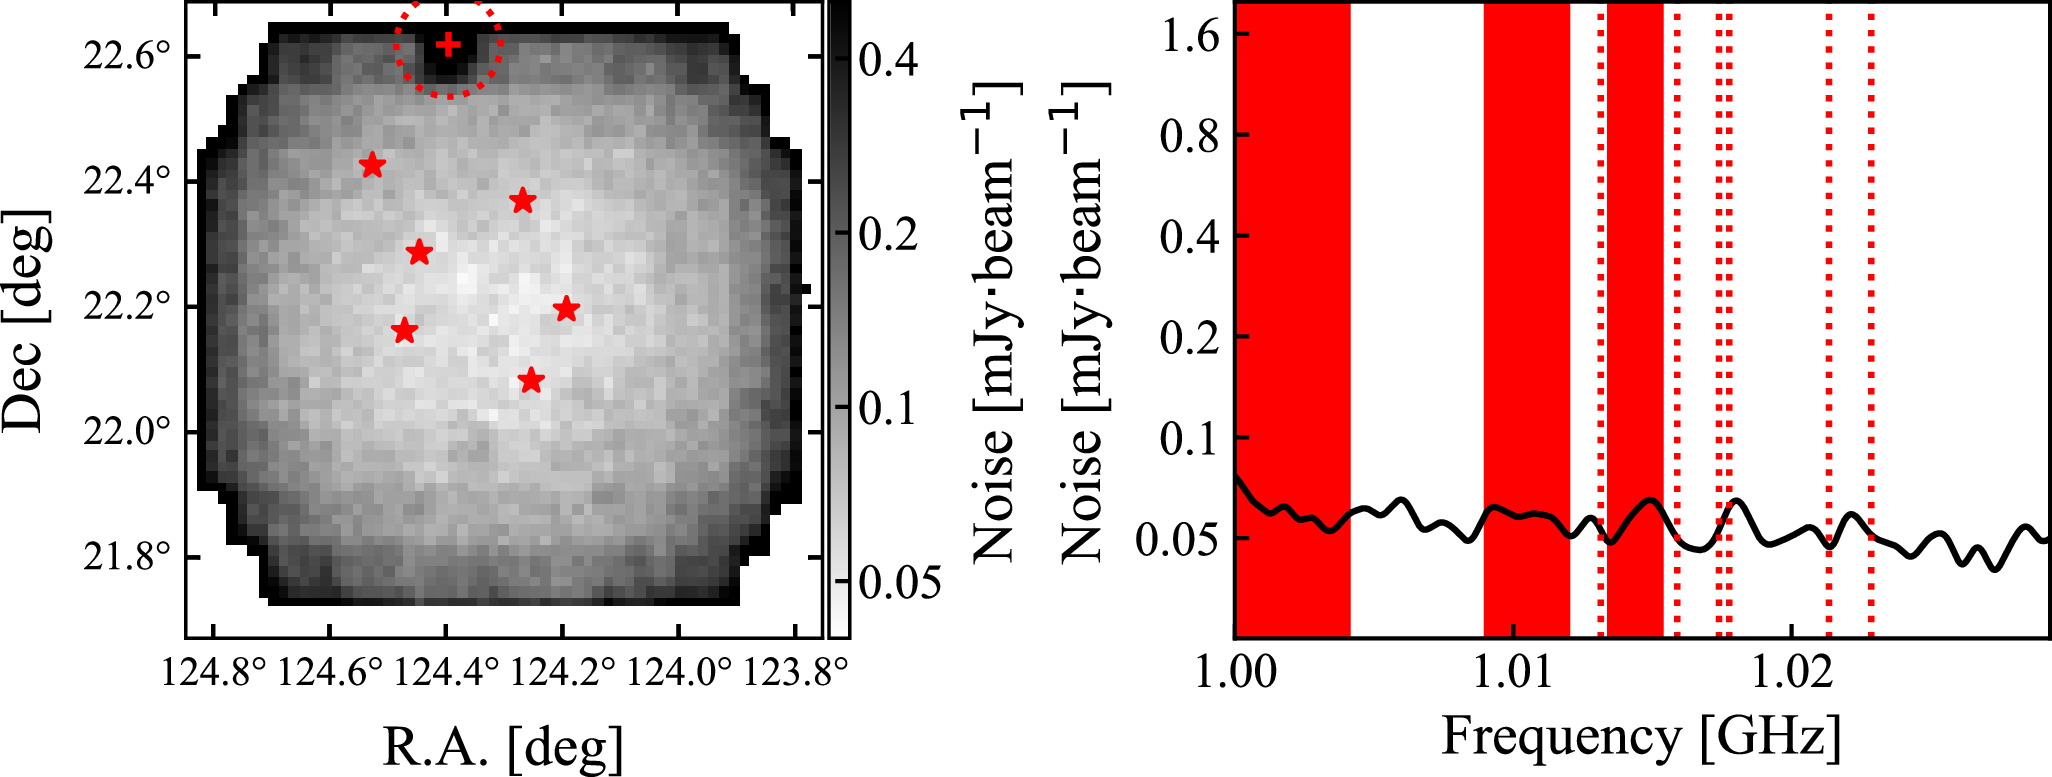
Figure 3. Left panel: the spatial rms distribution at 1.02 GHz. The red plus sign indicates the position of the strongest continuum source in the field. The dotted red circle shows the extent of pixels strongly influenced by the continuum source. The red stars indicate the locations of the six galaxy candidates. Right panel: the rms as a function of frequency for the central pixel of the final cube. The red bands show the frequency ranges strongly impacted by RFI. The frequencies of the six candidates are given by red dotted lines.
Download figure:
Standard image High-resolution imageWe used the flagging procedures developed in our previous study (Xi et al. 2022). Most flagging is associated with external RFI, such as radar (∼1.09 GHz), GNSS (1.15–1.30 GHz), and the geostationary AsiaStar satellite (∼1.48 GHz). FAST also suffered from strong RFI generated by the compressor for the refrigerating dewar before 2021 August. Our flagging method was carefully designed to be robust against this RFI. The total flagged fraction is about 24%, including the H i emission line from the Milky Way.
In order to examine the noise distribution in the final data cube, we followed the procedures described previously (Hoppmann et al. 2015). For each voxel, we calculated the rms over the channels within ±150 km s−1, excluding any channels containing detections. The noise cube was then smoothed with a Gaussian function (σ = 100 km s−1) within ±200 km s−1. The resulting spatial noise distribution at 1.02 GHz is shown in the left panel of Figure 3. The lowest noise is distributed around the field center. There is excess residual noise from a strong continuum source (Sν = 1.28 Jy) at the upper edge. This impacts the detectability of nearby sources. The right panel shows the central rms noise as a function of frequency between 1.0 and 1.029 GHz (z = 0.38). Internal RFI has a modest impact on the rms noise level, but its presence causes poor baselines and difficulty in identifying faint sources. Frequencies where source identification was strongly affected are shown in red in the panel.
Appendix C: Detections
The algorithm used for the source finding is similar to that of our RFI finder (see Section 4.1 in Xi et al. 2022). The finder provides masks for detected signals and flattens the spectral baselines using polynomial functions. Detections with small spatial (<2 pixels in either R.A. or decl.) or frequency (<5 channels) extent are removed from our candidate list. Criteria for true detections are (1) peak flux density ∣Speak∣ ≥ 7σ, where σ is the local rms in the smoothed spectrum; (2) ∣Speak∣ ≥ 5σ plus a distinct double-horn feature in the line profile or with a beam-sized spatial extent; or (3) ∣Speak∣ ≥ 5σ with matched redshifts from other surveys, including SDSS DR16 (Ahumada et al. 2020), AUDSOC (Hoppmann 2014), and AUDS (Xi et al. 2021). Negative detections that satisfy the above criteria were included for reliability analysis. The source finder did not separate galaxies joined in both spatial extent and frequency. These were later separated manually wherever possible based on their moment-zero maps.
Many false-negative detections were found around the strong continuum source or close to RFI frequencies. These detections were removed if they were within  of the strongest continuum source (the dotted red line in the left panel of Figure 3) or within the red bands in the right panel of Figure 3, unless they satisfied at least one of these criteria: distinct double-horn features, beam-sized spatial extent, or spectroscopic redshift. Finally, we detected six sources at 0.38 < z < 0.42. No negative signals satisfying our selection criteria were detected in this redshift range; the reliability for the six galaxies is therefore high. Figure 3 shows their positions in space and frequency in the FUDS0 field. The contours of the column density and spectra of the six galaxies are given in Figure 1 in the main text.
Since the physical beam size of FAST is about 1.32  Mpc at z = 0.4, it is reasonable to treat these high-redshift galaxies as point sources. We used a 2D Gaussian function with a fixed FWHM intensity corresponding to the model beam size in the final cube (Xi et al. 2022) to fit the moment-zero map (see Figure 4) to derive the position (R.A. and decl.). The spatial-integrated spectrum is derived from

where Iij (ν) is the intensity in pixels with indices of i and j, wij is the amplitude of the 2D Gaussian fit, and ΔxΔy is the solid angle of the pixel. The spatial-integrated spectra are shown in the lower panels of Figure 1 in the main text.
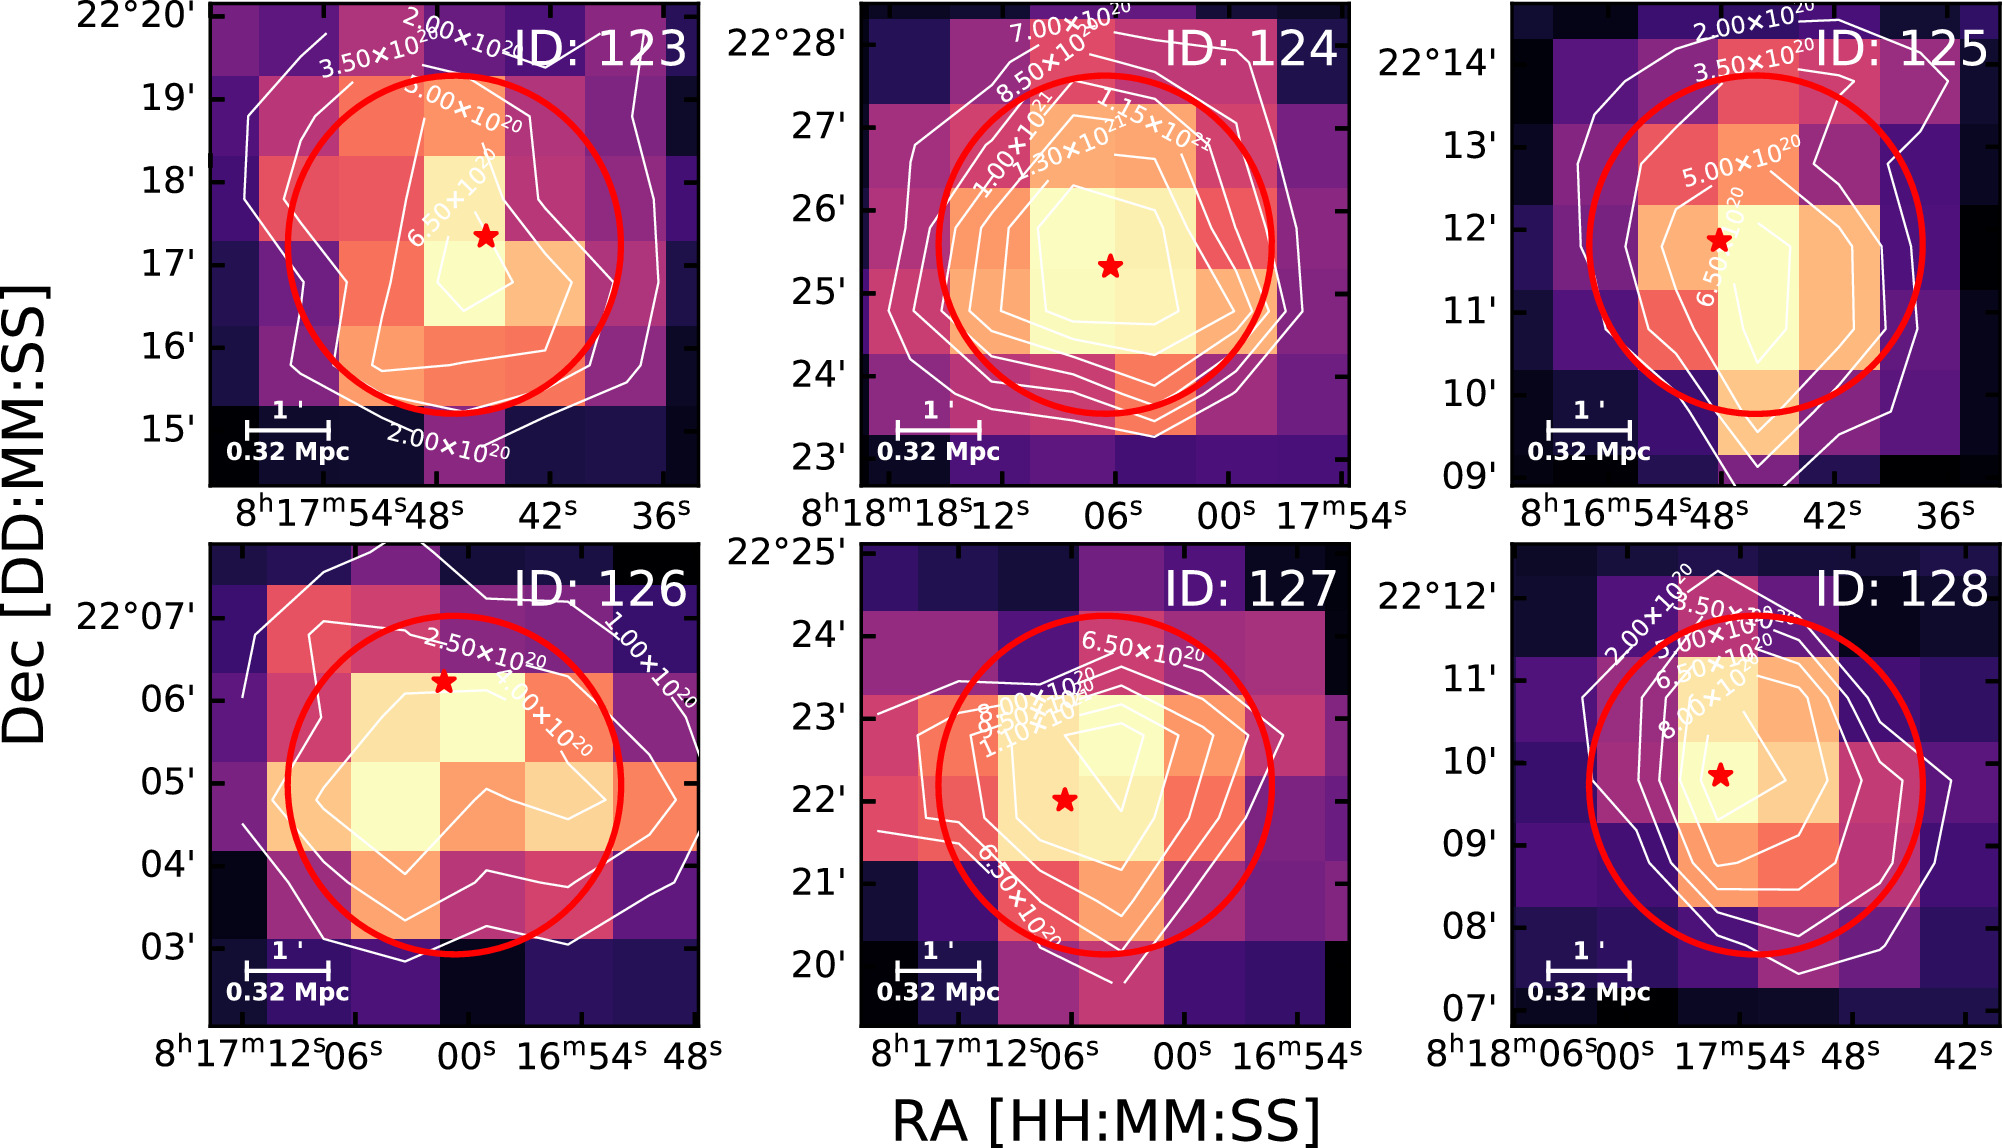
Figure 4. The moment-zero maps of the six galaxies from the final cube. The contours of column density are displayed by white lines. The red circles are the beam size in the final cube. The red stars indicate the positions of optical counterparts.
Download figure:
Standard image High-resolution imageWe used the busy function (Westmeier et al. 2014) to fit the spatially integrated spectrum to derive the integrated flux Sint, flux-density-weighted frequency νcen, peak flux density Speak(ν), and line width W50 and W20. In order to compare with previous work, we correct for the instrumental effect on the line width using

where WCor is the corrected line width, W is the line width in units of Hz derived by fitting the busy function, and fins is the frequency resolution (22.9 kHz; equivalent velocity resolution 6.76 km s−1 at z = 0.4).
Considering that some galaxy candidates are detected close to RFI, where the spectral baseline may not be flat, the busy function can underestimate the parameter uncertainties. Hence, we employed the following jackknife method to estimate their uncertainties by taking into account thermal noise and baseline noise around the galaxy spectral profiles.
- 1.The noise spectrum is extracted by subtracting the best-fit busy function from the spatially integrated spectrum.
- 2.The noise spectrum is fractionally shifted by 1/30 of its length. An artificial spectrum is generated by summing the noise spectrum and the best-fit busy function.
- 3.The artificial spectrum is refitted with a busy function.
- 4.The above process is repeated 30 times to generate a set of 30 values for each parameter. The parameter uncertainty is estimated from the standard deviation of each set.
For flux uncertainties, we conservatively introduce a further uncertainty of 10% to account for other sources of error, including calibration, gridding, and frequency dependence. The relative errors of the flux parameters (including Sint and Speak(ν)) are given by

where  is the relative error after correction and σrel is the relative error derived by the noise-shift method.
The H i masses for the detections are derived with (Meyer et al. 2017)

where MH i
is the H i mass in  , DLum is the luminosity distance of the galaxy in
  , and Sint is the integrated flux in mJy MHz. The derived properties of the H i galaxies are listed in Table 2.
Table 2. The H i Properties of the Six High-redshift Galaxy Candidates
| ID | R.A.H i , decl.H i (J2000) | z | Sint | Speak |

|

|
|---|---|---|---|---|---|---|
| DDD | HH:MM:SS.S, ± DD:MM:SS | − | mJy MHz | mJy | MHz |

|
| (1) | (2) | (3) | (4) | (5) | (6) | (7) |
| 123 | 08:17:47.1, +22:17:14 | 0.38867 (2) | 0.156 (0.016) | 0.098 (0.013) | 2.003 (0.020) | 10.54 (0.04) |
| 124 | 08:18:06.6, +22:25:35 | 0.39072 (2) | 0.381 (0.039) | 0.444 (0.046) | 1.269 (0.028) | 10.93 (0.04) |
| 125 | 08:16:46.2, +22:11:49 | 0.39563 (2) | 0.143 (0.015) | 0.132 (0.015) | 1.450 (0.060) | 10.51 (0.04) |
| 126 | 08:17:00.7, +22:04:58 | 0.39612 (1) | 0.103 (0.010) | 0.118 (0.013) | 1.241 (0.006) | 10.37 (0.04) |
| 127 | 08:17:04.2, +22:22:11 | 0.39819 (5) | 0.266 (0.028) | 0.234 (0.026) | 1.618 (0.055) | 10.79 (0.05) |
| 128 | 08:17:53.2, +22:09:44 | 0.40199 (4) | 0.154 (0.018) | 0.266 (0.029) | 0.871 (0.056) | 10.56 (0.05) |
Note. Column (1) shows the galaxy ID in the FUDS0 catalog. The coordinates in J2000 are given in column (2), while the redshift from the H i emission line is in column (3). We list the integrated flux (Sint), peak flux density (Speak), and corrected line width ( ) in columns (4)–(6), respectively. Column (7) provides the logarithm of the H i mass. The 1σ uncertainties are given in parentheses.
Download table as: ASCIITypeset image
Appendix D: Optical Counterparts
DESI is a multiplex spectroscopic survey to explore dark energy by employing the Mayall 4 m telescope at Kitt Peak National Observatory and 5000 robotic fiber positioners (Levi et al. 2013; DESI Collaboration et al. 2016a, 2016b, 2022). The survey observes galaxies and stars selected from the DESI Legacy Imaging Surveys (Zou et al. 2017; Dey et al. 2019; Chaussidon et al. 2023; Cooper et al. 2023; Hahn et al. 2023; Moustakas et al. 2023; Myers et al. 2023; Raichoor et al. 2023; Zhou et al. 2023). The target selection was validated during the DESI Survey Validation phase (DESI Collaboration et al. 2024, 2023b; Alexander et al. 2023; Lan et al. 2023). The DESI experiment necessitates multiple supporting software pipelines and products (Brodzeller et al. 2023; Guy et al. 2023; Raichoor et al. 2023; Schlafly et al. 2023). The data are processed and analyzed by an extensive spectroscopic reduction pipeline and a template-fitting pipeline to derive classifications and redshifts for each targeted source (Brodzeller et al. 2023; Guy et al. 2023).
We found the optical counterparts of four H i galaxy candidates (ID: 123, 124, 125, and 126) in DESI survey data. The optical spectrum for galaxy candidate 127 was obtained with the Keck I 10 m telescope and the Low Resolution Imaging Spectrometer (LRIS; Oke et al. 1995) on 2023 October 19. The 5600 Å dichroic, the 600/4000 blue grism (dispersion 0.63 Å pixel−1), and the 400/8500 red grating (dispersion 1.20 Å pixel−1) provided wavelength coverage of 3150–10270 Å. The slit width was set to be 1'' during the observations, and the exposure time was 900 s. The raw data were reduced using the LPipe pipeline (Perley 2019), which performs a completely automated, end-to-end reduction of LRIS spectra. A linear combination of a linear local continuum and two Gaussian profiles (Hα and [N ii] λ6583) is adopted to model the emission line profile in the Hα region. Galaxy candidate 128 was observed on 2023 October 16 with the long-slit Double Spectrograph on the Palomar P200 telescope. A total of 35 minutes on-target exposure time yielded an optical spectrum, in which the Hα , Hβ , and [O iii] λ5007 emission lines were detected at S/N = 41.0, 5.6, and 3.9, respectively. The spectroscopic data were reduced following the Pypeit pipeline (Prochaska et al. 2020a, 2020b), and the redshift is derived using slinefit (Schreiber et al. 2018).
In our spectroscopic observations with the BTA, we discovered a second optical source (R.A. 08:17:48.26, decl. +22:17:50.7) with a similar redshift to galaxy 123 within the FAST beam. The spectrum was captured using the Spectral Camera with Optical Reducer for Photometric and Interferometric Observations (Afanasiev & Moiseev 2011) at the 6 m BTA telescope of the Special Astrophysical Observatory on 2023 December 20. The [O ii] λ
λ3726, 3729 emission and H and K Ca ii absorption corresponding to a redshift of 0.3894(5) was clearly identified. Although it is at a larger separation ( ), it may contribute additional flux to the H i spectrum. All of the galaxies in our sample are confirmed with optical spectroscopic redshifts. Methods used in the SDSS
21
were employed to remove continuum and fit the emission/absorption lines. Figure 5 displays the optical spectra of the optical counterparts with detected lines marked. We did not detect any Lyman or Balmer lines in the spectra of the galaxies with IDs 123 and 126, which indirectly implies less ionized gas. Our measurements from radio observations also show lower H i masses for these two galaxies.
), it may contribute additional flux to the H i spectrum. All of the galaxies in our sample are confirmed with optical spectroscopic redshifts. Methods used in the SDSS
21
were employed to remove continuum and fit the emission/absorption lines. Figure 5 displays the optical spectra of the optical counterparts with detected lines marked. We did not detect any Lyman or Balmer lines in the spectra of the galaxies with IDs 123 and 126, which indirectly implies less ionized gas. Our measurements from radio observations also show lower H i masses for these two galaxies.
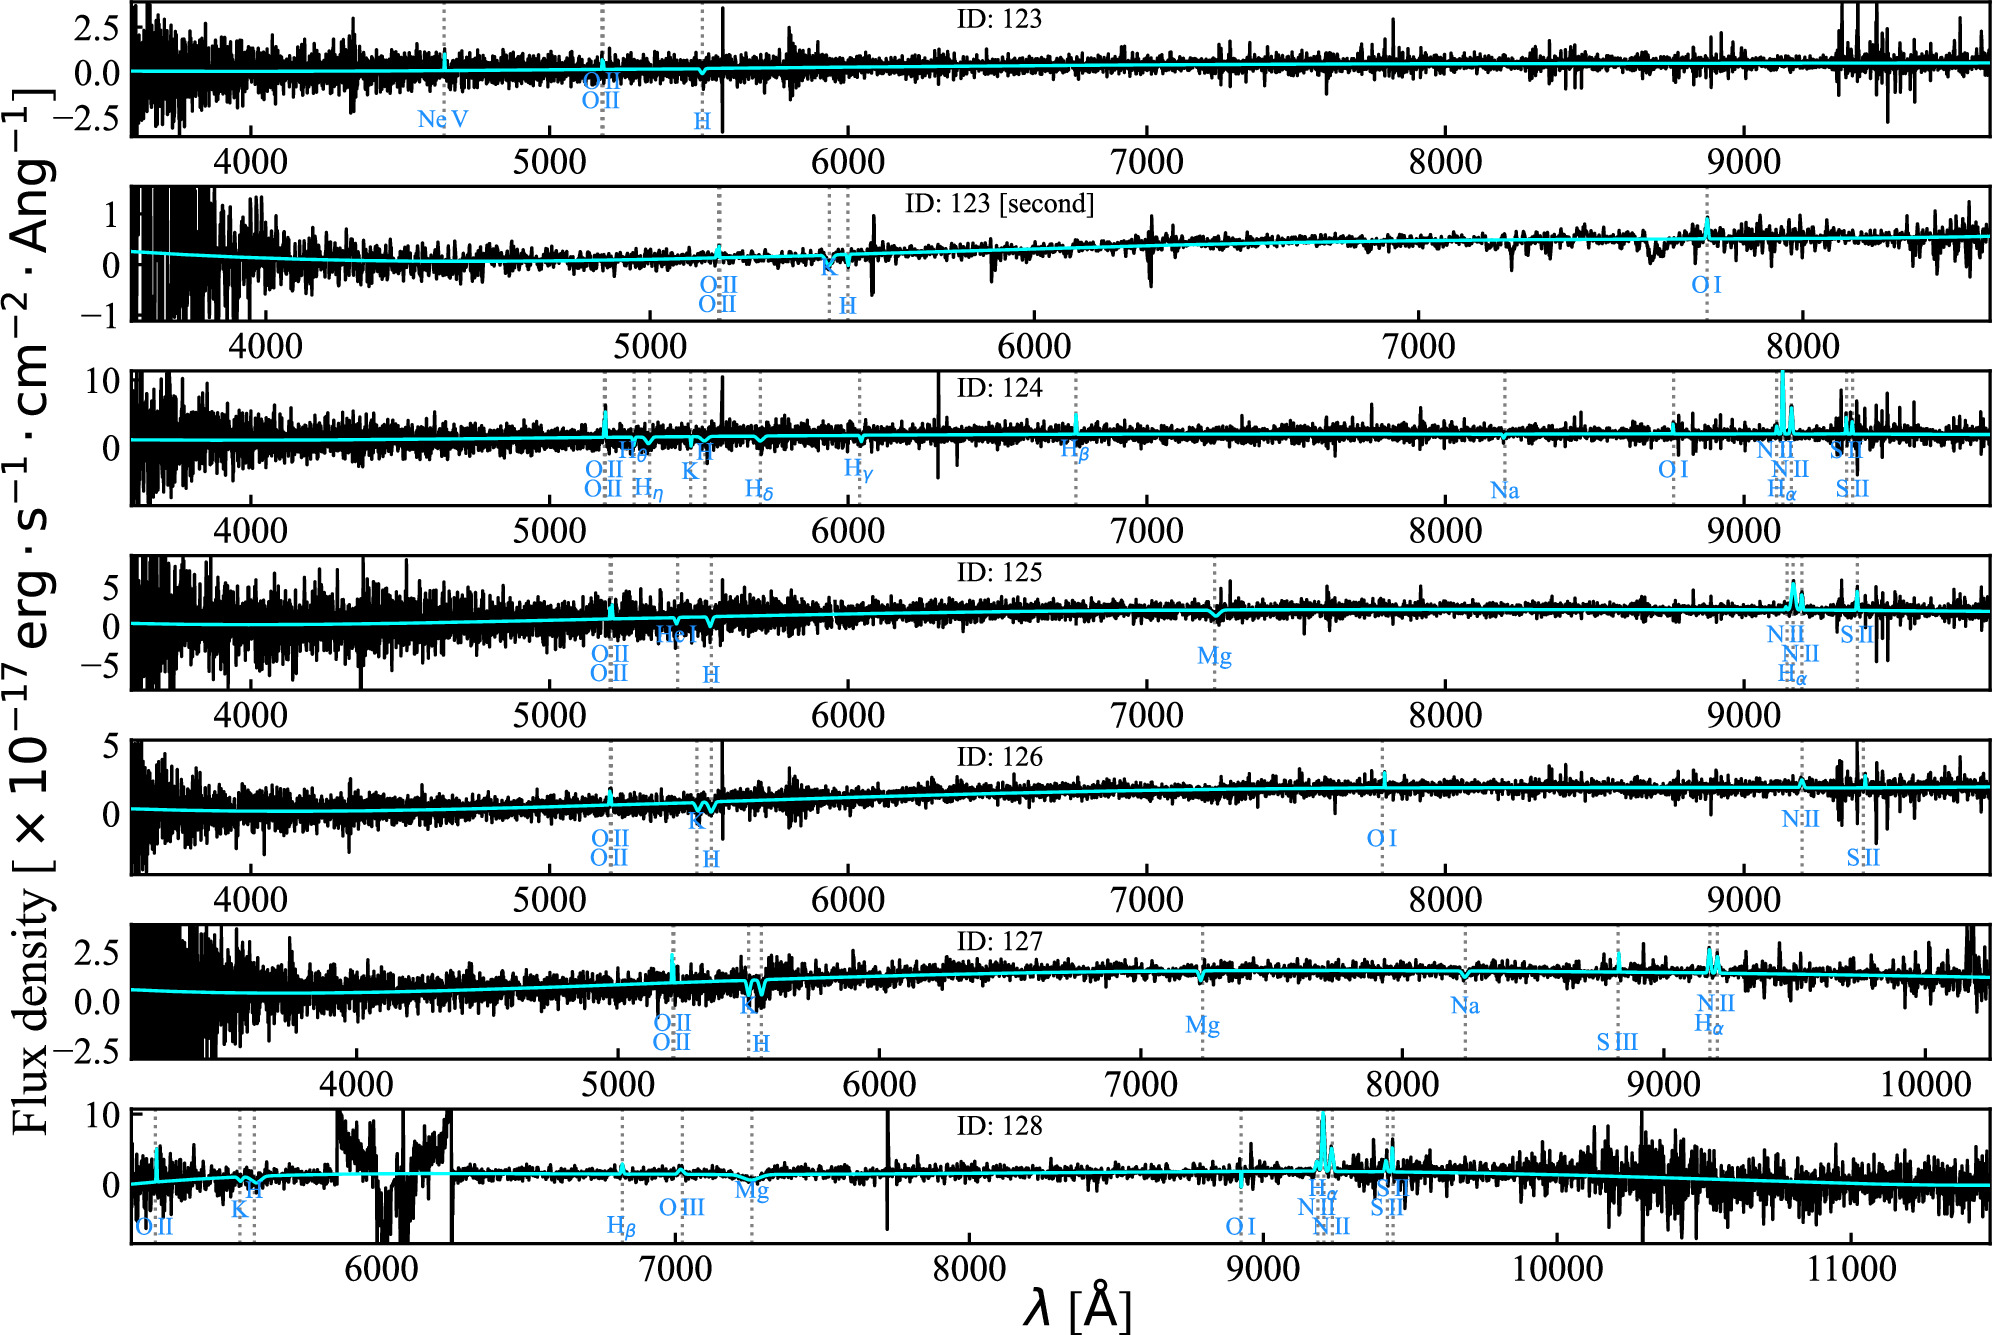
Figure 5. The optical spectra of the optical counterparts. The model continuum and lines are displayed in cyan. The detected emission/absorption lines are indicated by dotted lines. Note that the wavelength is in vacuum.
Download figure:
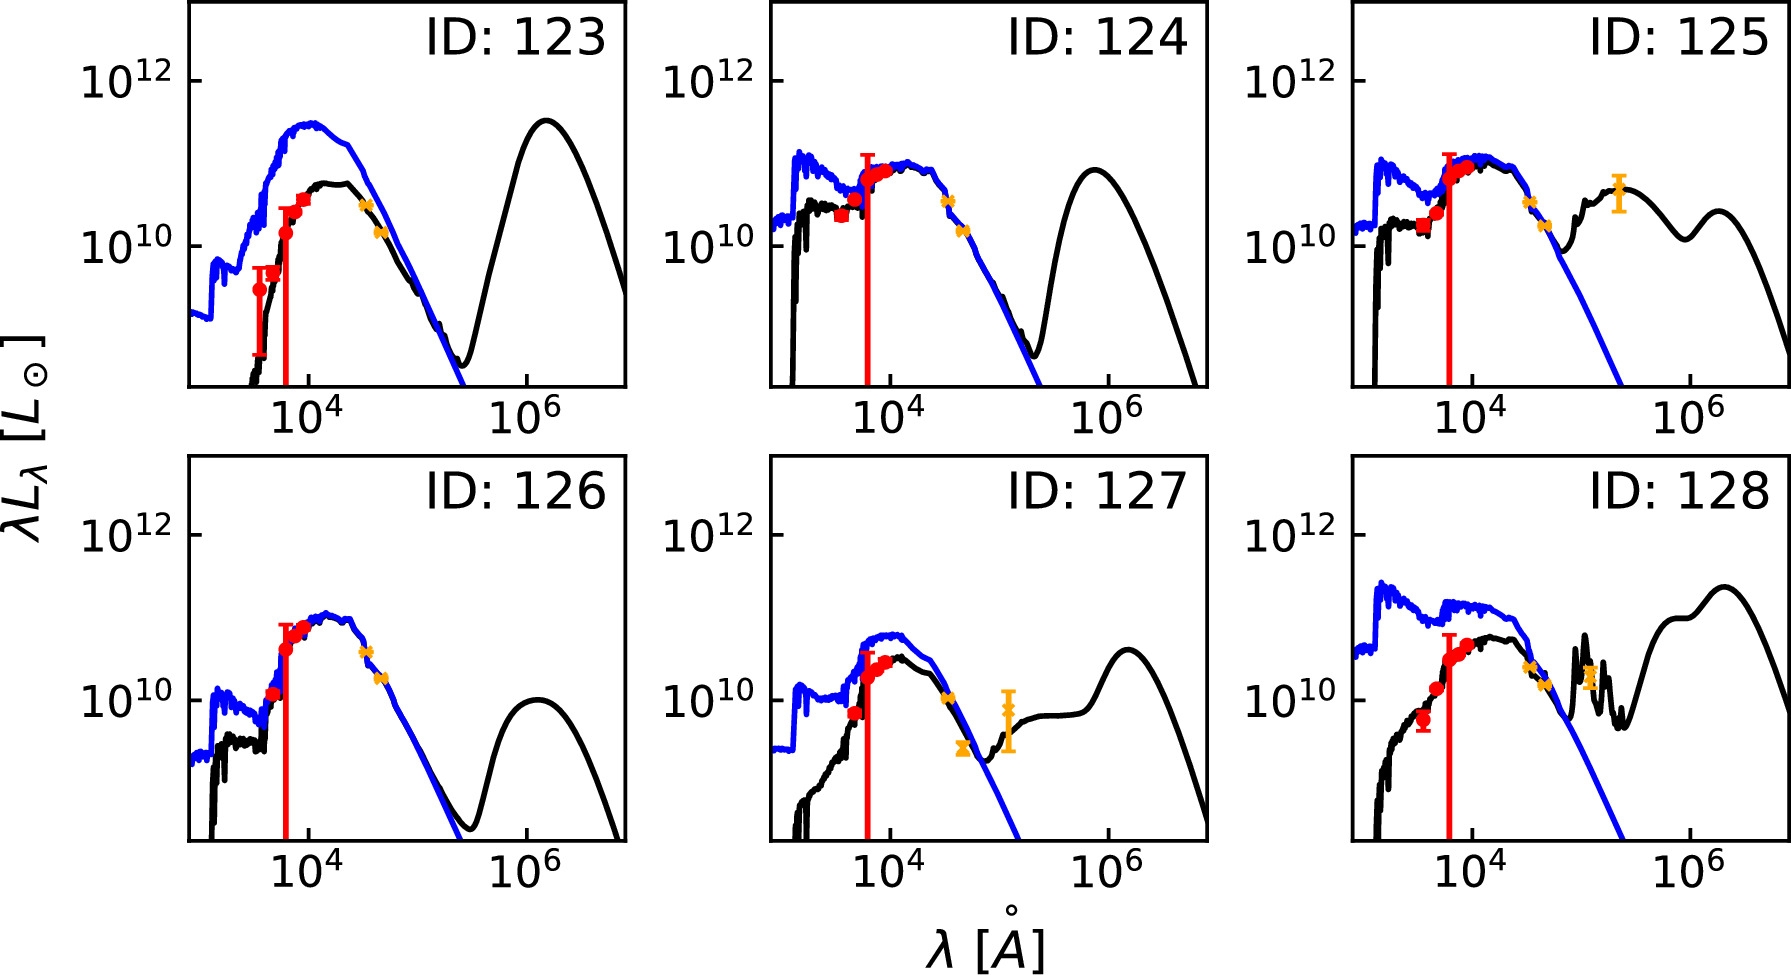
Standard image High-resolution imageWe employed MAGPHYS 22 (da Cunha et al. 2008, 2012) to fit optical/IR photometry from SDSS (u, g, r, i, and z) and WISE (W1, W2, W3, and W4) to derive the stellar mass (M*), SFR, and specific SFR (sSFR). MAGPHYS is designed for fitting the SED in the ultraviolet, optical, and near-IR bands. The code takes into account the stellar component, as well as the dust component, which attenuates stellar population spectra with emission at IR bands. In our data, we removed the bands with relative uncertainties larger than unity. The Milky Way extinction at each band was removed by using a dust-reddening map (Schlafly & Finkbeiner 2011) and a dust-extinction function (Fitzpatrick 1999). Considering the possibility of contamination of the W4 band of WISE by active galactic nuclei, we performed a refit without this band when the fit failed. This happened when the best-fit parameters with an uncertainty of 0 were derived or when the boundary of parameter space was reached. The final fit results are given in Figure 6. The best-fit parameters of the optical counterparts are listed in Table 3.
Figure 6. The SEDs for the six galaxies. The red dots represent data from SDSS, while the orange crosses represent data from WISE. The black lines show the best-fit SEDs by MAGPHYS, while the blue lines indicate the stellar spectra without attenuation by dust.
Download figure:
Standard image High-resolution image
Table 3. Properties of the Optical Counterparts of the Six H i Galaxy Candidates
| ID | R.A.Opt, decl.Opt (J2000) | z |

|

|

| Fit Flag |
|---|---|---|---|---|---|---|
| DDD | HH:MM:SS.S, ± DD:MM:SS | − |

|
 yr −1) yr −1) |

| − |
| (1) | (2) | (3) | (4) | (5) | (6) | (7) |
| 123 | 08:17:45.4, +22:17:20 | 0.38860 (21) | 11.28 (0.09) | 0.18 (0.45) | −11.12 (0.48) | Success |
| 124 | 08:18:06.3, +22:25:19 | 0.39070 (10) | 10.97 (0.09) | 1.10 (0.14) | −9.93 (0.23) | Success |
| 125 | 08:16:48.1, +22:11:52 | 0.39600 (10) | 11.12 (0.08) | 0.88 (0.18) | −10.22 (0.21) | Success |
| 126 | 08:17:01.3, +22:06:13 | 0.39610 (10) | 11.25 (0.09) | 0.03 (0.37) | −11.17 (0.36) | Success |
| 127 | 08:17:06.4, +22:22:00 | 0.39774 (3) | 10.60 (0.13) | −0.20 (0.36) | −10.77 (0.38) | Success |
| 128 | 08:17:55.0, +22:09:51 | 0.40158 (10) | 10.92 (0.09) | 1.10 (0.22) | −9.82 (0.26) | Success |
Note. Column (1) gives the ID of the detections in the FUDS0 survey. The coordinates of the SDSS galaxies are given in column (2). The spectroscopic redshift is given in column (3). The M*, SFR, and sSFR from fitting the SED by MAGPHYS are listed in columns (4)–(6), respectively. Column (7) indicates the status of the fit. The 1σ uncertainties are given in parentheses.
Download table as: ASCIITypeset image
Footnotes
- 14
- 15
- 16
- 17
- 18
- 19
- 20
- 21
- 22