Impact of typhoons on the ecological environment of the Pearl River Estuary in the summer of 2021—a study of an algal bloom event
 Xin Zhang
 Shan Gao1,2*
  Xuanliang Ji
 Xueming Zhu
 Shaojing Guo
- 1National Marine Environmental Forecasting Center, Key Laboratory of Research on Marine Hazards Forecasting, Beijing, China
- 2Southern Marine Science and Engineering Guangdong Laboratory (Zhuhai), Zhuhai, China
In the summer of 2021, two typhoons, Typhoon Cempaka and Typhoon Lupit, passed through the Pearl River Estuary (PRE), resulting in a noticeable chlorophyll-a (Chla) bloom event on the west side of the PRE. Utilizing a coupled hydrodynamic-ecological model (ROMS-CoSiNE), we investigated the changes in the marine environment during the two-typhoon period and explored the underlying mechanisms involved. Our model effectively reproduces the spatial characteristics of the typhoon-induced algal blooms. The results suggest that the westward invasion of the Pearl River plume has a predominant impact on the alterations in biochemical elements. For further quantitative analyses, we utilized the model to determine the Chla concentration budget in algal bloom region to assess the dominant mechanism, particularly focusing on horizontal advection. Our findings indicated that algal bloom events are mainly attributed to a straightforward physical mechanism, namely, phytoplankton transportation, rather than to nutrient-induced phytoplankton growth. The study also revealed that the different growth processes of the two simulated phytoplankton species did not contribute positively to the increased Chla concentrations. However, further research is needed to investigate the impacts of different phytoplankton functional groups on the marine ecological environment under the influence of typhoons. This study enhances the understanding of the response of ecological environments in coastal areas to typhoons.
1 Introduction
Typhoons, as one of the most devastating natural calamities, are powerful circular storms that form over warm tropical oceans and are characterized by low atmospheric pressures, high winds, and sometimes accompanied by heavy rains (Hazelworth, 1968; Price, 1981; Chen et al., 2013b; Zhang et al., 2021). Within the ongoing context of global warming, the probability of strong typhoons has notably increased (Wu et al., 2005; Balaguru et al., 2016). During typhoon movement, the physical structures of oceans can be altered, leading to changes in marine ecosystems (Zhao et al., 2008; Wang, 2020; Wang et al., 2022), such as affecting dynamic processes of ocean upwelling and vertical mixing and then further influence oceanic physical-biogeochemical processes, triggering strong ecological responses (Glenn et al., 2016; Yang and Hong, 2021; Zhang et al., 2021). The intensity and trajectory of a typhoon are largely determined by oceanic conditions through energy exchange during sea-air interactions. A typhoon can extract energy from warm seawater to maintain or even increase its intensity (Emanuel, 1999; Sun et al., 2017; Zhao et al., 2020; Zhang et al., 2021). The strong mixing that is caused by a typhoon result in cold subsurface water being carried to the upper layers. Typhoons also transport abundant quantities of nutrients from the subsurface to the euphotic zone, thus stimulating phytoplankton growth (Zheng and Tang, 2007b; Chen et al., 2009; Zhao et al., 2009). Moreover, this mixing facilitates the direct transfer of large amounts of chlorophyll from the subsurface layer to the upper layer (Pan et al., 2017; Wang, 2020). After a typhoon passes, there is often an anomaly in sea level, a decrease in sea surface temperature (SST), an increase in phytoplankton blooms, and an increase in primary productivity (Sun et al., 2010; Chen and Tang, 2012; Lin et al., 2014; Zhang et al., 2021). Typhoons alter ocean hydrodynamic processes, leading to a series of ecological and environmental changes (Chen et al., 2023). The different responses to biogeochemical processes induced by different typhoons primarily due to pre-typhoons sea conditions and typhoon characteristics, including intensity and trajectory (Li et al., 2022; Chen et al., 2023; Lao et al., 2023b, Lao et al., 2023c; Chen et al., 2024). These disparities affect the supply of nutrients to the upper layer, resulting in different degrees of phytoplankton response (Lao et al., 2023c).
The South China Sea (SCS) is the largest marginal sea in China and is characterized by the intersection of multiple water bodies, leading to complex water structures and frequent mixing of water masses (Zhu et al., 2019; Liu et al., 2021). The region experiences an average of 8 typhoons per year, with the majority occurring during the summer months (Pan et al., 2017; Wang, 2020). These typhoons, which originate or spread within the SCS, account for approximately 60% of the total typhoon count in the Northwest Pacific Ocean (Chen et al., 2013b). The Pearl River, the second-largest and third-longest river in China, discharges approximately 3.5×10¹¹ m3 annually and has an average runoff of 10 000 m3·s-1 (Harrison et al., 2008; Zhi et al., 2022). The majority of this flow, approximately 80%, occurs during the wet season from April to September (Lu and Gan, 2015). This runoff carries substantial amounts of nutrients, resulting in notable ecological features in the Pearl River estuary (PRE), such as eutrophication, algal blooms, and hypoxia (Harrison et al., 2008; Lai and Yin, 2014; Lu and Gan, 2015). Furthermore, the PRE is frequently impacted by typhoons with an average of about 3 typhoons passing through the PRE each year, which cause changes in the extent of the Pearl River plume (PRP) because of the change of flow field caused by wind field and the increase of Pearl River discharge (Wang and Zhang, 2021; Fang et al., 2022; Feng et al., 2022). These interactions between typhoons and the Pearl River runoff have obvious implications for the marine ecosystem in the region.
The effects of typhoons on the nearshore ecological environment in the SCS are influenced by various factors, such as the intensities and transit times of typhoons, vertical mixing, river inputs, coastal upwelling, and water transparency (Chen et al., 2017; Pan et al., 2017; Zhang et al., 2021; Jiang et al., 2023; Thompson et al., 2023). Research has shown that 44% of typhoon-triggered phytoplankton blooms occur along the coast of the SCS because of supply of nutrients to the upper oceans after typhoons (Pan et al., 2017; Chen et al., 2023). In the PRE, river runoff plays a crucial role in the spatial distribution of phytoplankton, and the southwest monsoon during the summer dominates the PRP, leading to its northeastward extension and impacting processes associated with high phytoplankton biomass (Gan et al., 2010; Ma and Zhao, 2021). The ecological impacts of the changes in the PRP on the nearshore region under the influence of typhoons are still unclear. Typhoons can cause changes in nutrients, suspended sediments, temperatures, and other factors, which in turn may lead to changes in nearshore ecological environments (Wang and Zhang, 2021; Zhang et al., 2021; Zhao et al., 2021). Most previous studies have suggested that typhoons have significant impacts on runoff, leading to increased transport of eutrophic water and subsequent algal blooms (Davis and Yan, 2004; Zheng and Tang, 2007c; Zhao et al., 2009). In addition, plumes often exhibit high phytoplankton concentrations, and it remains unclear whether the underlying cause of nearshore phytoplankton blooms that are induced by typhoons is nutrient-induced phytoplankton growth or phytoplankton transportation. Further studies are needed to better understand relative importance between them in these regions.
Due to the limitations of the current observation methods (Chang et al., 2008; Feng et al., 2022), the spatial and temporal characterizations of typhoon effects such as algal blooms are subject to certain constraints. Numerous studies have been conducted to investigate the mechanisms of oceanic responses to typhoons, primarily through satellite observations and limited field observations. For instance, Zhao et al. (2009) showed that typhoons may nourish phytoplankton biomass by inducing the transport of nutrient-rich waters from both the PRE offshore and from the sublayer to the surface. Liu et al. (2013) reported that river discharges that were induced by typhoon events were the main contributors to high phytoplankton levels. Qiu et al. (2019) demonstrated that the vertical mixing of seawater, rainfall over coastal watersheds, nutrient loads within freshwater runoff, and winds associated with typhoons are important for controlling phytoplankton dynamics in and near the PRE. Typhoons not only facilitate the upwelling of deep-seated nutrients to the upper layer but can also disrupt shallower waters and hinder phytoplankton growth, making negative contributions to nearshore environments (Liu et al., 2021; Chen et al., 2023). These studies based on satellite or field observation are characterized by the absence of continuous time series variation of variables. Several recent studies have analyzed daily cross-sectional observed data from biogeochemical Argo (BGC-Argo) and found that the obvious increase in surface phytoplankton biomass is mainly due to mixing, indicating that the surface water bursts that are affected by typhoons are mainly dominated by physical mechanisms rather than by biological processes (Chai et al., 2021; Qiu et al., 2021). These cases are rare, and the specific biological processes involved remain unclear (Jiang et al., 2023). Numerical simulations using biogeochemical models have been an effective method for studying the responses of oceans to typhoons, especially under extreme weather conditions (Pan et al., 2017; Zhang et al., 2021), and it provide continuous time series and large-scale data for comprehensive analysis. These simulations have shown that phytoplankton growth in nearshore areas is influenced by various factors, including mixing and nutrient input (Fang et al., 2022; Feng et al., 2022; Li et al., 2022). In addition, the impacts on upwelling and plumes vary under different typhoon trajectories or intensities (Pan et al., 2012; Chen et al., 2023), and the factors that contribute to coastal algae blooms also differ, such as typhoon wind pumps and transportation of terrestrial material by precipitation, with algal blooms primarily dependent on nutrient supply (Liu et al., 2021; Chen et al., 2023; Lao et al., 2023b, Lao et al., 2023c; Chen et al., 2024). However, the relative significance of direct phytoplankton transport versus phytoplankton proliferation remains undetermined. Typhoons Cempaka and Lupit, which had different intensities and movement paths, successively passed through the PRE. Typhoon Cempaka landed on the west side of the estuary from the southeast, while the less intense Typhoon Lupit passed through the area from the southwest to northeast and provided a valuable opportunity to observe the impact of typhoons on the ecological environment of the Pearl River Estuary. What is the impact mechanism of ecological environmental changes caused by typhoon events? Is this consistent with previous vertical mixing or algal growth depend on the supply of nutrients? Therefore, comprehensive research utilizing a numerical model was conducted to investigate the impacts of typhoons and the underlying mechanisms of these algal blooms.
The study is structured as follows. In Section 2, we provide an overview of the data utilized in this paper, including the hydrodynamic-biogeochemical coupled model, and describe the analysis methods employed. Section 3 presents the model validation, the observed changes in the atmospheric forcing field, and the sea surface chlorophyll-a (Chla) concentrations, as well as the data obtained by satellite and the results of the model simulations. Additionally, we analyze the correlation of each variable based on a single typhoon center point, calculate the Chla budget across the bloom region, and discuss the mechanisms that underlie the bloom phenomenon.
2 Data and methods
2.1 Hydrodynamic-biogeochemical model
The South China Sea Operational Forecasting System (SCSOFS) is an operational system developed and operated by the National Marine Environment Forecasting Center (Zhu et al., 2020, Zhu et al., 2022). The model setups, including the atmospheric forcings, river forcings, and boundary conditions, can be found in Zhu et al. (2022). The system utilizes a three-dimensional hydrodynamic-biogeochemical coupled model with a horizontal resolution of 1/30° and a vertical resolution of 50 layers of the σ layer. The coverage area of the system spans from 4.5°S to 28.3°N and from 99°E to 144°E. The ecosystem model of the SCSOFS is based on the carbon, silicate, and nitrogen ecosystem (CoSiNE) model, which is coupled with the Regional Ocean Modeling System (ROMS) (Shchepetkin and McWilliams, 2005). The CoSiNE model incorporates 15 state variables, including four nutrients [e.g., ammonium (NH4), nitrate (NO3), phosphate (PO4), and silicate (SiOH4)]; two phytoplankton groups [e.g., small phytoplankton (S1) and diatoms (S2)]; the corresponding Chla components [e.g., Chl1 and Chl2); two grazers [e.g., microzooplankton (Z1) and mesozooplankton (Z2)]; two classes of detritus (e.g., nitrogen (DN) and silicon (DSi)); and three carbonate system state variables: dissolved oxygen (DOX), dissolved inorganic carbon (DIC), and total alkalinity (TALK). These components are influenced by physical processes such as advection and diffusion. The CoSiNE model was initially developed to simulate marine geochemical processes in the equatorial Pacific Ocean (Chai et al., 2002) and has been applied at various spatial scales, including the North Pacific Ocean (Xiu and Chai, 2012), SCS (Pan et al., 2017) and PRE (Fang et al., 2022). Additionally, the model has been applied to study the responses of marine ecosystems to typhoon events (Pan et al., 2017; Fang et al., 2022). The parameter settings of the biogeochemical model for this study can be found in Table 1. The study area lies within the range of 19.2°N to 24.2°N, 110.2°E to 119.2°E and includes the Qiongdong upwelling and Guangdong upwelling areas (Figure 1). The two upwelling regions are predominantly influenced by the summer southwest monsoon, which typically occurs from late April to October. These upwellings also have important biogeochemical impacts on the region (Wu and Li, 2003; Gan et al., 2010).
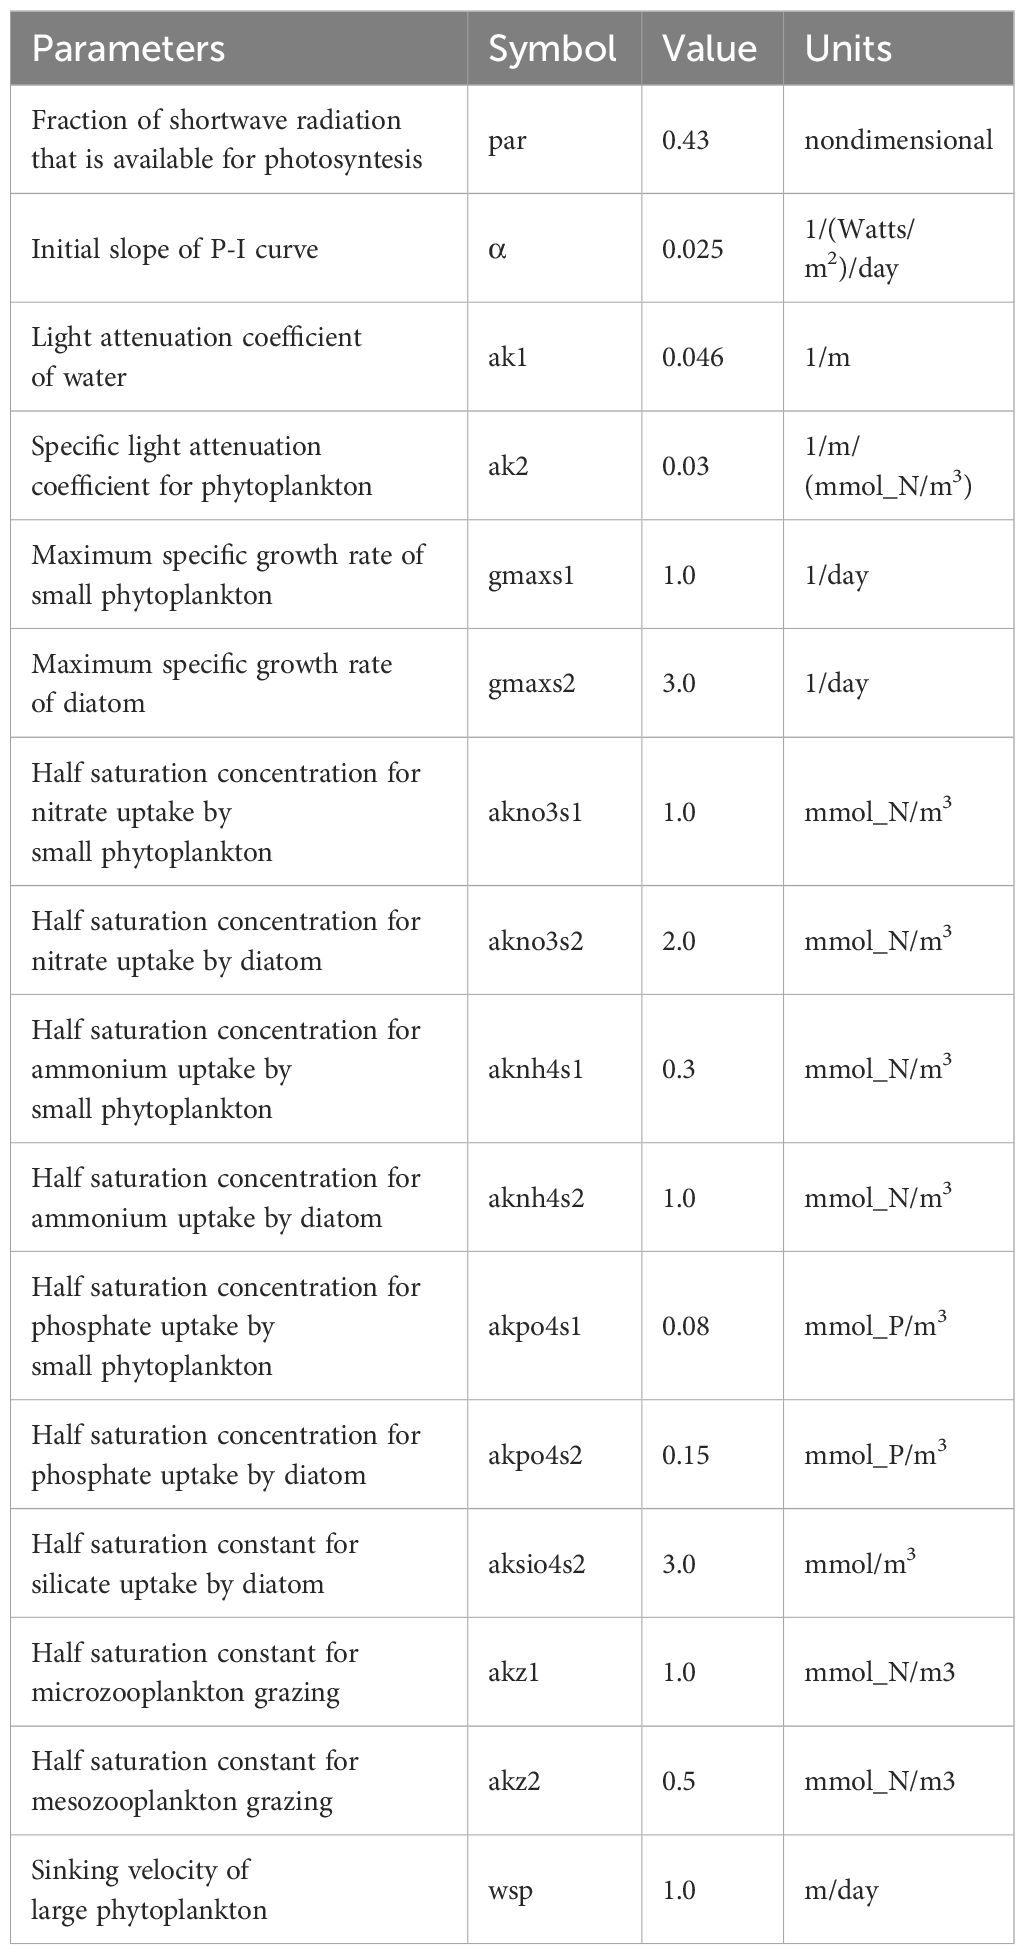
Table 1 Parameterizations of the biogeochemical model.
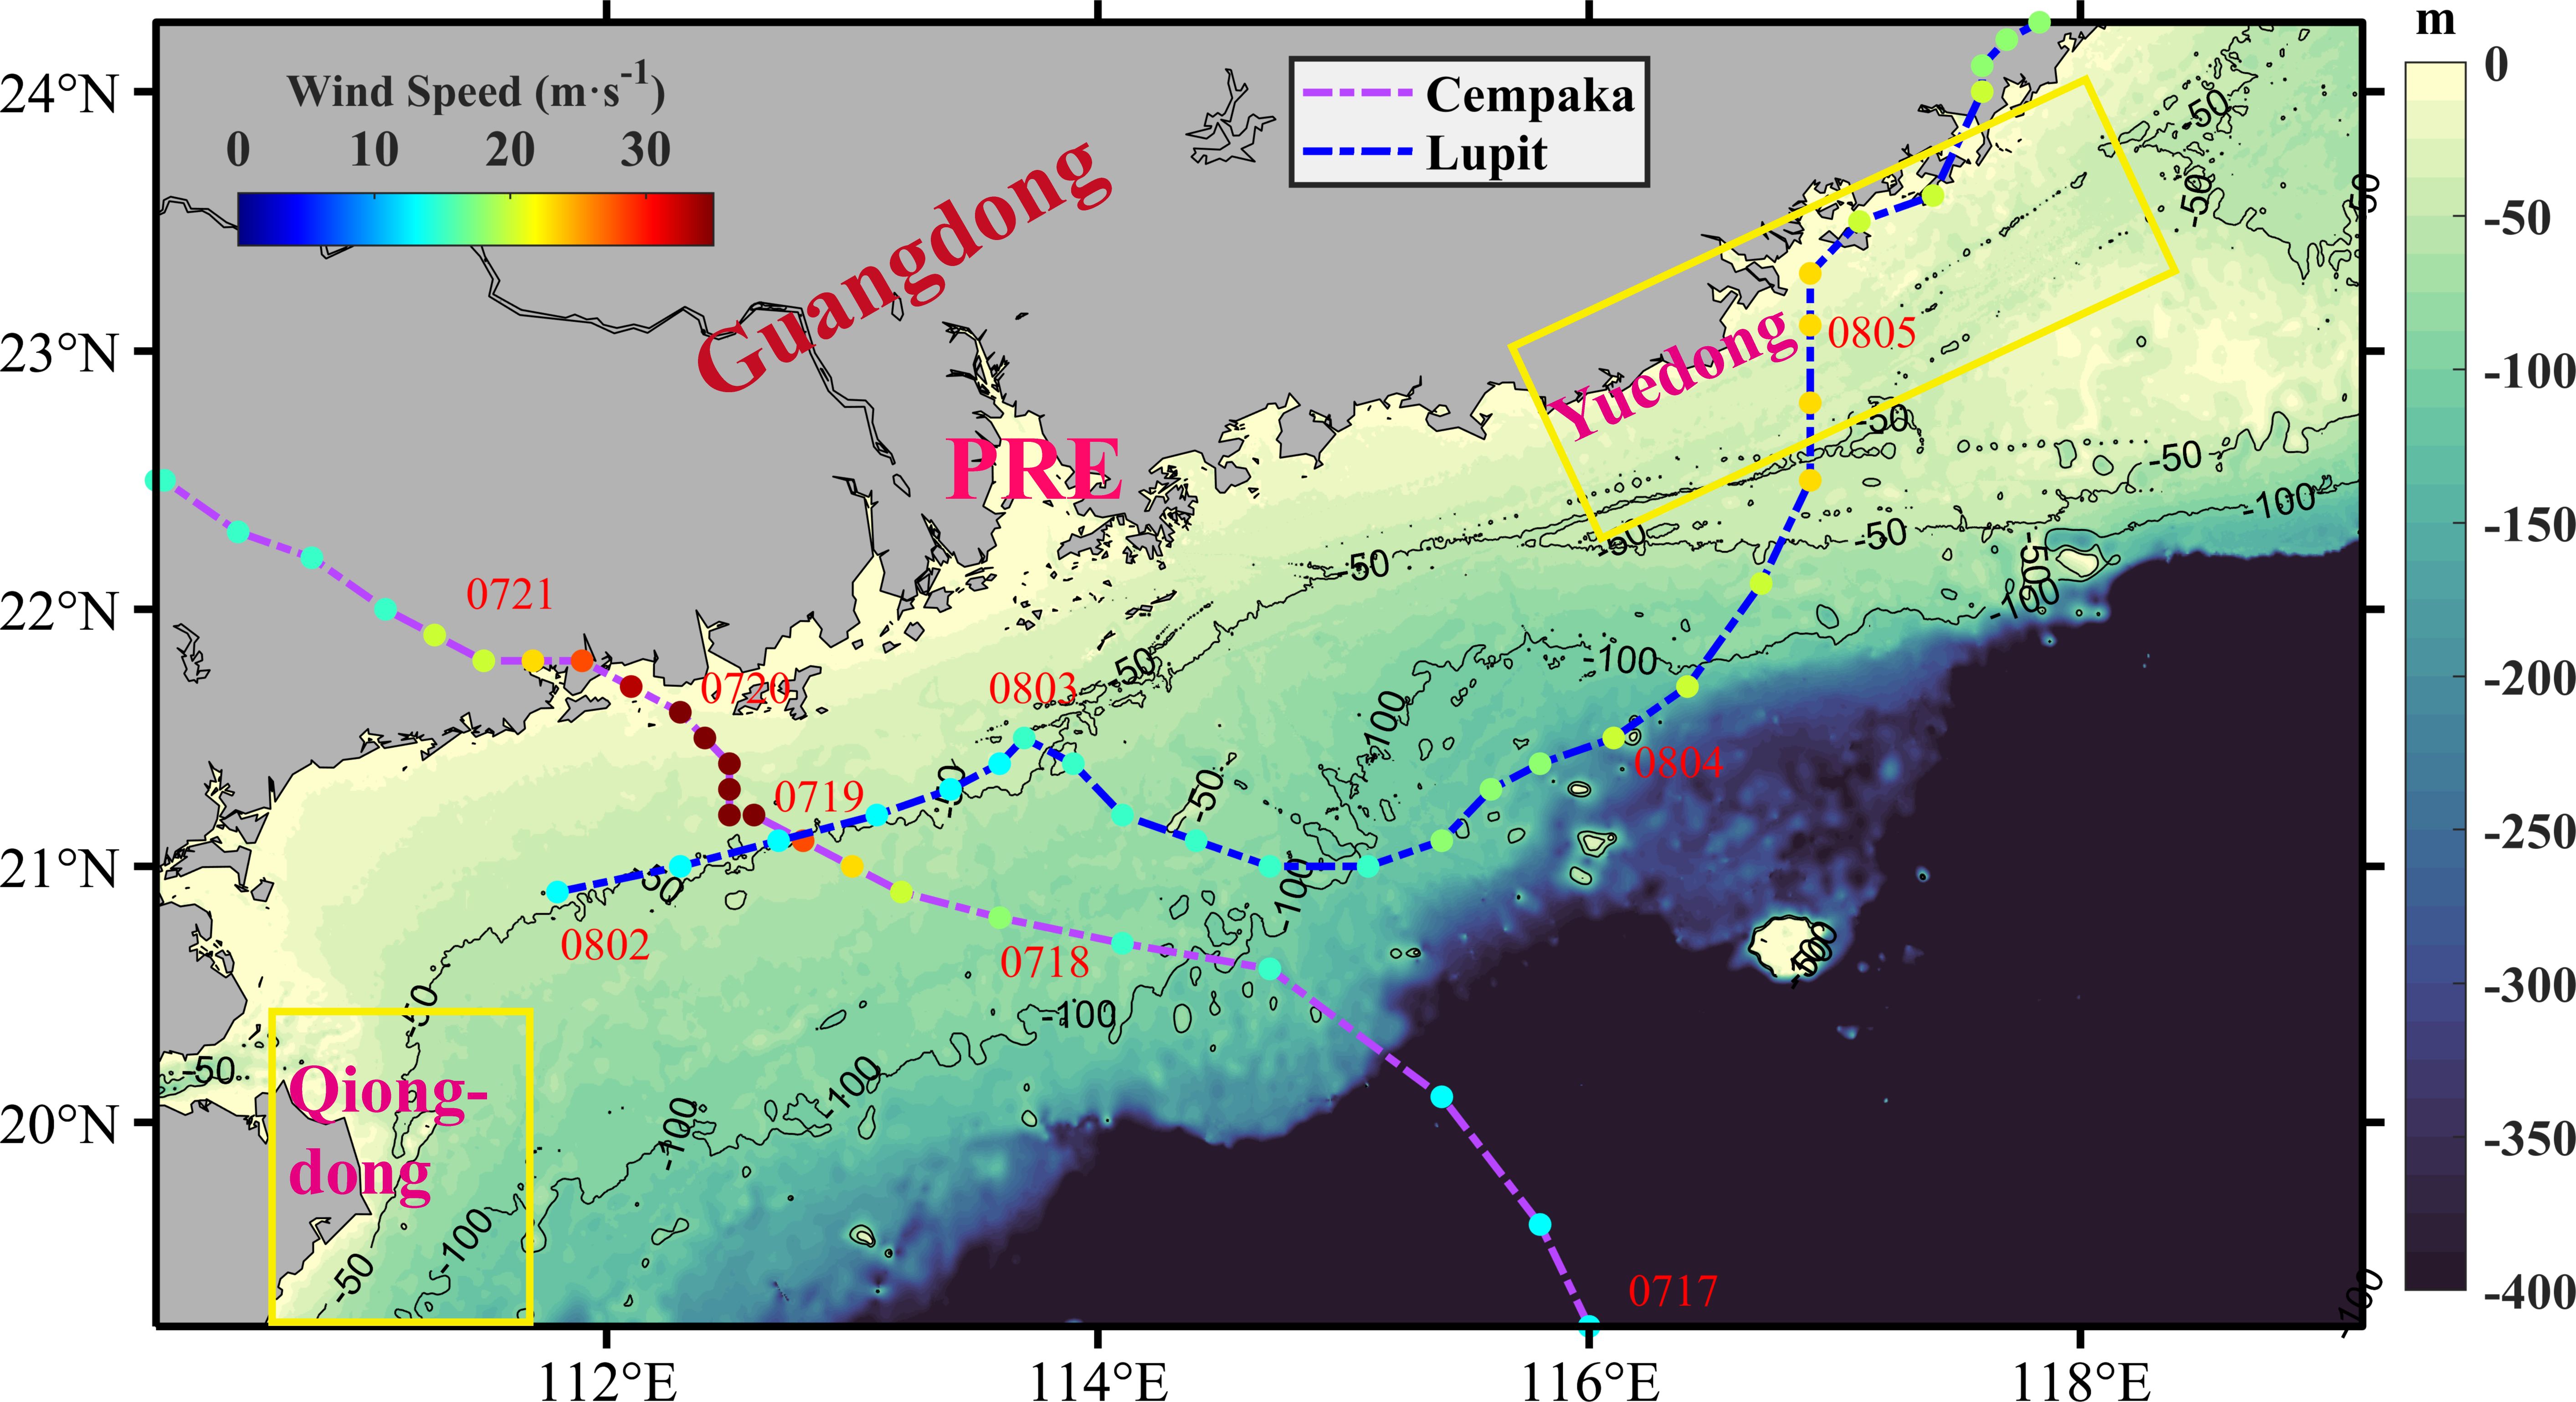
Figure 1 Bathymetry of the northern South China Sea (SCS) (shading) and the tracks of Typhoons Cempaka and Lupit in the northern SCS. The purple dashed line represents the path of Typhoon Cempaka. The blue dashed line represents the path of Typhoon Lupit. The solid circles on the tracks represent the typhoon center positions at 3 or 6-hour intervals. Their colors represent the wind speeds of the typhoons. The yellow boxes represent the areas with upwelling.
2.2 Monitoring data
Information regarding the two typhoons that affected the PRE in 2021 was obtained from the Shanghai Typhoon Research Institute, China Meteorological Administration (https://tcdata.typhoon.org.cn). These data provide a comprehensive overview of typhoons, including detailed information on important parameters such as the maximum wind speeds and minimum central pressures. The data are available at temporal resolutions of three or six hours, allowing for a more detailed analysis.
Typhoon Cempaka originated as a tropical depression in the northern SCS (Figure 1, purple dashed line). The typhoon underwent intensification and reached tropical storm status at 00:00 on July 19 (UTC). Subsequently, the typhoon further strengthened and became a strong tropical storm by 9:00 on the same day. By 15:00, it had reached the typhoon level and made landfall off the coast of Guangdong Province at approximately 13:50 on July 20. It weakened to a tropical depression in western Guangdong at 08:00 on the 21st and then moved through western Guangdong into southern Guangxi. On the morning of the 22nd, the typhoon changed direction to a southwesterly trajectory and entered the Gulf of Tonkin while continuously weakening. The second typhoon, Lupit, originated as a tropical depression on the eastern surface of the Leizhou Peninsula at 9:00 on August 2. By 00:00 on August 4, it had intensified into a tropical storm. Gradually moving northeastward, it eventually made landfall near the east coast of Guangdong Province at approximately 3:00 on August 5, a clear distance away from the PRE (Figure 1, blue dashed line). More information on both typhoons is shown in Table 2.
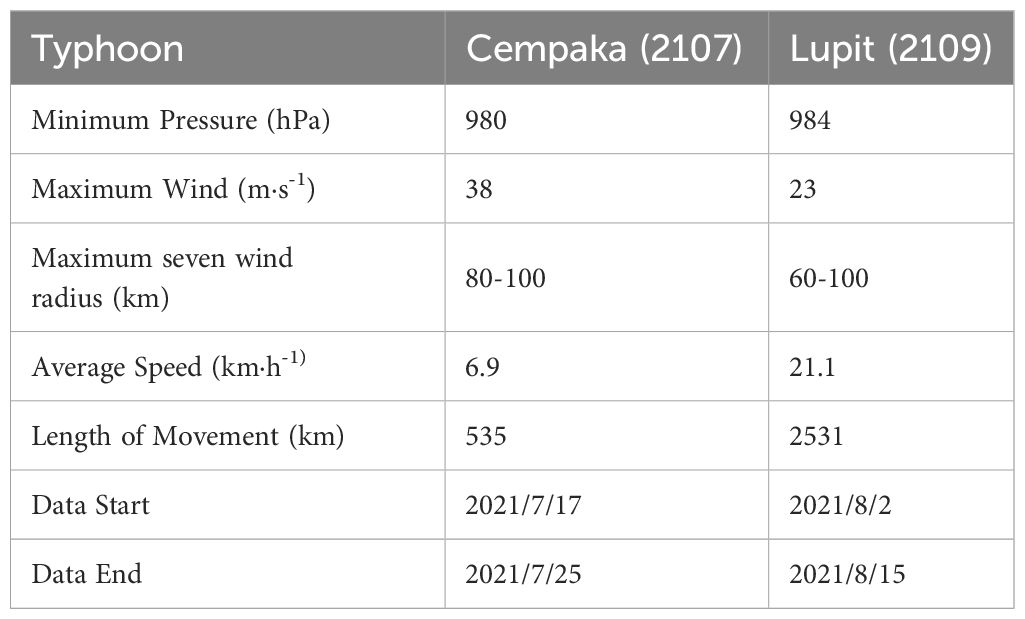
Table 2 Statistical information for the typhoons.
The atmospheric forcing data used in this study were obtained from the Climate Forecast System Reanalysis (CFSR) from the National Centre for Atmospheric Research (https://psl.noaa.gov/data). The temporal resolution of the data is 6 hours, and the spatial resolution is 0.2-0.3°.
The study utilized satellite remote sensing data for Chla that were obtained from MODIS-Aqua, which were provided by the National Aeronautics and Space Administration (NASA) Ocean Color Processing Center (OCDPS, http://oceancolor.gsfc.nasa.gov), with a horizontal resolution of 4 km. Due to the interference from clouds during typhoons, the availability of local remote sensing data is limited (Zheng and Tang, 2007a). To overcome this limitation, this study employs an 8-day average synthetic product derived from the satellite data, which provides a temporal resolution of 8 days before and after a typhoon event. By analyzing these data, this study aimed to gain insights into the impact of typhoons on the Chla distributions in marine ecosystems.
2.3 Analysis method
During the analyses of the ecological environment before and after the typhoons, the period was divided into four phases to better understand the changes. The analysis period started one week before the arrival of Typhoon Cempaka and extended to three weeks after its passage. The four distinct phases are as follows:
(1) One week preceding Typhoon Cempaka (Pre-Cempaka, July 11-July 17): This phase represents the week prior to the arrival of Typhoon Cempaka.
(2) Transit of Typhoon Cempaka (Transit-Cempaka, July 18-July 21): This phase covers the duration of Typhoon Cempaka’s passage through the area.
(3) One week following Typhoon Cempaka (Post1-Cempaka, July 22-July 28): One week following Typhoon Cempaka.
(4) Dissipation of the algal bloom (Post2-Cempaka, July 29-August 11): This two-week stage represents the process of algal bloom dissipation. It should be noted that Typhoon Lupit occurred during the second week of this phase. The intensity of Lupit was lower, so our analysis for it spans a longer period, highlighting the influence of the background wind field on the dissipation of the algal bloom.
The wind stress curl-induced EPV was calculated as follows (Price, 1981) (Equations 1–3):
where f=2ωsinθ is the Coriolis parameter, ω is the angular velocity of the earth’s rotation, ρ0 is the sea water density, is the wind stress, ρa is the air density, is the wind speed at 10 m, and CD is the drag coefficient.
Calculation of Chla budget by using the following model (Equation 4):
where represents the temporal rate of Chla change (RATE), represents the horizontal advection term (HADV), represents the vertical advection term, represents the vertical diffusion term (VDIFF), and Bio represents the term caused by biological processes. The Bio term of Chla is directly influenced by the abundance of the two phytoplankton groups, which are controlled by the growth, grazed, and mortality terms. The diatom also includes the sedimentation term. The horizontal diffusion term is neglected in this context due to its much smaller magnitude compared to the other terms.
3 Results
3.1 Model validation
To assess the ability of the ROMS-CoSiNE coupled model to simulate the changes in the seawater environment during the typhoons, field survey data from July 27 to August 9 (Guo et al., 2023) were utilized for salinity verification (Figure 2). The model outputs exhibited slightly greater values than did the measured data, and the correlation coefficient was determined to be 0.85, with a root mean square error of 2.88. Overall, the simulation effectively captured the salinity trends during this period.
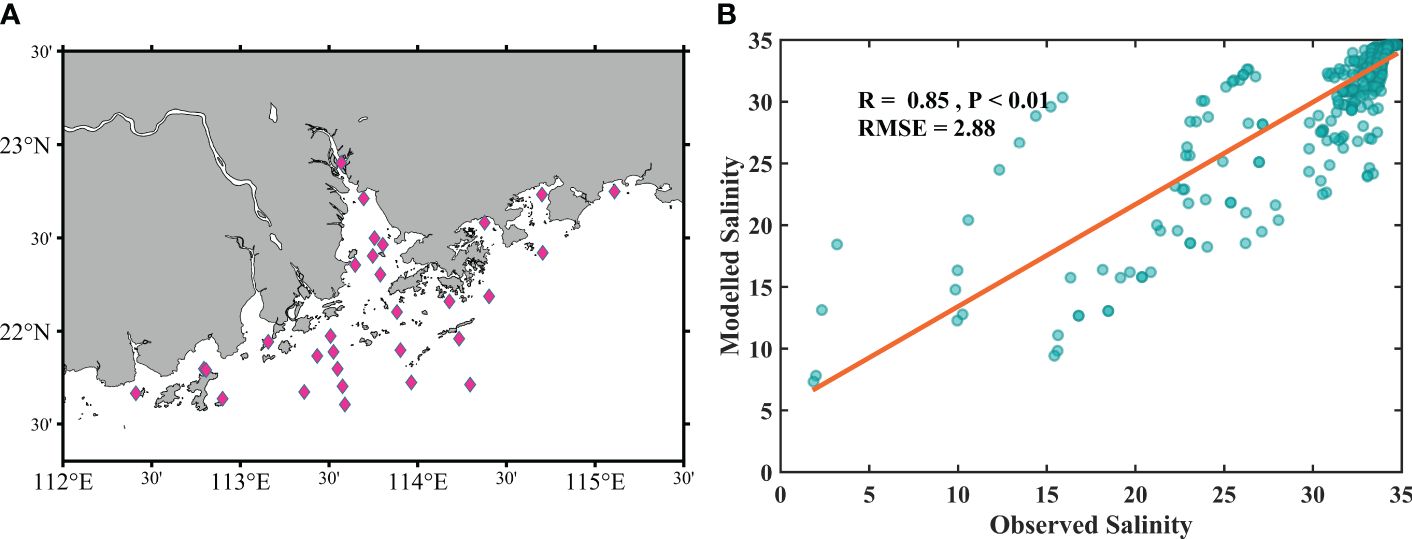
Figure 2 The distribution of the sampling stations (A) and the comparison between the measured salinity and simulated salinity values (B).
To assess the impact of Typhoon Cempaka on the Chla distributions, we calculated the differences between the composite data from July 20 to 27 and the composite data from July 12 to 19 (Figure 3A). The results showed that a distinct Chla bloom area was located west of the PRE, where the Chla concentrations increased by more than 2 mg·m-3 (Figure 3A). Conversely, the region near the shoreline exhibited a decrease in Chla concentrations. In addition, a reduction in the Chla concentrations was observed in the vicinity of the upwelling area in Qiongdong. Similarly, the impact of Typhoon Lupit was determined by subtracting the data from August 5 to 12 from the data between July 28 and August 4 (Figure 3B). Unfortunately, the impact of Typhoon Lupit could not be observed using the satellite remote sensing data because of the cloud cover (Figure 3B). The model results were subsequently used to estimate the effects of the typhoons on the distributions of the surface Chla concentrations in the same way (Figures 3C, D). The Chla distributions before and after the storms are shown in Supplementary Figure S1. The variation in simulated chlorophyll concentrations are lower than the satellite observations (Figures 3A, C), but there is a significant correlation (R=0.43, P<0.01). The RMSE for the Chla differences was 1.22 mg·m-3, indicating that the simulation of the distribution of the chlorophyll concentrations in the surface layer during this period was satisfactory overall. Moreover, considering the poor observation results available from satellite remote sensing in nearshore turbid waters, the simulation discrepancy is acceptable (Ye et al., 2020; Feng et al., 2022). Based on the model results, the Chla concentrations in the estuary decreased under the influence of Typhoon Lupit, and the Chla concentrations in the algal bloom area that were caused by Typhoon Cempaka also decreased. The Chla concentrations increased on the eastern side of the estuary, while a decrease was observed on the western side (Figure 3D), potentially attributed to the mixing effect induced by Typhoon Lupit. For further details on the simulation performance and additional verification of the SCSOFS data, please refer to Zhu et al. (2022) & Guo et al. (2023).
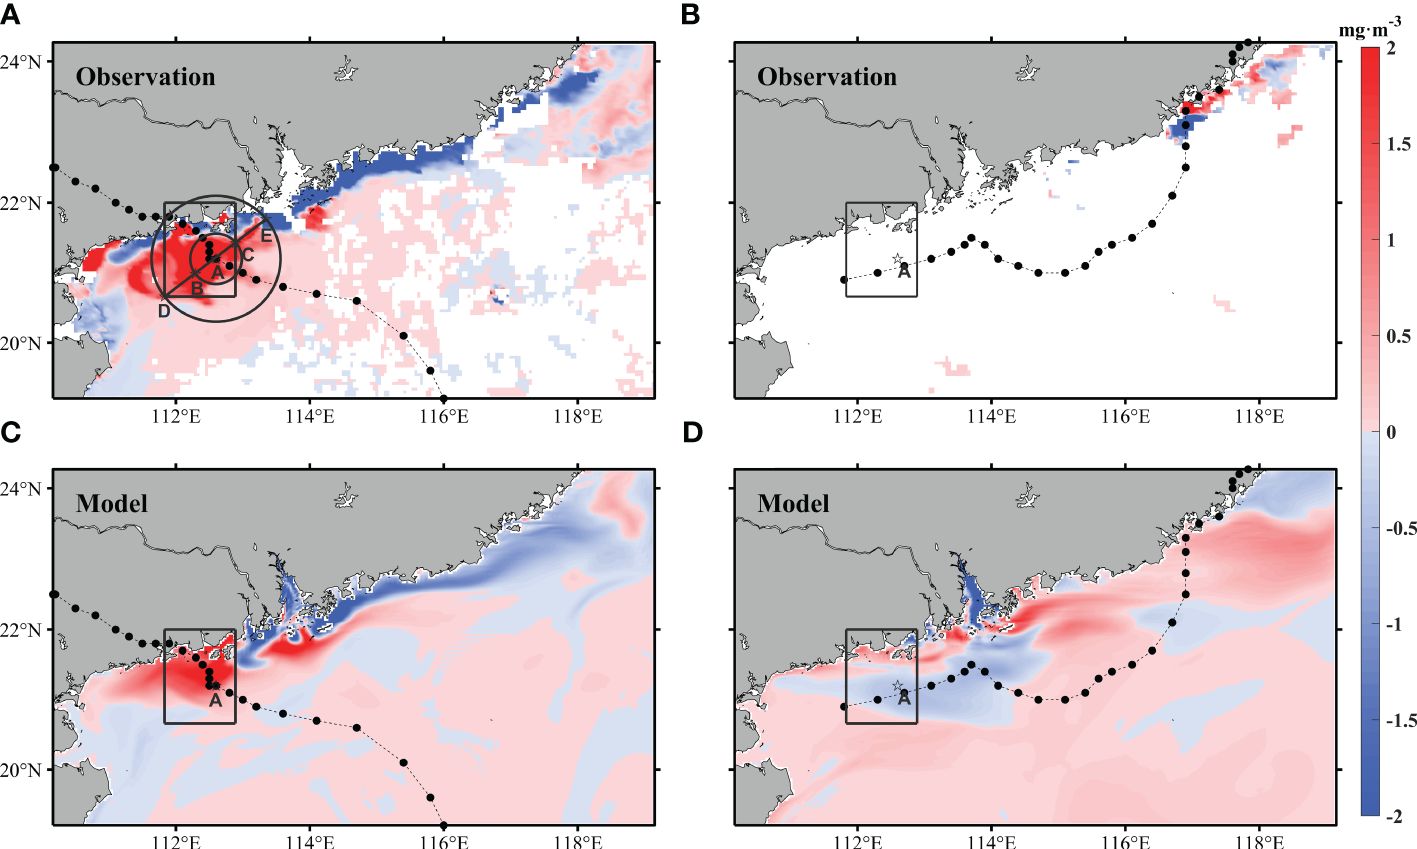
Figure 3 Satellite remote sensing (A, B) and modeled (C, D) Chla difference maps. (A, C) are the average values from 7/20-7/27 minus the corresponding values from 7/12 to 7/19. (C, D) are the average values from 8/5-8/12 minus the corresponding values from 7/28 to 8/4. In (A, C), the dotted lines represent the path of Typhoon Cempaka but represent the path of Typhoon Lupit in (B, D). The boxes represent the selected bloom area. Point A is the typhoon center of Typhoon Cempaka at 18:00 on July 19 (UTC), when the typhoon wind speed reaches its maximum. In (A), the two circles represent the 10-level wind radius and the 7-level wind radius of the typhoon with point A as the center radius of 40 km and 100 km, respectively. In (A), B & C are points on the 40 km circle, and D & E are points on the 100 k, circle.
3.2 Distribution of atmospheric fields
By decomposing the analysis period into four distinct phases, we can observe and study the changes in the ecological environment before, during, and after the typhoons, as well as the impacts of subsequent events such as algal bloom dissipation and the occurrence of Typhoon Lupit. Before and after the typhoons, southwesterly winds prevailed in the northern SCS during summer (Zhu et al., 2019). First, the southwesterly winds were enhanced (Figures 4A–F). During the pre-Cempaka period, the region experienced a period with a break in the monsoon with wind speeds mostly less than 6 m·s-1. This phase was characterized by relatively calm conditions of the southeasterly winds (Figure 4A). During the transit-Cempaka period, the typhoon brought a cyclonic wind field and high wind speeds. The wind velocities near the typhoon center reached more than 15 m·s-1 (Figure 4B). During the post-1-Cempaka period, the wind field was gradually dominated by southwesterly winds, with obviously higher wind speeds than those during the pre-typhoon conditions (Figure 4C). During the post-2-Cempaka period, including the passage of Typhoon Lupit, the wind field predominantly shifted in a southerly direction (Figures 4D–F).
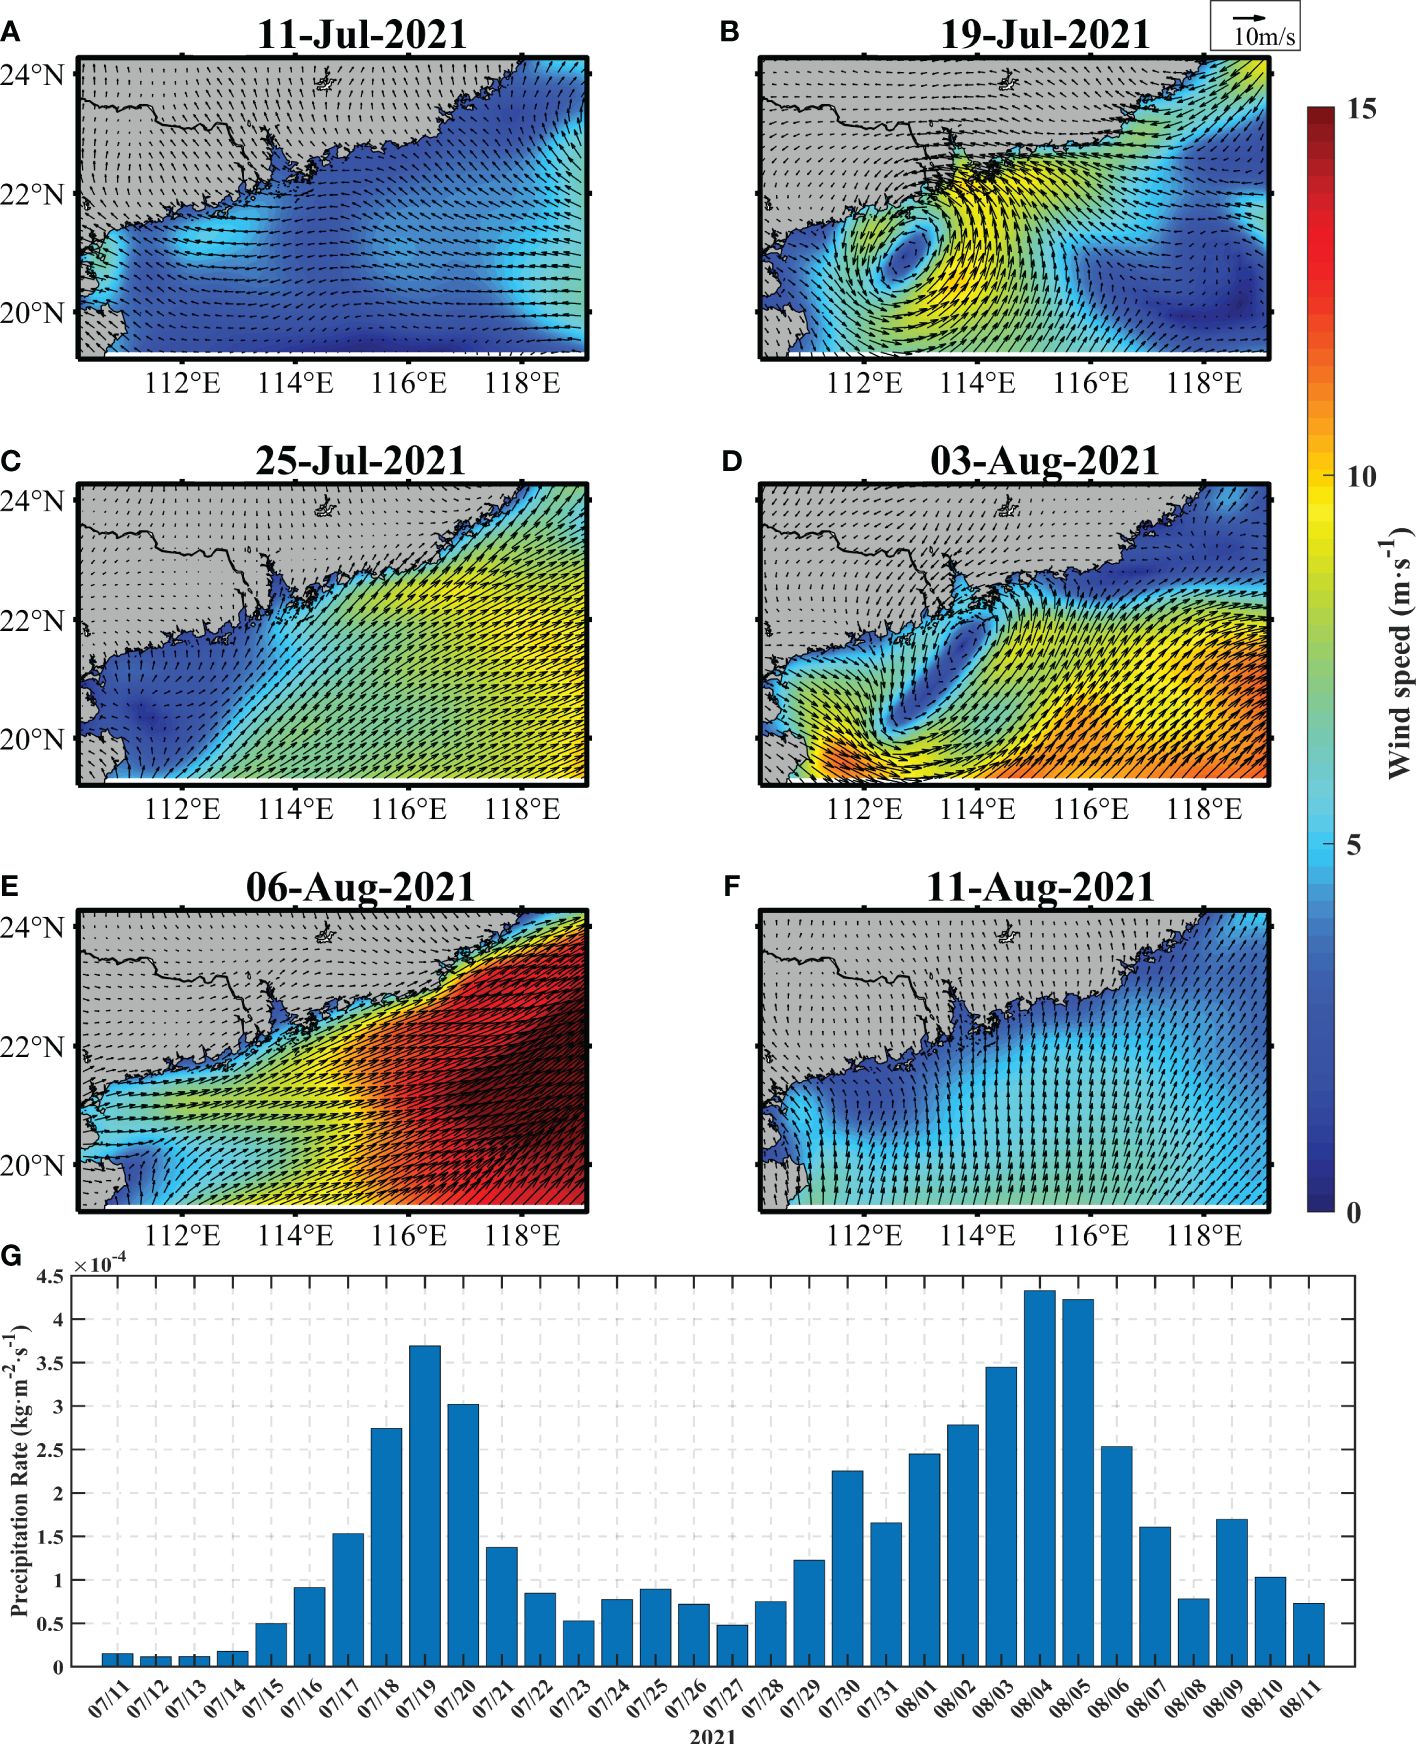
Figure 4 The distributions of the 10 m wind vector (arrows) and wind speed changes on 11 July (A), 19 July (B), 25 July (C), 3 August (D), 6 August (E), and 11 August (F). (G) Precipitation variations in the area from 11 July to 11 August.
Heavy rainfall accompanied the typhoons (Jacob and Koblinsky, 2007), resulting in increased precipitation (Figure 4G) and decreased sea surface salinity (Wang and Zhang, 2021). Notably, the rainfall amounts averaged over the study region increased by more than 7 times during the typhoon period. Under the combination of enhanced southwesterly winds and increased rainfall, dynamic and biochemical processes may undergo extraordinary changes (Lin and Oey, 2016; Zhang et al., 2021). Therefore, we further investigated the responses of the marine environment to these ocean-atmospheric interactions.
3.3 Spatial-temporal variations in physical and biological elements
To better understand the physical-biogeochemical changes that are caused by typhoons, we analyzed the changes in temperature, salinity, Chla concentration, and NO3 concentration from the perspective of three dimensions during the four stages (Figure 5). A depth of typhoon-induced mixing greater than the climatological mixing layer depth (MLD) may affect the variable distributions (Jiang et al., 2023). During the transit-Cempaka period, significant negative anomalous sea temperatures were evident over most regions (Figure 5B). However, under the influence of the northeasterly wind located west of the typhoon pathway, the Qiongdong upwelling process was suppressed, with a positive anomalous value. Typhoons typically induce deepening of the upper mixed layer in the ocean, resulting in surface cooling and subsurface warming (Price, 1981). The heat dissipation through air-sea heat flux from the sea surface is less important than mixing (Zhang et al., 2021). During post1-Cempaka, an obvious cooling effect was observed in most areas, ranging from 0.1 to 2.8°C (Figure 5C). The upwelling regions exhibited different temperature variations, with a maximum temperature increase of 1.9°C, possibly due to the disruption of the original upwelling structure and mixing by the typhoon (Zhao et al., 2009). During the post-2-Cempaka period, the maximum cooling temperature recorded during this period reached 4.5°C, which can be attributed to the persistent cooling effect of Typhoon Cempaka, as well as the additional cooling caused by Typhoon Lupit, alongside the subsequent recovery of the upwelling system (Figure 5D).
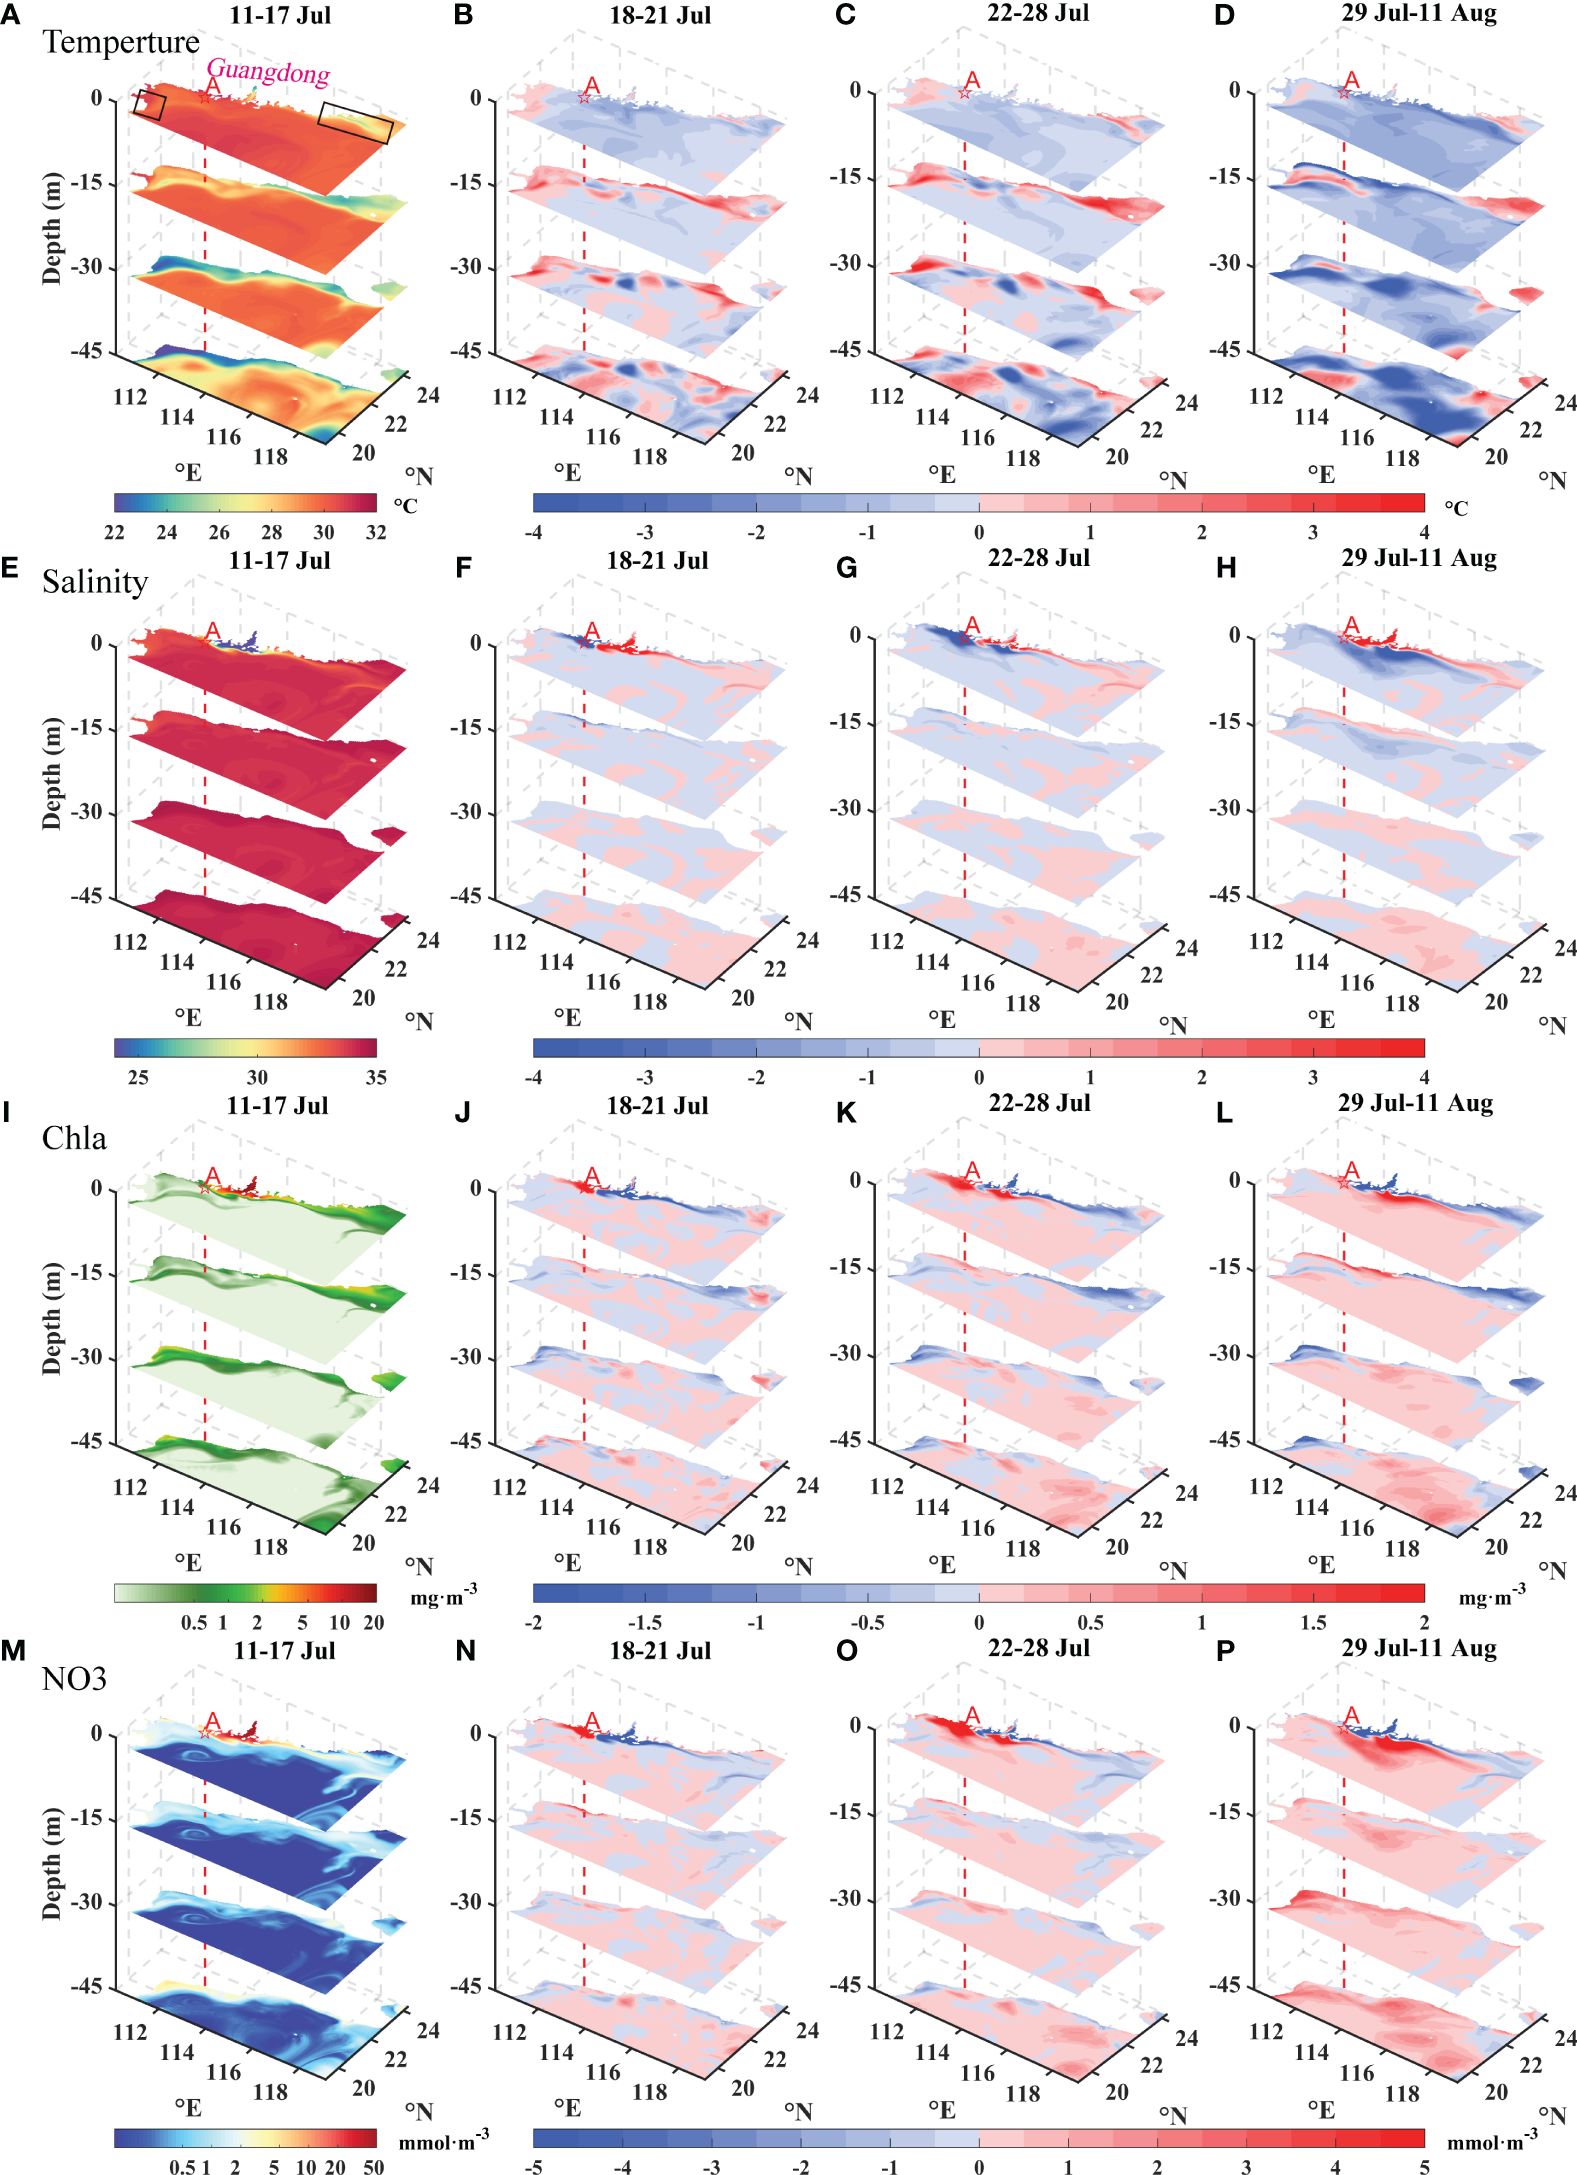
Figure 5 Spatial distributions of temporally averaged temperature (A–D), salinity (E–H), Chla concentrations (I–L), and NO3 concentrations (M–P) in the four distinct phases. (A, E, I, M) represent the mean values of each variable during the pre-Cempaka stage; (B, F, J, N) represent the differences between the mean values during the transit-Cempaka and pre-Cempaka stages; (C, G, K, O) represent the differences between the mean values during the post1-Cempaka and pre-Cempaka stages; and (D, H, I, P) represent the differences between the mean values during the post2-Cempaka and pre-Cempaka stages. The red dotted line represents the position of point A near Typhoon Cempaka’s center. In (A), the black boxes represent the regions of upwelling.
Salinity serves as an effective tracer for identifying the extent of river freshwater (Zhou et al., 2015). In the case of typhoons, salinity analysis was used to study the impact of the typhoons on the estuary and surrounding areas. During the per-Cempaka period, the sea surface salinities in the estuary were low due to the influence of freshwater from the river. Under the influence of easterly winds, which induce westward flow, the freshwater extent on the western side surpassed that on the eastern side (Figure 5E). During the transit-Cempaka and post1-Cempaka periods, obvious decreases in surface salinity were observed on the western side of the estuary, with a maximum decrease of 8.3 (Figures 5F, G). During the post-2-Cempaka period, influenced by both southwesterly winds and Typhoon Lupit, the low-salinity waters became more concentrated on the eastern side of the PRE and indicated the movement and redistribution of the freshwater plume (Figure 5H).
The Chla and NO3 distributions exhibited similar patterns (Figures 5I–P). An increase in NO3 concentrations is fundamental and essential for the proliferation of phytoplankton in nutrient-poor SCSs (Pan et al., 2017). Before Typhoon Cempaka, the surface distributions of Chla and NO3 in the northern SCS demonstrated decreasing trends from the estuary toward the offshore regions (Figures 5I, M), which were mainly caused by the offshore decrease in the large amount of nutrients carried by rivers into the sea (Harrison et al., 2008). However, after Typhoon Cempaka, there was an obvious increase in Chla concentrations (>2.0 mg·m-3) near the coastal areas and a notable decrease in the estuary and the eastern plume region (Figure 5K). The changes in Chla and NO3 concentrations exhibited opposite patterns compared to those in the salinity, suggesting an underlying correlation with the transport of water from rivers. Typhoon Cempaka caused high-value areas on the western side of the estuary in the surface layer (Figures 5K, O). With the influence of the southwesterly winds, these high Chla and NO3 concentrations gradually shifted toward the eastern side of the estuary (Figures 5L, P). In addition, the increased salinity in the estuary corresponded to the decreases in Chla and NO3 concentrations. In the Qiongdong upwelling and Yuedong upwelling areas, consistent warming was observed at different depths, accompanied by decreases in the Chla and NO3 concentrations. According to the modeling results, typhoon transit disrupted the structure of the original upwelling areas, which caused the water to mix with the surrounding water at different temperatures and nutrient levels.
The changes in marine variables along the cross section were further examined to improve the observations of the vertical variations. The modeling results of the element distributions along section DE (Figure 3A, section DE) revealed several changes that occurred during and after the typhoon, from estuary point E to typhoon center point A (Figure 6). Such a cross section allows effective observations of the freshwater effects.
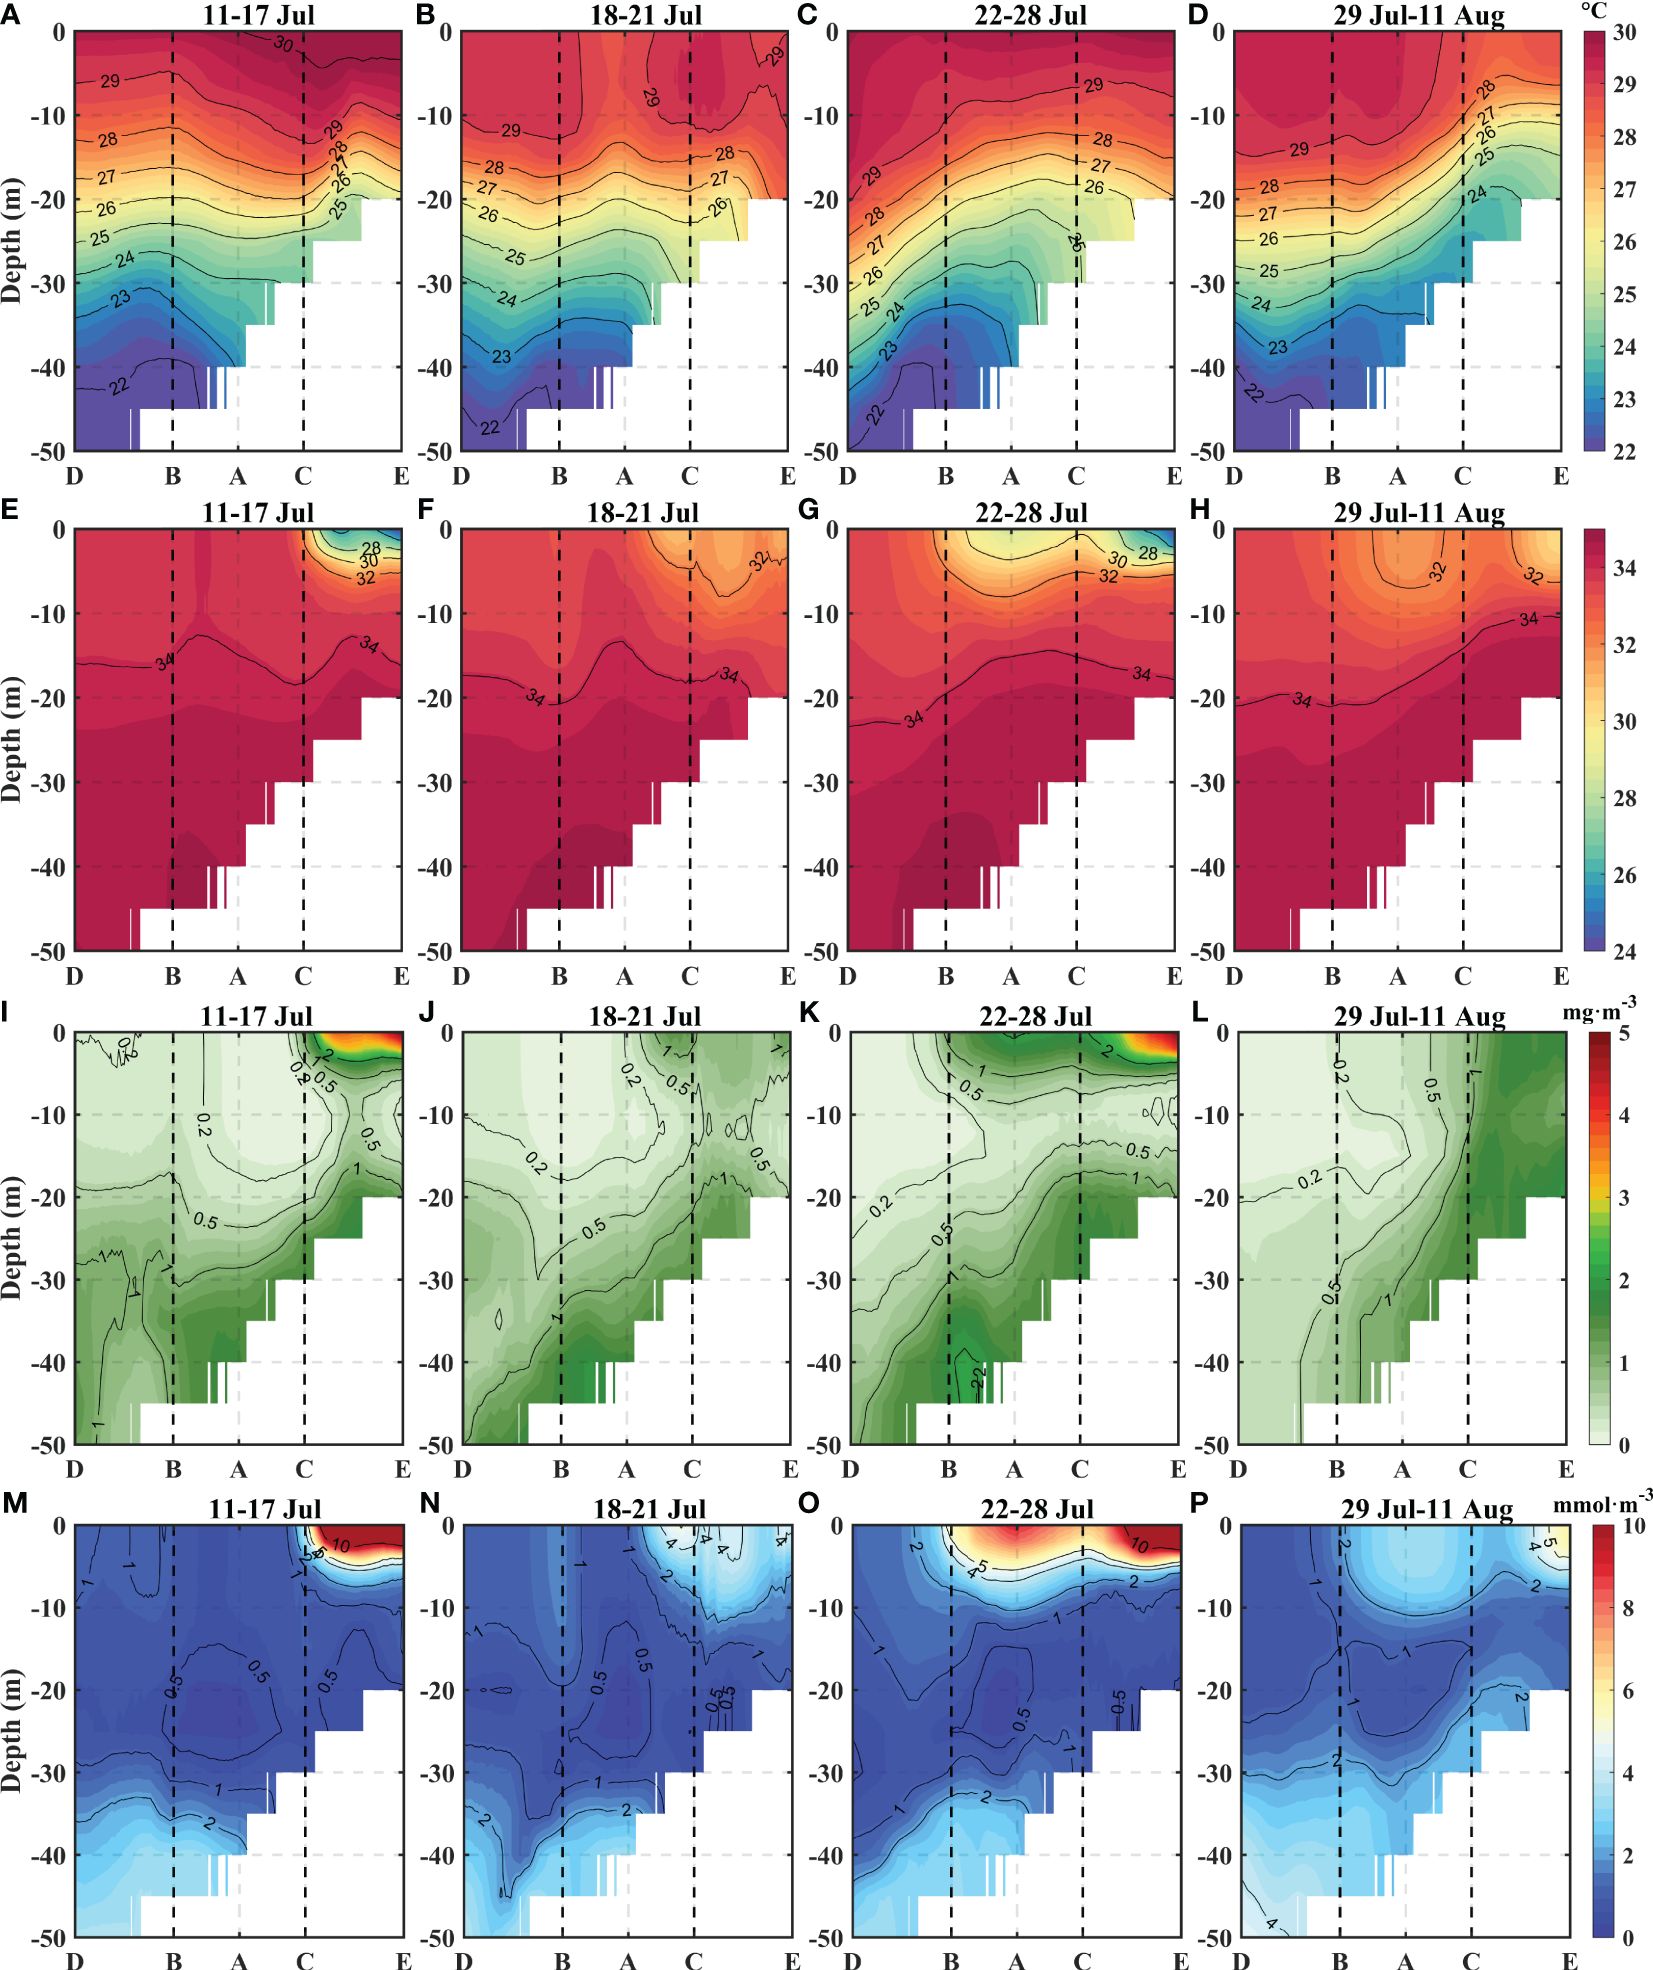
Figure 6 Vertical distributions of temperatures (A–D), salinities (E–H), Chla concentrations (I–L), and NO3 concentrations (M–P) along the DE section. (A, E, I, M) Represent the mean values of each variable during the pre-Cempaka stage. (B, F, J, N) Represent the mean values during the transit-Cempaka stage. (C, G, K, O) Represent the mean values during the post1-Cempaka stage. (D, H, I, P) Represent the mean values during the post-2-Cempaka stage. The two black dotted lines represent the positions of points B and C The AD direction is defined as the negative distance, and the AE direction is the positive distance.
During the transit-Cempaka period, a cold center appeared in the upper layer of the DE section (Figure 6B). This led to a decrease in temperature of 1-2°C in the upper layer. During the post-1-Cempaka period, the BD section warmed with the sinking of isotherms, while the CE section cooled with increasing isotherms (Figure 6C). The maximum cooling of approximately 2°C occurred between 10 and 20 m in the central part of section DE, and the temperatures in the CE section decreased during the subsequent two weeks (Figure 6D). During the post1-Cempaka period, there was an obvious decrease in salinity in the upper layer of the BC section (Figure 6G). The distributions of Chla, NO3, and salinity anomalies in the upper layers exhibited similar but opposite patterns (Figures 6G, K, O). During the post-2-Cempaka period, the salinity in the upper layer increased, while the Chla and NO3 concentrations decreased (Figures 6H, L, P). The section also revealed higher Chla and NO3 values near the bottom, but these values were not sufficient to account for the post-typhoon increase. These changes in the marine environment during the typhoon cycle indicate complex interactions between various factors, such as winds, river freshwater, upwelling, nutrient distributions, and phytoplankton growth. The factors contributing to these changes will be further discussed.
4 Discussion
4.1 Drivers of the variations in physical and ecological elements
The typhoons caused obvious changes in both the physical and ecological elements on the western side of the PRE. These changes included cooling, decreased salinity, and increased Chla and NO3 levels in the surface layer, followed by a subsequent recovery phase. Additionally, the distribution of environmental variables along section DE (Figure 6) revealed that Point A (112.6°E, 21.2°N) underwent a very representative process. Specifically, the changes at Point A, which was positioned along the typhoon track on July 19 and representing the typhoon center, provide a comprehensive analysis of these changes (Figure 7). The vertical temperature profile at point A demonstrates the impact of the typhoons, which exhibit a noticeable increase in the amount of colder water from greater depths and a maximum temperature decrease of 2.5°C at a depth of approximately 20 m (Figure 7B). This phenomenon is likely attributed to a combination of water mixing and air-sea heat flux (Zhang et al., 2021). Previous studies have shown that the range of influence of the PRP is mainly within a depth range of 0-15 m (Zhi et al., 2022). The monthly average runoff is utilized in the model because of the lack of daily measured data, thereby excluding the influence of high runoff resulting from rainfall events. Notably, the changes observed above 15 m indicate that obvious alterations in salinities, Chla concentrations, and NO3 concentrations occurred after Typhoon Cempaka (Figures 7C, E, G). The anomaly patterns indicate a decrease in salinity in the upper layer, which corresponds to increases in NO3 and Chla, suggesting that the controlling factors for the changes in the upper layer originate away from point A rather than from local upwelling (Figures 7F, H). Considering the change in the lower layers is not enough to provide the increment of the upper layer, it is likely that the vertical changes did not dominate the overall trend. The plume carried large amounts of nutrients and a high quantity of phytoplankton biomass, and these changes may be attributed to the influence of the typhoon on the redistribution of plume (Gan et al., 2010; Liu et al., 2021; Wang and Zhang, 2021). Moreover, a noteworthy observation is the temporal synchrony between the increase of Chla and NO3 concentrations in the upper layer, which deviates from previous research findings (Pan et al., 2017). In previous studies, it was believed that the vertical transport and mixing of nutrients led to the peak of nitrate, followed by the peak of chlorophyll a due to phytoplankton proliferation. The simultaneous peak of nitrate and chlorophyll a suggests that this is likely a result of direct water mass exchange by advection and mixing rather than phytoplankton proliferation.
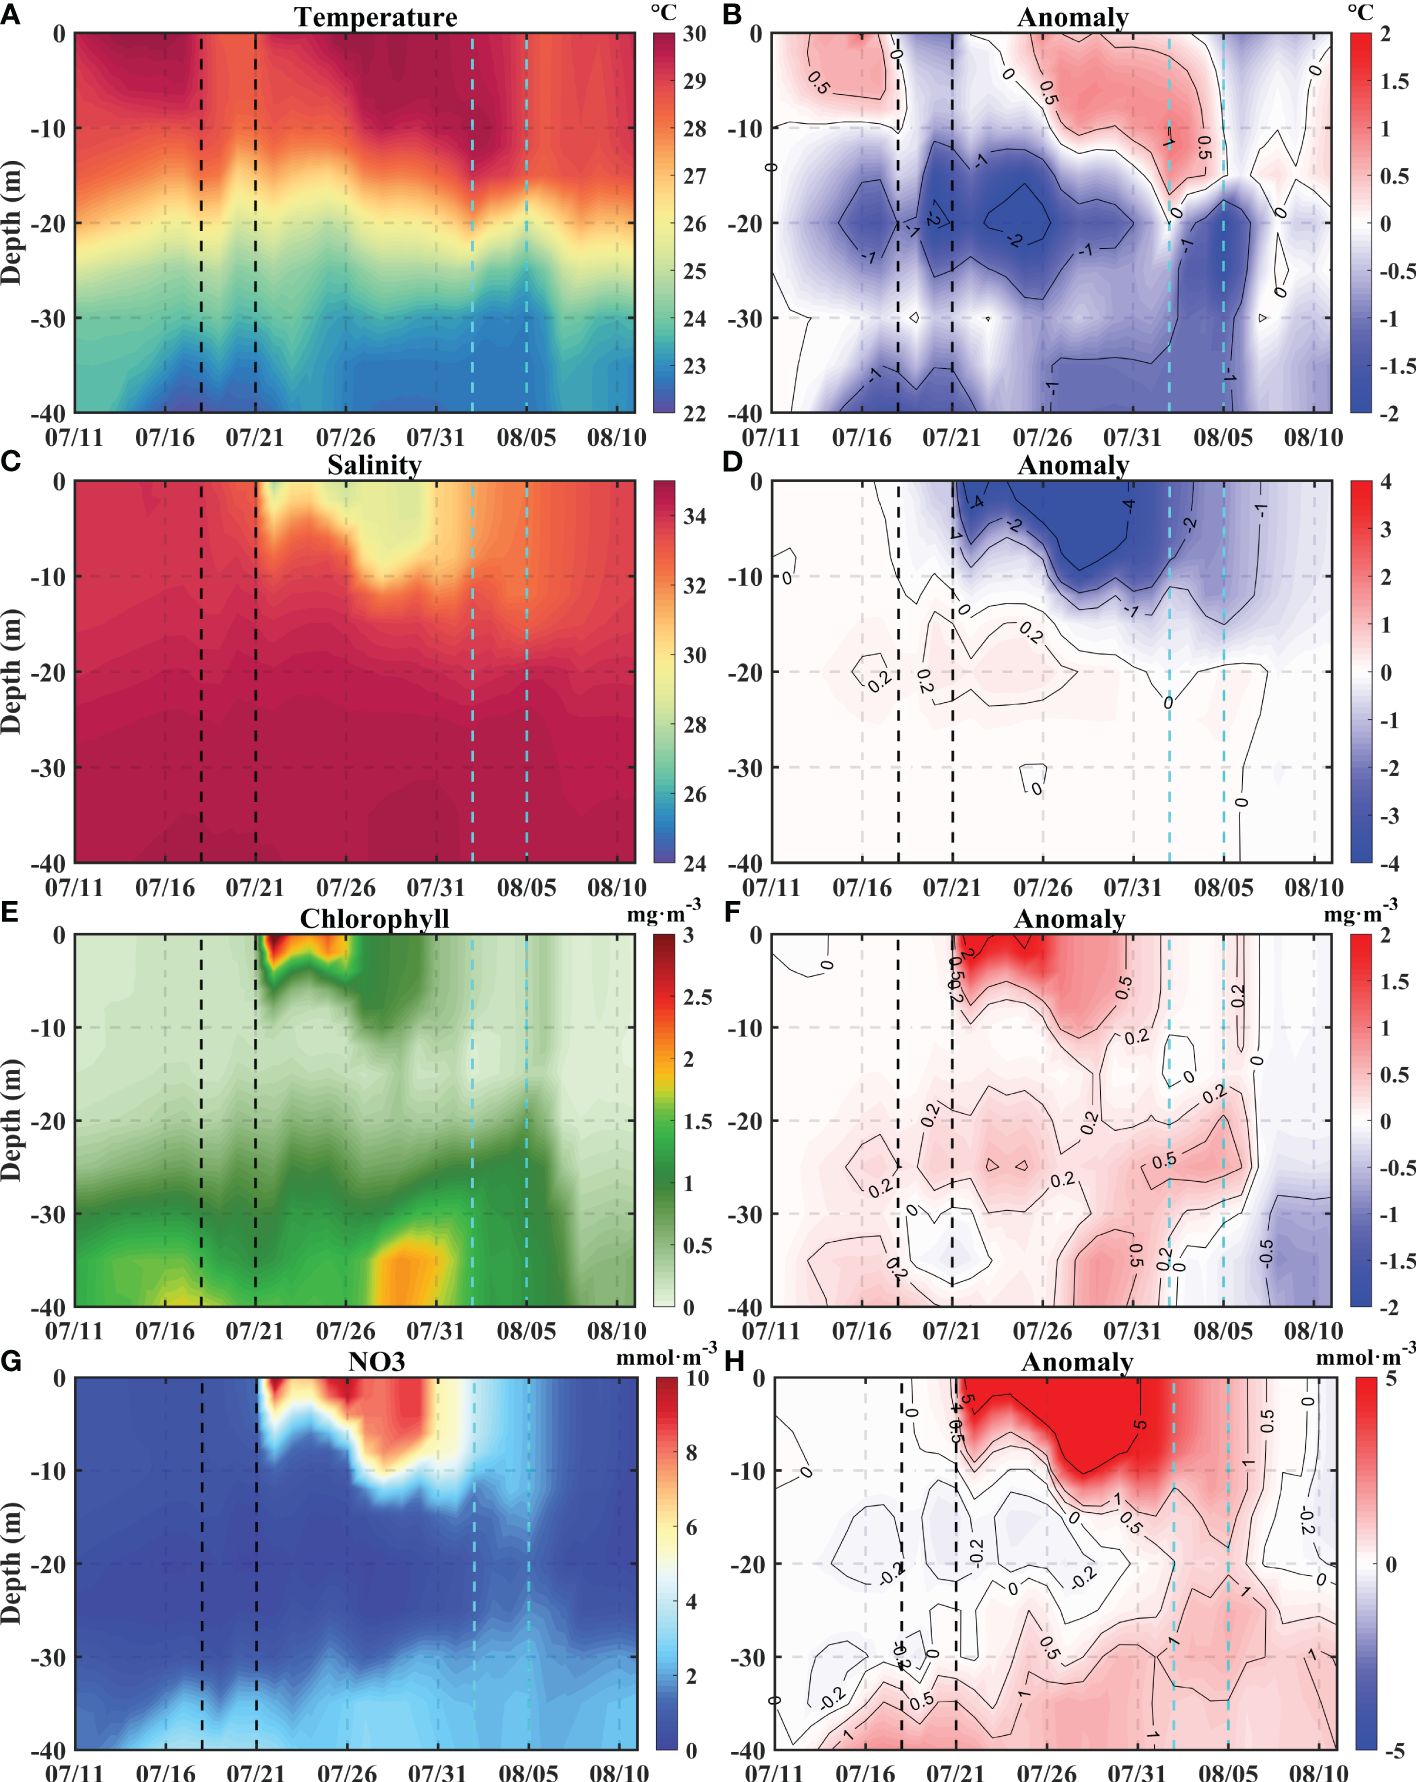
Figure 7 The time series of vertical temperature, salinity, Chla concentrations, and NO3 concentrations at point A (A, C, E, G) and the anomaly of each variable compared with July 11 (B, D, F, H). The two black dashed lines represent the transit period of Typhoon Cempaka, and the two cyan dashed lines represent the transit of Typhoon Lupit.
To further determine the vertical transport contribution, the Ekman pumping velocity (EPV) is calculated to characterize the vertical transport, which can characterize the strength of ocean upwelling or subsidence flow caused by wind stress (Wang and Zhang, 2021). The depression at the center of the typhoon was caused by strong wind stresses due to the Ekman pumping effect in the upper ocean. As shown in Supplementary Figure S2, the EPV had upward velocities near the typhoon center and downward velocities at the periphery.
The initial screening of the impact factors was conducted by using statistical correlation analysis methods to explore and understand the relationships among the ocean state variables under the influence of typhoons (Figure 8). The variations in SSTs during the typhoon period had a negative relationship with the EPV, which was mainly attributed to the upwelling of cold water by Ekman pumping, a process driven by the strong winds associated with typhoons (Yang and Hong, 2021). Moreover, most of the ecological elements exhibited stronger correlations with salinity than with EPV (Figure 8). The decreased salinity is mainly attributed to the extension of the PRP. These findings indicate that vertical variability may not play a dominant role in determining phytoplankton anomalies, while horizontal advection has a more important impact. Moreover, the alterations in ecological variables exhibited some degree of dissimilarity. The absence of a significant correlation between PO4 and salinity may be attributed to phosphorus limitation in the PRP and the impact of biological absorption (Gan et al., 2014). This suggests that the mixing caused by typhoons may have a positive impact on nutrient availability in certain areas. Another noteworthy finding is that there was a significant positive correlation between salinities and diatoms, as well as a rapid increase in Chla and small phytoplankton concentrations in the upper layer of point A after the typhoon, while the diatom concentrations decreased. Previous studies have shown that under sufficient light conditions and without nutrient limitations, diatoms tend to grow faster and dominate the small phytoplankton after typhoons (Chai et al., 2007; Ma et al., 2013; Pan et al., 2017). However, different observations have been made in coastal areas, with some studies reporting increases in dinoflagellate abundance and others reporting increases in diatom abundance and even cases of biological degradation (Tsuchiya et al., 2014; Anglès et al., 2015; Zhou et al., 2021; Thompson et al., 2023). The low diatom concentrations in the PRP set in the model likely influenced the change in algal species composition, further highlighting the importance of horizontal advection (Anglès et al., 2015).
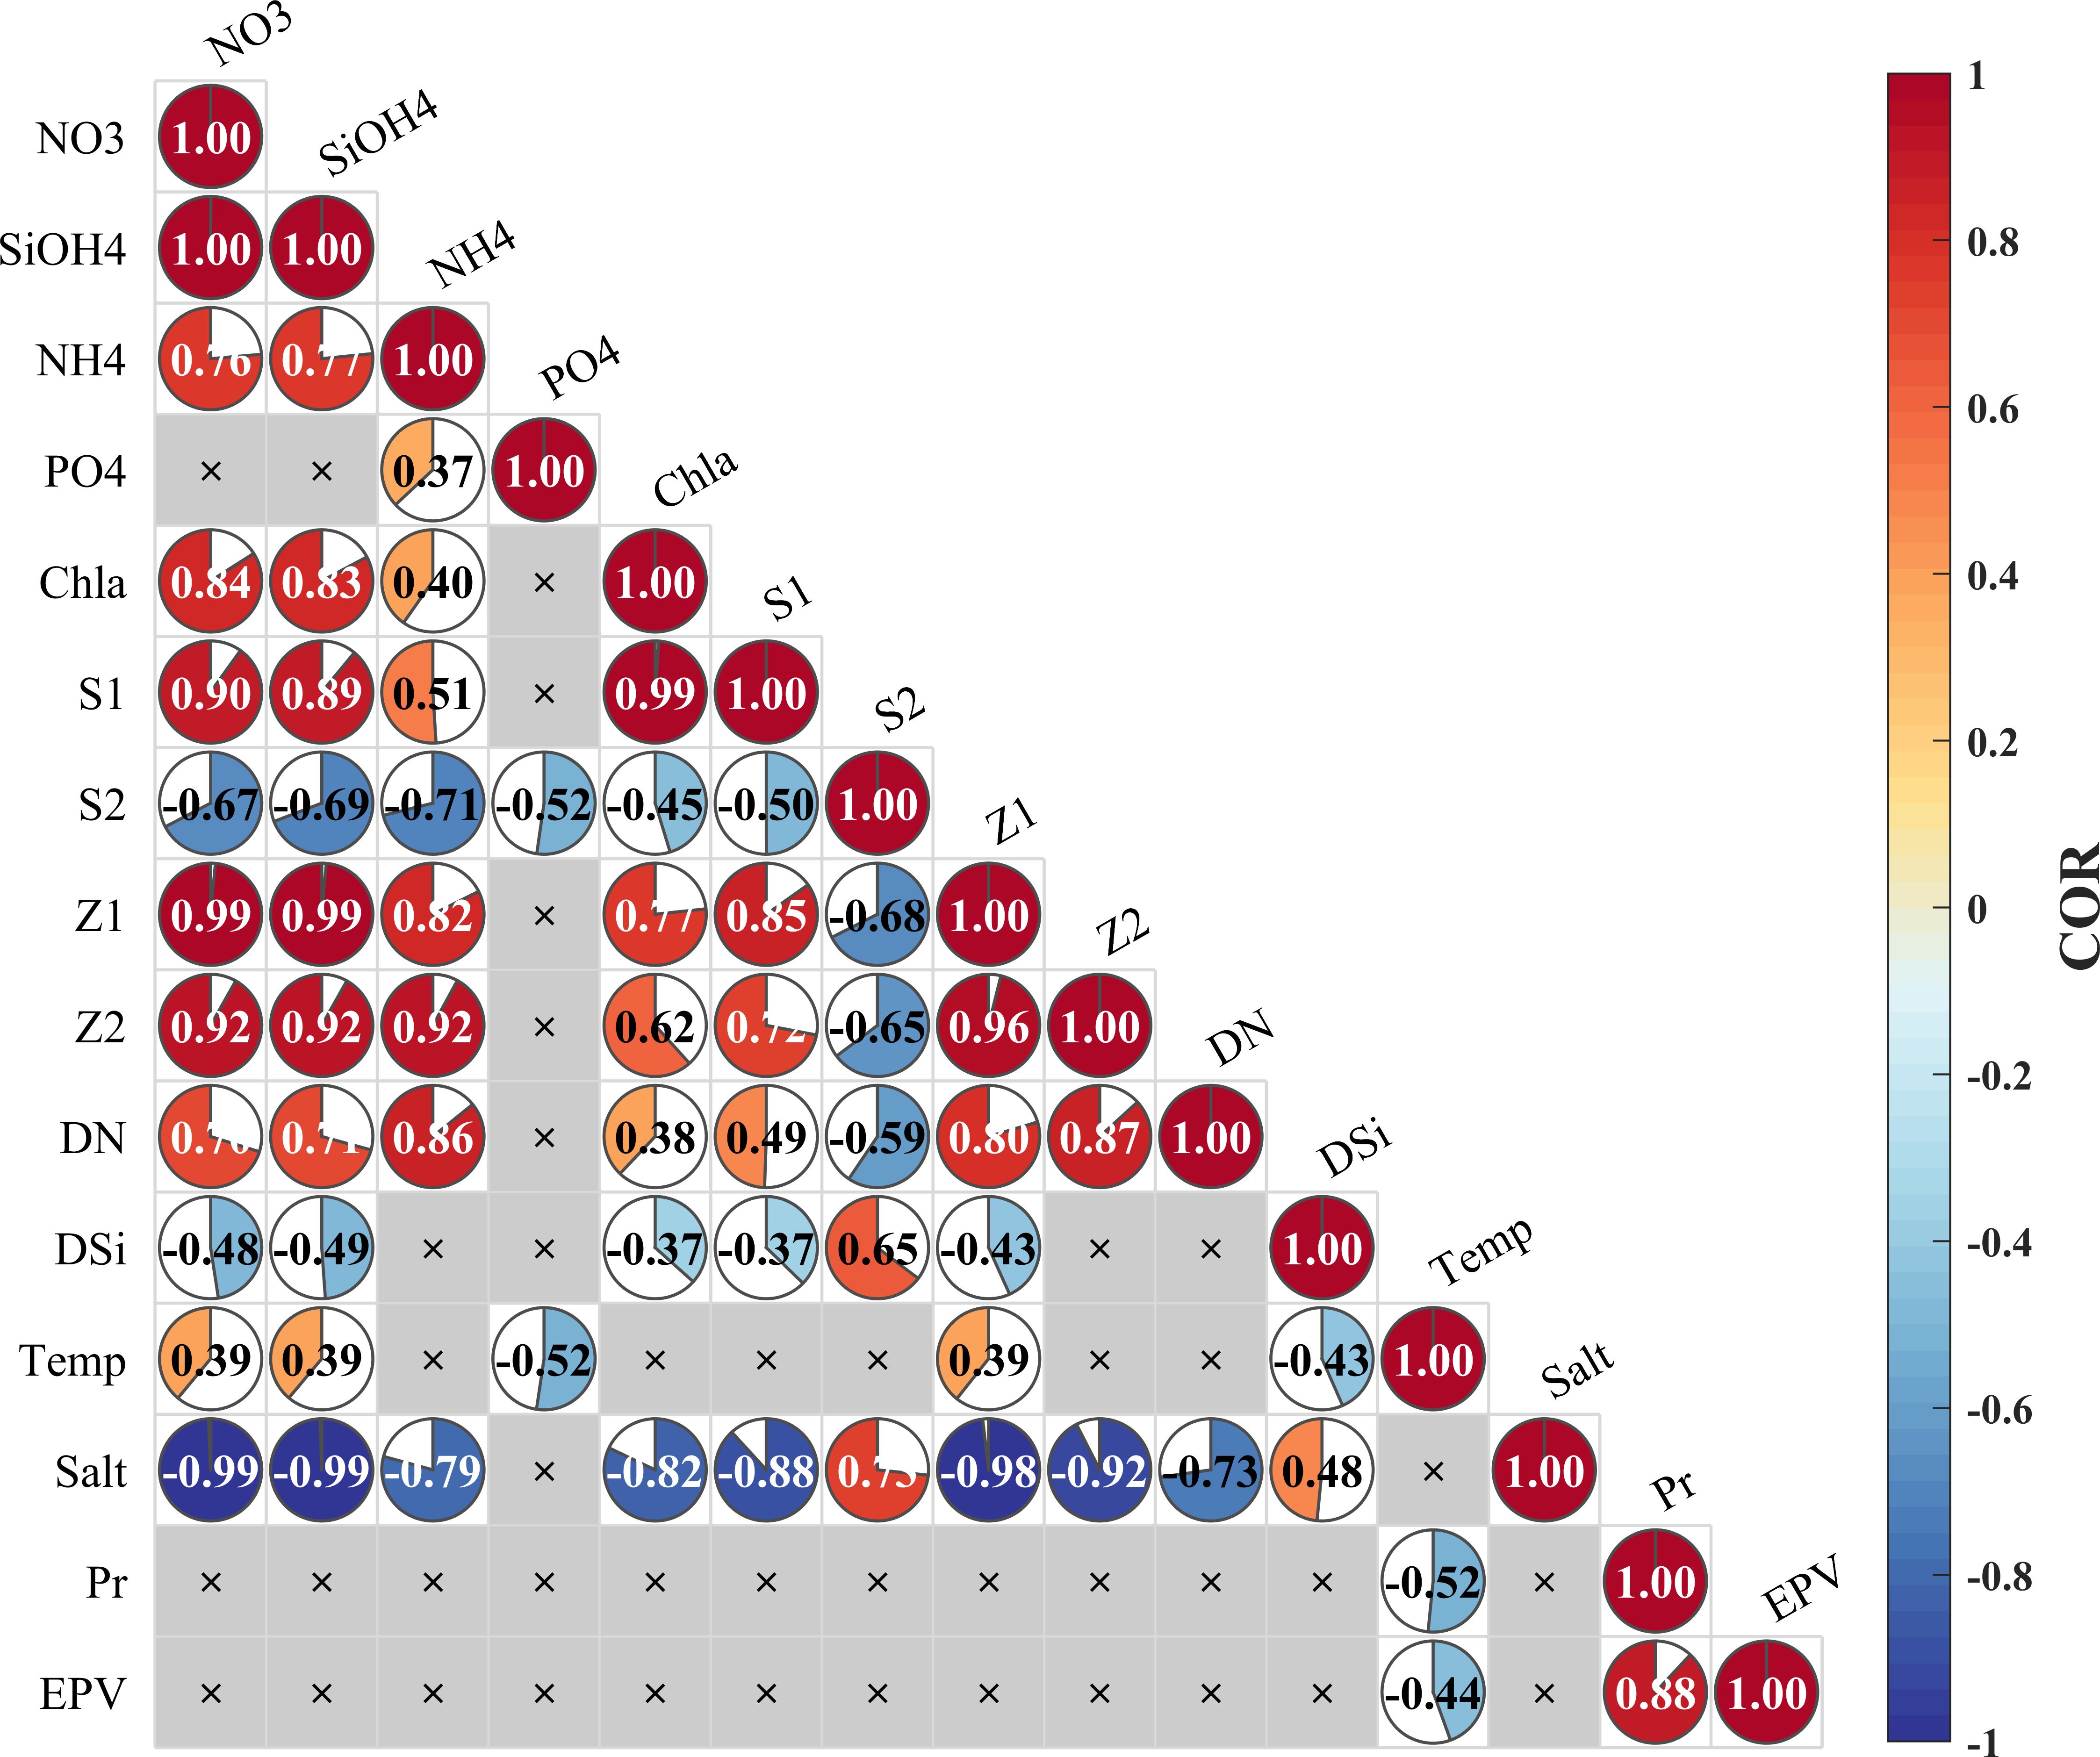
Figure 8 Correlation of variable heatmaps of the surface layer at point A. Temp represents temperature, Salt represents salinity, Pr represents precipitation, S1 represents small phytoplankton, S2 represents diatoms, Z1 represents microzooplankton, Z2 represents mesozooplankton, DN represents detritus nitrogen, and DSi represents detritus silicon.
In summary, the correlation analysis revealed a significant relationship between plume expansion, represented by salinity, and ecological variables. To further quantify the impact of the horizontal advection term, we examined the various contributions of the chlorophyll concentrations in the water column.
Shown as in Figure 9, the results indicate high spatial and temporal consistency between the horizontal advection term and the total variability. The horizontal advection term is larger than the vertical term, which thus allows us to quantitatively determine the dominant role of horizontal advection, and even whether the horizontal advection exceeds the total variability. In general, the changes in the upper layer after typhoon Cempaka occurred were more obvious than those in the lower layer, and the effect of Typhoon Lupit was not obvious in the upper layer at this point. The RATEs of NO3 and Chla also exhibited considerable spatial and temporal consistency, which was also attributed to the dominant role of horizontal advection. Previous studies have noted that the post-typhoon, peak Chla levels typically occur after the peak NO3 levels, reflecting the proliferation of phytoplankton due to nutrient enrichment (Pan et al., 2017). However, in this bloom event, NO3 variability revealed synchronous peaks in both the Chla and NO3 concentrations, maintaining a nearly identical temporal pattern. Additionally, our examination of the NO3 uptake at this point indicated minimal changes, with a smaller degree of variability compared to the RATE of Chla. These findings suggest that the redistribution of water masses and nutrients due to advection is a mechanism that cannot be neglected during typhoon events and that complex interactions occur between physical and ecological processes.
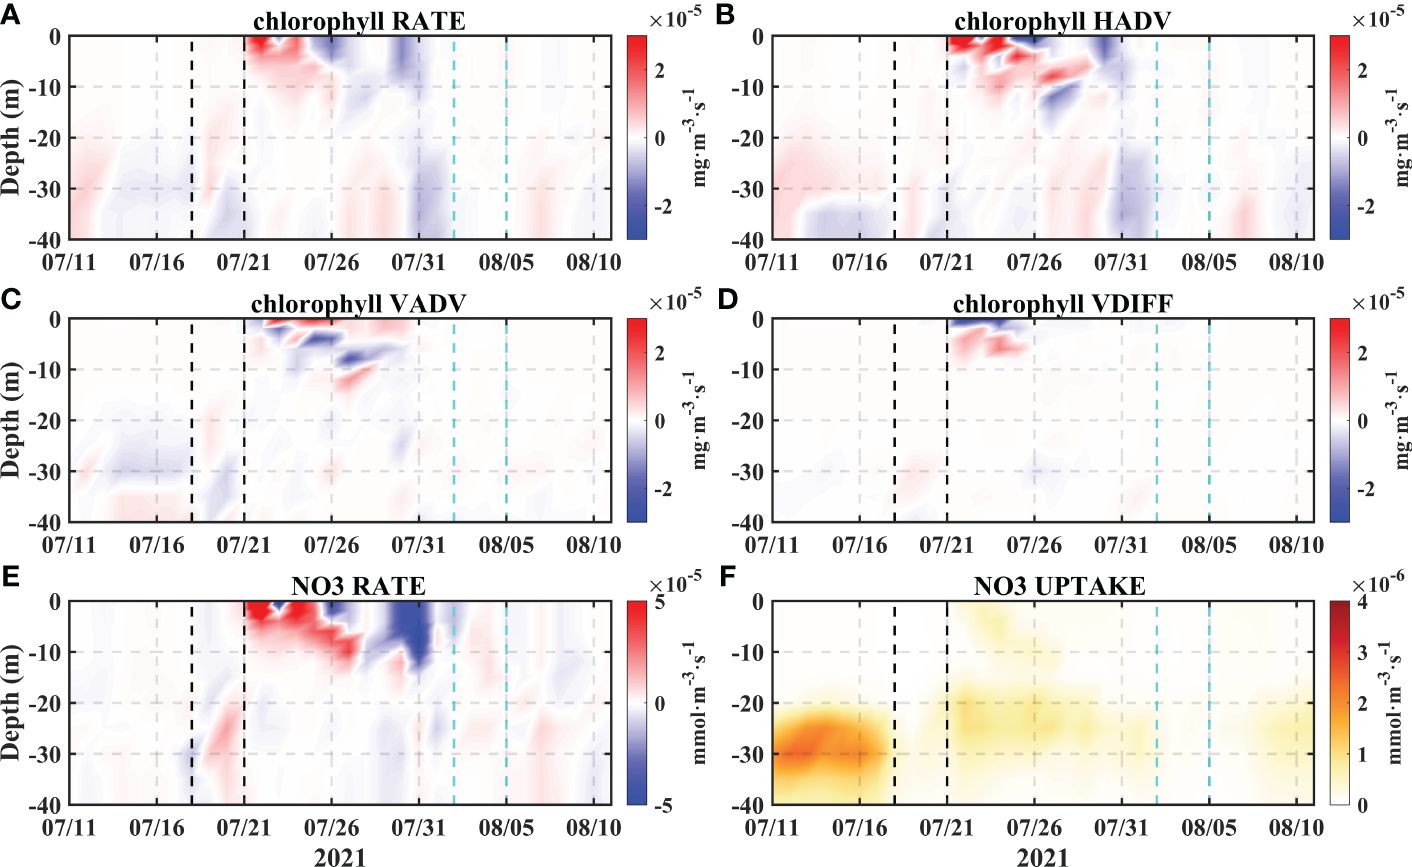
Figure 9 The time series of Chla changes at point A (A–D), as well as the RATE and uptake of NO3 (E, F). The two black dashed lines represent the transit period of Typhoon Cempaka, and the two cyan dashed lines represent the transit of Typhoon Lupit.
4.2 Influence of horizontal advection on ecological elements
After considering the dominant role of the advection process in driving the changes, the specific change process will now be examined. To better understand the factors that contribute to the increased Chla concentrations, the Chla concentration budget of a specific area within the bloom region (Figure 3A, black box) was examined. Based on the previous findings, our primary focus was on the variations within the upper 0-15 m.
The results of the flux calculations reveal an obvious impact of typhoon transit on the changes in Chla concentrations. Consistent with the results for point A, the horizontal advection term dominates, the Chla RATE is highly consistent with the change in horizontal advection, and the contribution from vertical changes is relatively minor. Both typhoon events caused the changes in Chla concentrations in the region to be dominated by horizontal advection, which represented the impact of the typhoons on the PRP. However, according to the different movement directions and intensities of the two typhoons, the increase caused by Lupit’s cyclonic wind field was limited and was smaller than the increase caused by Cempaka; additionally, the increase was quickly dominated by the restored southwest monsoon. The northeast current, influenced by the summer southwest monsoon, causes the flow of the PRP toward the northeast of the estuary (Gan et al., 2010), and the passage of typhoons disrupts the flow dynamics, resulting in an amplified impact of the PRP on the western side of the estuary (Supplementary Figure S3). These findings highlight the dominance of the advection process driven by typhoons in the occurrence of algal blooms, which dissipate as the flow field changes (Zhao et al., 2009; Fang et al., 2022; Feng et al., 2022). However, unlike the findings from previous studies, the temporal fluctuations in the Chla and NO3 concentrations appeared nearly synchronous, emphasizing direct Chla transport rather than a process of nutrient-induced phytoplankton growth. We observed that biological processes contributed negatively to the variability in Chla concentrations (Figure 10A), which persisted until the occurrence of Typhoon Lupit. Subsequently, we aimed to elucidate this occurrence based on the behavior of the ecological elements that were simulated by the model.
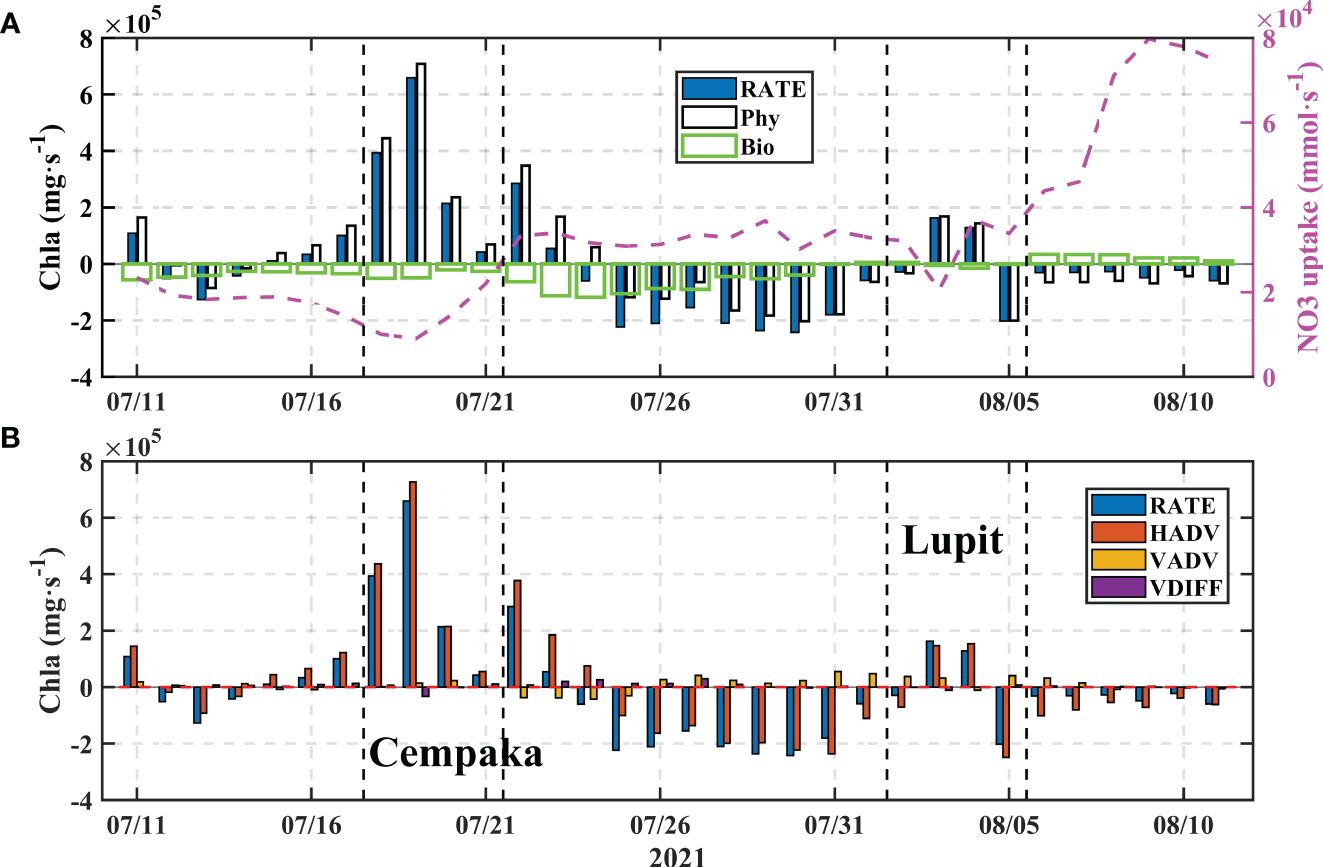
Figure 10 The changes in the total Chla contents in the box region [(A, the box region shown in Figure 3A)] and the results of the Chla budget (0-15 m) for the box (B). The black dashed lines represent the transit periods of the typhoons. The Phy values were calculated as the sum of horizontal advection (HADV), vertical advection (VADV), and vertical diffusion (VDIFF). The pink dashed line represents the change in NO3 uptake.
Before Typhoon Cempaka, small phytoplankton accounted for approximately 63% of the total phytoplankton biomass and reached a maximum proportion of 83% in the box region. This finding is consistent with the findings of Li et al. (2009) and Pan et al. (2017), who reported that under the influence of typhoons, small phytoplankton occupied 90% of the biomass on the coast and established initial dominance. Considering the negative correlation between S1 and S2 (Figure 8), it is likely that there was potential competition for nutrients between the two species. The dynamics of the phytoplankton community are influenced by a combination of temperature, light, and nutrient concentrations (Xiao et al., 2018). Typhoon transit also induces a reduction in radiation flux (Figure 11), and decreasing light intensity also impacts biological processes. Phytoplankton enrichment leads to an increase in light extinction, which is also not conducive to phytoplankton growth in the lower layers (Chai et al., 2002). The variations in NO3 uptake during the occurrence of the typhoons reflect this process (Figure 10A, pink dashed line). The combined impact of radiation flux attenuation and light extinction that is caused by increased phytoplankton concentrations results in a reduction in the uptake rate of NO3 (Lao et al., 2023a). Until the passage of Typhoon Lupit, there was a notable increase in nitrate uptake, aligning with the positive contribution of biological effects on Chla. Specifically, this increase primarily resulted from the growth of small phytoplankton (Figure 11A). The negative biological term for diatoms persists throughout the period. Despite the fact that the model considers the sinking of large phytoplankton, this factor does not primarily account for this trend. As previously mentioned, prior to the typhoon, the region experienced a period with a break in the monsoon, which was not conducive to generation of upwelling and had an impact on the nutrient levels in the upper layer. This could account for the adverse contribution of biological terms to the Chla before the typhoon occurred. After Typhoon Cempaka, following the recovery of radiation flux, there was an increase in NO3 uptake along with PO4 absorption (Figure 11B), but the Bio values remained negative (Figure 10A). When phytoplankton are enriched, zooplankton are also enriched, and the increased feeding pressure of zooplankton could inhibit phytoplankton growth, although the excretions of zooplankton also serve as an important source of nutrients (Chen et al., 2013a; Zhang et al., 2018; Feng et al., 2022). In the CoSiNE model, grazing is the only source term for zooplankton and an important sink term for phytoplankton. Biological term of zooplankton is positive during Cempaka (Figure 10, yellow line), representing the grazing of zooplankton on phytoplankton. In general, the negative biological contribution can be attributed to phytoplankton’s inefficient use of increased nutrients, leading to their loss through grazing.
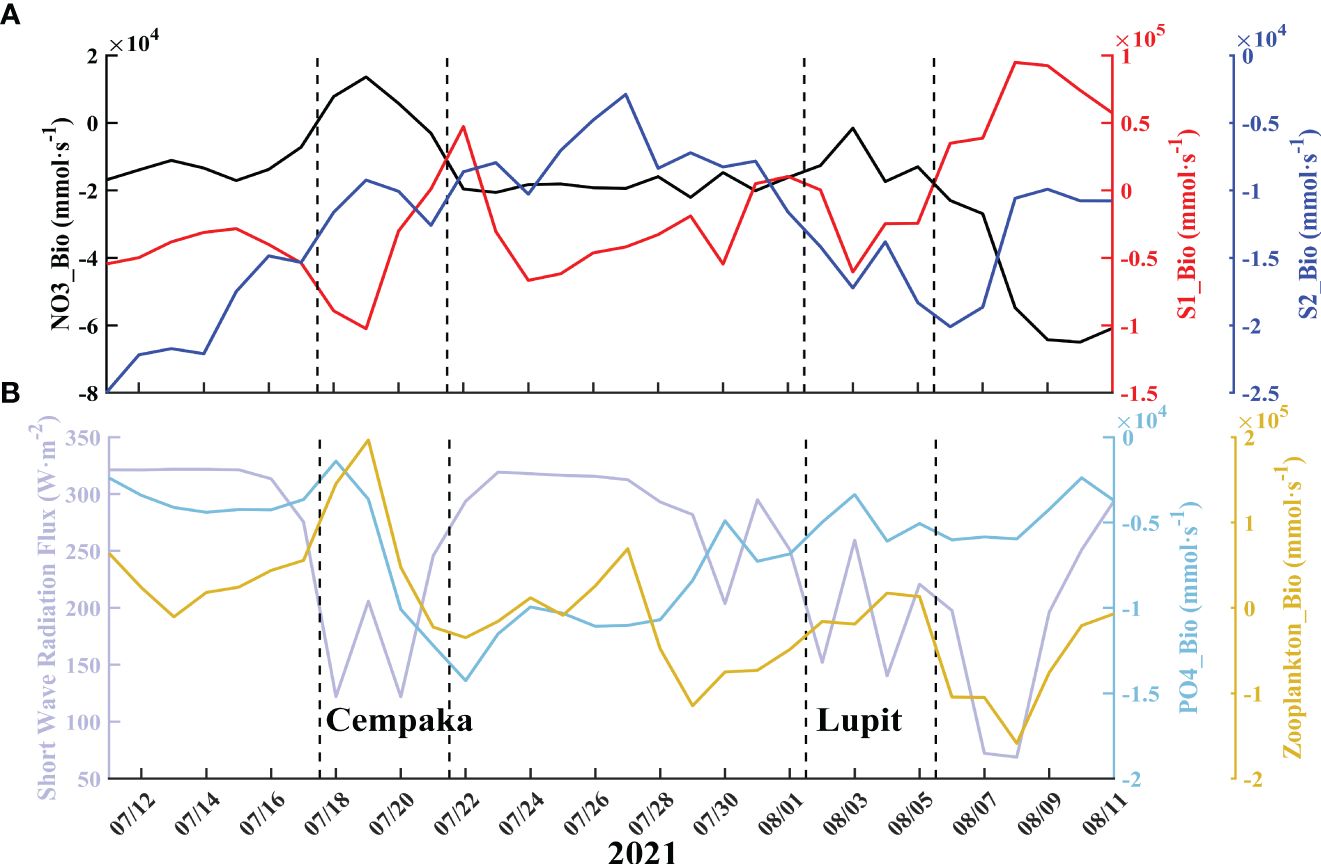
Figure 11 Variations in the percentages of elements in the box region (0-15 m). (A) The line color in each subgraph corresponds to the color of the ordinate and its label. The dashed lines represent the transit periods of the typhoons. In (B), the lilac line represents the average shortwave radiation flux in the box region.
In brief, the advection induced by typhoons triggered complex biogeochemical processes. Following the typhoon, there was an obvious increase in nutrient levels, but the biogeochemical process did not result in a positive contribution of biological processes to Chla. This can be primarily attributed to the combined effects of light limitation and zooplankton feeding pressure. Therefore, this bloom was a simple physical process, and the increase in Chla was mainly due to direct phytoplankton transport. This finding contrasts with previous studies, which primarily attributed blooms to biological alterations (Zheng and Tang, 2007a; Zhao et al., 2009; Liu et al., 2013; Ning et al., 2019). It is believed that future improvements in observational techniques can help to verify these inferences and improve the performance of simulations. Moreover, due to the redistribution process caused by typhoons, the remineralization process of detritus is bound to be affected as well. The role of the changes in nearshore water turbidity during typhoon events is still unknown, and the resuspension process is also an important process that affects phytoplankton growth (Wang and Zhang, 2021; Zhang et al., 2021). Under the strong stirring effect of typhoons, a large amount of oxygen is injected into the interior of the ocean, which can cause the degradation of organic matter in the water column, thereby consuming a large amount of oxygen and releasing a large amount of nutrients, leading to the deterioration of the water, which is not conducive to the growth of phytoplankton (Wang et al., 2017; Lao et al., 2023a). Coupling these processes is believed to be helpful in accurately simulating the biogeochemical impacts of typhoons (Moriarty et al., 2017; Zang et al., 2020). Accurate simulation and prediction of biogeochemical effects caused by typhoons are of great significance to human production activities in coastal areas, such as mariculture (Lin and Lin, 2022; Zhang et al., 2023; Lao et al., 2023b).
5 Conclusions
In this study, we examined the impacts of two typhoons (Cempaka and Lupit) on marine physical and ecological variables. Satellite observations revealed that Typhoon Cempaka triggered an algal event on the western side of the PRE. To understand the underlying mechanisms, a hydrodynamic- biogeochemical coupled model was used to simulate and analyze the changes in the ecological environment that were caused by the typhoon. Our simulations showed that the typhoons resulted in temperature decreases in most areas and obvious increases in Chla and NO3, while the salinity decreased on the western side of the estuary and increased on the eastern side. We conducted a three-dimensional analysis (Figure 5), followed by a section analysis (Figure 6) and single-point analysis (Figure 7) to examine these changes in detail.
The correlation analysis revealed that most of the ecological elements in the surface layer were not significantly correlated with the vertical variations represented by the EPV, but they were associated with the salinity. The abnormal salinity changes were primarily caused by runoff transport, indicating that horizontal advection of the plume, rather than vertical changes, played a dominant role in influencing the coastal ecological environment during the typhoons. The chlorophyll budget determined the dominance of horizontal advection, and this bloom was attributed to phytoplankton transportation rather than to nutrient-induced phytoplankton growth. The redistributions of water and nutrients caused by the typhoons also resulted in complex biogeochemical processes. Moreover, biological processes had a negative contribution to the Chla concentrations in the box region. This resulted from the combined effect of nutrient levels, light, and zooplankton feeding. Furthermore, the differences in the responses of the two phytoplankton functional communities highlighted the importance of considering the effects of different algal species when studying the ecological response to typhoons. Overall, our study provides insights into the physical-ecological coupling processes and the mechanisms that drive the observed changes in marine environments during typhoons.
Data availability statement
The datasets presented in this study can be found in online repositories. The names of the repository/repositories and accession number(s) can be found below: https://doi.org/10.5281/zenodo.8180845.
Author contributions
XZ: Writing – original draft. SG: Writing – review & editing. XMZ: Writing – review & editing. XJ: Writing – review & editing. JZ: Writing – review & editing. SjG: Writing – review & editing.
Funding
The author(s) declare financial support was received for the research, authorship, and/or publication of this article. This study was supported by Southern Marine Science and Engineering Guangdong Laboratory (Zhuhai) (No.SML2023SP219), and the National Key R&D Program of China (No.2023YFC3107702).
Conflict of interest
The authors declare that the research was conducted in the absence of any commercial or financial relationships that could be construed as a potential conflict of interest.
Publisher’s note
All claims expressed in this article are solely those of the authors and do not necessarily represent those of their affiliated organizations, or those of the publisher, the editors and the reviewers. Any product that may be evaluated in this article, or claim that may be made by its manufacturer, is not guaranteed or endorsed by the publisher.
Supplementary material
The Supplementary Material for this article can be found online at: https://www.frontiersin.org/articles/10.3389/fmars.2024.1395804/full#supplementary-material
References
Anglès S., Jordi A., Campbell L. (2015). Responses of the coastal phytoplankton community to tropical cyclones revealed by high-frequency imaging flow cytometry: Phytoplankton responses to tropical cyclones. Limnol. Oceanogr. 60, 1562–1576. doi: 10.1002/lno.10117
Balaguru K., Foltz G. R., Leung L. R., Emanuel K. A. (2016). Global warming-induced upper-ocean freshening and the intensification of super typhoons. Nat. Commun. 7, 13670. doi: 10.1038/ncomms13670
Chai F., Dugdale R. C., Peng T.-H., Wilkerson F. P., Barber R. T. (2002). One-dimensional ecosystem model of the equatorial Pacific upwelling system. Part I: model development and silicon and nitrogen cycle. Deep Sea Res. Part II: Topical Stud. Oceanography 49, 2713–2745. doi: 10.1016/S0967-0645(02)00055-3
Chai F., Jiang M., Chao Y., Dugdale R., Chavez F., Barber R. (2007). Modeling responses of diatom productivity and biogenic silica export to iron enrichment in the equatorial Pacific Ocean. Global Biogeochemical Cycles 21, GB3S90. doi: 10.1029/2006GB002804
Chai F., Wang Y., Xing X., Yan Y., Xue H., Wells M., et al. (2021). A limited effect of sub-tropical typhoons on phytoplankton dynamics. Biogeosciences 18, 849–859. doi: 10.5194/bg-18-849-2021
Chang Y., Liao H.-T., Lee M.-A., Chan J.-W., Shieh W.-J., Lee K.-T., et al. (2008). Multisatellite observation on upwelling after the passage of Typhoon Hai-Tang in the southern East China Sea. Geophys. Res. Lett. 35, L03612. doi: 10.1029/2007GL032858
Chen Y., Chen H., Jan S., Tuo S. (2009). Phytoplankton productivity enhancement and assemblage change in the upstream Kuroshio after typhoons. Mar. Ecol. Prog. Ser. 385, 111–126. doi: 10.3354/meps08053
Chen D., He L., Liu F., Yin K. (2017). Effects of typhoon events on chlorophyll and carbon fixation in different regions of the East China Sea. Estuarine Coast. Shelf Sci. 194, 229–239. doi: 10.1016/j.ecss.2017.06.026
Chen F., Lao Q., Lu X., Wang C., Chen C., Liu S., et al. (2023). A review of the marine biogeochemical response to typhoons. Mar. pollut. Bull. 194, 115408. doi: 10.1016/j.marpolbul.2023.115408
Chen C., Lao Q., Zhou X., Jin G., Zhu Q., Chen F. (2024). Tracks of typhoon movement (left and right sides) control marine dynamics and eco-environment in the coastal bays after typhoons: A case study in Zhanjiang Bay. Sci. Total Environ. 912, 168944. doi: 10.1016/j.scitotenv.2023.168944
Chen D., Lei X., Wang W., Wang G., Han G., Zhou L. (2013b). Upper ocean response and feedback mechanisms to typhoon. Advance Earth Sci. (in Chinese) 28, 1077–1086. doi: 10.11867/j.issn.1001-8166.2013.10.1077
Chen Y., Tang D. (2012). Eddy-feature phytoplankton bloom induced by a tropical cyclone in the South China Sea. Int. J. Remote Sens. 33, 7444–7457. doi: 10.1080/01431161.2012.685976
Chen B., Zheng L., Huang B., Song S., Liu H. (2013a). Seasonal and spatial comparisons of phytoplankton growth and mortality rates due to microzooplankton grazing in the northern South China Sea. Biogeosciences 10, 2775–2785. doi: 10.5194/bg-10-2775-2013
Davis A., Yan X.-H. (2004). ). Hurricane forcing on chlorophyll-a concentration off the northeast coast of the U.S.: HURRICANE FORCING ON CHLOROPHYLL-A. Geophys. Res. Lett. 31, n/a–n/a. doi: 10.1029/2004GL020668
Emanuel K. (1999). Thermodynamic control of hurricane intensity. Nature 401, 665–669. doi: 10.1038/44326
Fang W., Geng B., Xiu P. (2022). Typhoon effects on the vertical chlorophyll distribution on the northern shelf of the South China sea. J. Geophysical Research-Oceans 127, e2022JC019350. doi: 10.1029/2022JC019350
Feng Y., Huang J., Du Y., Balaguru K., Ma W., Feng Q., et al. (2022). Drivers of phytoplankton variability in and near the pearl river estuary, south China sea during typhoon Hato, (2017): A numerical study. J. Geophysical Research-Biogeosciences 127, e2022JG006924. doi: 10.1029/2022JG006924
Gan J., Lu Z., Cheung A., Dai M., Liang L., Harrison P. J., et al. (2014). Assessing ecosystem response to phosphorus and nitrogen limitation in the Pearl River plume using the Regional Ocean Modeling System (ROMS). J. Geophys. Res. Oceans 119, 8858–8877. doi: 10.1002/2014JC009951
Gan J., Lu Z., Dai M., Cheung A. Y. Y., Liu H., Harrison P. (2010). Biological response to intensified upwelling and to a river plume in the northeastern South China Sea: A modeling study. J. Geophys. Res. 115, C09001. doi: 10.1029/2009JC005569
Glenn S. M., Miles T. N., Serokal G. N., Xu Y., Forney R. K., Yu F., et al. (2016). Stratified coastal ocean interactions with tropical cyclones. Nat. Commun. 7, 10887. doi: 10.1038/ncomms10887
Guo S., Zhu X., Ji X., Wang H., Zhang S., Jiang H., et al. (2023). Oceanic and ecological response to native Typhoons Cempaka and Lupit, (2021) along the northern South China Sea continental shelf: comparison and evaluation of global and regional Operational Oceanography Forecasting Systems. Front. Mar. Sci. 10. doi: 10.3389/fmars.2023.1175263
Harrison P. J., Yin K., Lee J. H. W., Gan J., Liu H. (2008). Physical–biological coupling in the pearl river estuary. Continental Shelf Res. 28, 1405–1415. doi: 10.1016/j.csr.2007.02.011
Hazelworth J. (1968). Water temperature variations resulting from hurricanes. J. Geophysical Res. 73, 5105–510+. doi: 10.1029/JB073i016p05105
Jacob S., Koblinsky C. (2007). Effects of precipitation on the upper-ocean response to a hurricane. Monthly Weather Rev. 135, 2207–2225. doi: 10.1175/MWR3366.1
Jiang Y., Wang Y., Tian X., Lin S., Chen S., Yu J., et al. (2023). Upper ocean structure determines the contrasting typhoon-induced chlorophyll-a responses in the Northwest Pacific. Geophysical Res. Lett. 50, e2023GL102930. doi: 10.1029/2023GL102930
Lai Z., Yin K. (2014). Physical–biological coupling induced aggregation mechanism for the formation of high biomass red tides in low nutrient waters. Harmful Algae 31, 66–75. doi: 10.1016/j.hal.2013.09.011
Lao Q., Chen F., Jin G., Lu X., Chen C., Zhou X., et al. (2023a). Characteristics and mechanisms of typhoon-induced decomposition of organic matter and its implication for climate change. JGR Biogeosciences 128, e2023JG007518. doi: 10.1029/2023JG007518
Lao Q., Lu X., Chen F., Chen C., Jin G., Zhu Q. (2023b). A comparative study on source of water masses and nutrient supply in Zhanjiang Bay during the normal summer, rainstorm, and typhoon periods: Insights from dual water isotopes. Sci. Total Environ. 903, 166853. doi: 10.1016/j.scitotenv.2023.166853
Lao Q., Lu X., Chen F., Jin G., Chen C., Zhou X., et al. (2023c). Effects of upwelling and runoff on water mass mixing and nutrient supply induced by typhoons: Insight from dual water isotopes tracing. Limnology Oceanography 68, 284–295. doi: 10.1002/lno.12266
Li G., Wu Y., Gao K. (2009). Effects of Typhoon Kaemi on coastal phytoplankton assemblages in the South China Sea, with special reference to the effects of solar UV radiation. J. Geophys. Res. 114, 2008JG000896. doi: 10.1029/2008JG000896
Li Y., Yang D., Xu L., Gao G., He Z., Cui X., et al. (2022). Three types of typhoon-induced upwellings enhance coastal algal blooms: A case study. J. Geophysical Research-Oceans 127, e2022JC018448. doi: 10.1029/2022JC018448
Lin G., Lin X. (2022). Bait input altered microbial community structure and increased greenhouse gases production in coastal wetland sediment. Water Res. 218, 118520. doi: 10.1016/j.watres.2022.118520
Lin Y., Oey L. (2016). Rainfall-enhanced blooming in typhoon wakes. Sci. Rep. 6, 31310. doi: 10.1038/srep31310
Lin J., Tang D., Alpers W., Wang S. (2014). Response of dissolved oxygen and related marine ecological parameters to a tropical cyclone in the South China Sea. Adv. Space Res. 53, 1081–1091. doi: 10.1016/j.asr.2014.01.005
Liu H., Hu Z., Huang L., Huang H., Chen Z., Song X., et al. (2013). Biological response to typhoon in northern South China Sea: A case study of “Koppu”. Continental Shelf Res. 68, 123–132. doi: 10.1016/j.csr.2013.08.009
Liu S., Yang Y., Tang D., Yan H., Ning G. (2021). Association between the biophysical environment in coastal south China sea and large-scale synoptic circulation patterns: the role of the Northwest Pacific subtropical high and typhoons. Remote Sens. 13, 3250. doi: 10.3390/rs13163250
Lu Z., Gan J. (2015). Controls of seasonal variability of phytoplankton blooms in the Pearl River Estuary. Deep Sea Res. Part II: Topical Stud. Oceanography 117, 86–96. doi: 10.1016/j.dsr2.2013.12.011
Ma W., Chai F., Xiu P., Xue H., Tian J. (2013). Modeling the long-term variability of phytoplankton functional groups and primary productivity in the South China Sea. J. Oceanogr 69, 527–544. doi: 10.1007/s10872-013-0190-8
Ma B., Zhao H. (2021). Distribution characteristics of chlorophyll aand nutrients in the Pearl River Estuary in summer and their relationship with environmental factors. Mar. Environ. Sci. (in Chinese) 40, 707–716. doi: 10.13634/j.cnki.mes.2021.05.008
Moriarty J. M., Harris C. K., Fennel K., Friedrichs M. A. M., Xu K., Rabouille C. (2017). The roles of resuspension, diffusion and biogeochemical processes on oxygen dynamics offshore of the Rhône River, France: a numerical modeling study. Biogeosciences 14, 1919–1946. doi: 10.5194/bg-14-1919-2017
Ning J., Xu Q., Feng T., Zhang H., Wang T. (2019). Upper ocean response to two sequential tropical cyclones over the Northwestern Pacific ocean. Remote Sens. 11, 2431. doi: 10.3390/rs11202431
Pan G., Chai F., Tang D., Wang D. (2017). Marine phytoplankton biomass responses to typhoon events in the South China Sea based on physical-biogeochemical model. Ecol. Model. 356, 38–47. doi: 10.1016/j.ecolmodel.2017.04.013
Pan A., Guo X., Xu J., Huang J., Wan X. (2012). Responses of Guangdong coastal upwelling to the summertime typhoons of 2006. Sci. China Earth Sci. 55, 495–506. doi: 10.1007/s11430-011-4321-z
Price J. (1981). Upper ocean response to a hurricane. J. Phys. Oceanography 11, 153–175. doi: 10.1175/1520-0485(1981)011<0153:UORTAH>2.0.CO;2
Qiu G., Xing X., Chai F., Yan X.-H., Liu Z., Wang H. (2021). Far-field impacts of a super typhoon on upper ocean phytoplankton dynamics. Front. Mar. Sci. 8. doi: 10.3389/fmars.2021.643608
Qiu D., Zhong Y., Chen Y., Tan Y., Song X., Huang L. (2019). Short-term phytoplankton dynamics during typhoon season in and near the pearl river estuary, South China sea. J. Geophysical Research-Biogeosciences 124, 274–292. doi: 10.1029/2018JG004672
Shchepetkin A. F., McWilliams J. C. (2005). The regional oceanic modeling system (ROMS): a split-explicit, free-surface, topography-following-coordinate oceanic model. Ocean Model. 9, 347–404. doi: 10.1016/j.ocemod.2004.08.002
Sun L., Yang Y., Xian T., Lu Z., Fu Y., Fu Y. (2010). Strong enhancement of chlorophyll a concentration by a weak typhoon. Mar. Ecol. Prog. Series. 404, 39–50. doi: 10.3354/meps08477
Sun Y., Zhong Z., Li T., Yi L., Camargo S. J., Hu Y., et al. (2017). Impact of ocean warming on tropical cyclone track over the western north pacific: A numerical investigation based on two case studies. JGR Atmospheres 122, 8617–8630. doi: 10.1002/2017JD026959
Thompson P. A., Paerl H. W., Campbell L., Yin K., McDonald K. S. (2023). Tropical cyclones: what are their impacts on phytoplankton ecology? J. Plankton Res. 45, 180–204. doi: 10.1093/plankt/fbac062
Tsuchiya K., Kuwahara V. S., Yoshiki T., Nakajima R., Miyaguchi H., Kumekawa N., et al. (2014). Phytoplankton community response and succession in relation to typhoon passages in the coastal waters of Japan. J. Plankton Res. 36, 424–438. doi: 10.1093/plankt/fbt127
Wang Y. (2020). Composite of typhoon-induced sea surface temperature and chlorophyll-a responses in the south China sea. J. Geophys. Res. Oceans 125, e2020JC016243. doi: 10.1029/2020JC016243
Wang B., Chen J., Jin H., Li H., Huang D., Cai W. (2017). Diatom bloom-derived bottom water hypoxia off the Changjiang estuary, with and without typhoon influence. Limnology Oceanography 62, 1552–1569. doi: 10.1002/lno.10517
Wang T., Zhang S. (2021). Effect of summer typhoon linfa on the chlorophyll-a concentration in the continental shelf region of northern South China sea. J. Mar. Sci. Eng. 9, 794. doi: 10.3390/jmse9080794
Wang T., Zhang H., Gao L., Zhu L. (2022). Comparison of physical and biological responses to tropical cyclones between the low and middle latitude zones of the western North Pacific. Regional Stud. Mar. Sci. 55, 102535. doi: 10.1016/j.rsma.2022.102535
Wu R., Li L. (2003). Summarization of study on upwelling system in the South China Sea. J. Oceanography Taiwan Strait 22, 269–277. doi: 10.3969/j.issn.1000-8160.2003.02.022
Wu L., Wang B., Geng S. (2005). Growing typhoon influence on east Asia. Geophysical Res. Lett. 32, L18703. doi: 10.1029/2005GL022937
Xiao W., Wang L., Laws E., Xie Y., Chen J., Liu X., et al. (2018). Realized niches explain spatial gradients in seasonal abundance of phytoplankton groups in the South China Sea. Prog. Oceanography 162, 223–239. doi: 10.1016/j.pocean.2018.03.008
Xiu P., Chai F. (2012). Spatial and temporal variability in phytoplankton carbon, chlorophyll, and nitrogen in the North Pacific. J. Geophys. Res. 117, n/a–n/a. doi: 10.1029/2012JC008067
Yang J., Hong B. (2021). Response of the upper northeastern South China Sea to the Typhoon Linfa. Mar. Sci. Bull. (in Chinese) 40, 161–171. doi: 10.11840/j.issn.1001-6392.2021.02.005
Ye H., Yang C., Tang S., Chen C. (2020). The phytoplankton variability in the Pearl River estuary based on VIIRS imagery. Continental Shelf Res. 207, 104228. doi: 10.1016/j.csr.2020.104228
Zang Z., Xue Z. G., Xu K., Bentley S. J., Chen Q., D’Sa E. J., et al. (2020). The role of sediment-induced light attenuation on primary production during Hurricane Gustav, (2008). Biogeosciences 17, 5043–5055. doi: 10.5194/bg-17-5043-2020
Zhang H., He H., Zhang W.-Z., Tian D. (2021). Upper ocean response to tropical cyclones: a review. Geosci. Lett. 8, 1. doi: 10.1186/s40562-020-00170-8
Zhang Y., Wang X., Yin K. (2018). Biological mechanisms of typhoon-induced blooms in the South China Sea. Acta Ecologica Sin. (in Chinese) 38, 5667–5678. doi: 10.5846/stxb201708141461
Zhang X., Yao C., Zhang B., Tan W., Gong J., Wang G., et al. (2023). Dynamics of benthic nitrate reduction pathways and associated microbial communities responding to the development of seasonal deoxygenation in a coastal mariculture zone. Environ. Sci. Technol. 57, 15014–15025. doi: 10.1021/acs.est.3c03994
Zhao B., Qu X., Zhu X., Ye J. (2021). Ocean surface responses to super typhoon in coastal zone based on biogeochemical buoys data: A case study of “Lekima”. Continental Shelf Res. 227, 104505. doi: 10.1016/j.csr.2021.104505
Zhao H., Tang D., Wang Y. (2008). Comparison of phytoplankton blooms triggered by two typhoons with different intensities and translation speeds in the South China Sea. Mar. Ecol. Prog. Ser. 365, 57–65. doi: 10.3354/meps07488
Zhao H., Tang D., Wang D. (2009). Phytoplankton blooms near the Pearl River Estuary induced by Typhoon Nuri. J. Geophys. Res. 114, C12027. doi: 10.1029/2009JC005384
Zhao J., Zhan R., Wang Y. (2020). Different responses of tropical cyclone tracks over the Western North Pacific and North Atlantic to two distinct sea surface temperature warming patterns. Geophysical Res. Lett. 47, e2019GL086923. doi: 10.1029/2019GL086923
Zheng G. M., Tang D. (2007a). Offshore and nearshore chlorophyll increases induced by typhoon winds and subsequent terrestrial rainwater runoff. Mar. Ecol. Prog. Ser. 333, 61–74. doi: 10.3354/meps333061
Zheng G., Tang D. (2007b). Offshore and nearshore chlorophyll increases induced by typhoon winds and subsequent terrestrial rainwater runoff. Mar. Ecol. Prog. Ser. 333, 61–74. doi: 10.3354/meps333061
Zheng G., Tang D. (2007c). Offshore and nearshore chlorophyll increases induced by typhoon winds and subsequent terrestrial rainwater runoff. Mar. Ecol. Prog. Ser. 333, 61–74. doi: 10.3354/meps333061
Zhi H., Wu H., Wu J., Zhang W., Wang Y. (2022). River plume rooted on the sea-floor: seasonal and spring-neap variability of the pearl river plume front. Front. Mar. Sci. 9. doi: 10.3389/fmars.2022.791948
Zhou X., Jin G., Li J., Song Z., Zhang S., Chen C., et al. (2021). Effects of typhoon mujigae on the biogeochemistry and ecology of a semi-enclosed bay in the northern south China sea. JGR Biogeosciences 126, e2020JG006031. doi: 10.1029/2020JG006031
Zhou F., Xue H., Huang D., Xuan J., Ni X., Xiu P., et al. (2015). Cross-shelf exchange in the shelf of the East China Sea. J. Geophys. Res. Oceans 120, 1545–1572. doi: 10.1002/2014JC010567
Zhu Y., Sun J., Wang Y., Li S., Xu T., Wei Z., et al. (2019). Overview of the multi-layer circulation in the South China Sea. Prog. Oceanography 175, 171–182. doi: 10.1016/j.pocean.2019.04.001
Zhu Y., Zhao J., Zhao Y., Shou Y. (2020). Numerical model research on the oil spill in channel of anchorage outside pearl river estuary. J. Coast. Res. 111, 130–139. doi: 10.2112/JCR-SI111-022.1
Keywords: typhoon, the Pearl River Estuary, phytoplankton, biogeochemical, hydrodynamic-ecological model
Citation: Zhang X, Gao S, Ji X, Zhu X, Zheng J and Guo S (2024) Impact of typhoons on the ecological environment of the Pearl River Estuary in the summer of 2021—a study of an algal bloom event. Front. Mar. Sci. 11:1395804. doi: 10.3389/fmars.2024.1395804
Received: 04 March 2024; Accepted: 02 April 2024;
Published: 10 May 2024.
Edited by:
Xianbiao Lin, Ocean University of China, ChinaReviewed by:
Yang Feng, Chinese Academy of Sciences (CAS), ChinaFajin Chen, Guangdong Ocean University, China
Copyright © 2024 Zhang, Gao, Ji, Zhu, Zheng and Guo. This is an open-access article distributed under the terms of the Creative Commons Attribution License (CC BY). The use, distribution or reproduction in other forums is permitted, provided the original author(s) and the copyright owner(s) are credited and that the original publication in this journal is cited, in accordance with accepted academic practice. No use, distribution or reproduction is permitted which does not comply with these terms.
*Correspondence: Shan Gao, gaos@nmefc.cn