High photoreactivity of chromophoric dissolved organic matter derived from Ulva prolifera and Sargassum
 Yong Zhang1,2*
  Kaili Fang1 Mengmeng Liu1
  Jihua Liu1,2 Xiaobo Zhao1
  Weidong Zhai3 Hongsheng Zhang1 Xiaotong Wang1
  Huixiang Xie4*
- 1Institute of Marine Science and Technology, Shandong University, Qingdao, Shandong, China
- 2Qingdao Key Laboratory of Ocean Carbon Sequestration and Negative Emission Technology, Shandong University, Qingdao, China
- 3Southern Marine Science and Engineering Guangdong Laboratory, Zhuhai, China
- 4Institut des sciences de la mer, Université du Québec à Rimouski, Rimouski, QC, Canada
The epipelagic macroalgae of Ulva prolifera and Sargassum are the primary contributors to widespread seaweed tides globally. Both ocean plants release large amounts of chromophoric dissolved organic matter (CDOM) into the surrounding seawater. The photochemical reactivity of this CDOM, however, has not been adequately addressed. In this study, we extracted CDOM from Ulva prolifera and Sargassum, examined their ultraviolet (UV)-visible absorption characteristics, and quantified their broadband apparent quantum yields (AQY) of absorbance photobleaching and photomineralization (in terms of CO2, CO, and CH4 photoproduction). On a per-unit-weight basis, Sargassum leached 3.5 times more CDOM than did Ulva prolifera in terms of the absorption coefficient averaged over 254–500 nm. Both Ulva prolifera and Sargassum CDOM were characterized by quasi-exponential decay absorption spectra, with Sargassum CDOM exhibiting a distinct shoulder over 310–350 nm suggestive of mycosporine amino acids. The Sargassum CDOM had a higher photobleaching AQY but lower photomineralization AQYs compared to Ulva prolifera CDOM. The photobleaching and photomineralization AQYs of both macroalgal CDOM are, however, orders of magnitude higher than those of CDOM in various natural waters. Potential photoproduction rates of CO2 and CO from the Ulva prolifera CDOM and Sargassum CDOM during the bloom periods are several times to orders of magnitude higher than the air-sea fluxes of these gases in the absence of the macroalgae. This study demonstrates that CDOM released by Ulva prolifera and Sargassum is extremely prone to photobleaching and photomineralization, rendering floating mats of these plants in oceans as potential “hotspots” of greenhouse gas emissions to the atmosphere. This photochemical feedback should be considered when assessing ocean afforestation as a CO2 removal approach to mitigate climate warming.
1 Introduction
Chromophoric dissolved organic matter (CDOM) plays important roles in ocean optics and marine ecology and biogeochemistry. Absorption of light by CDOM reduces the penetration of solar radiation into the water column and mitigates the harmfulness of ultraviolet (UV) radiation to marine organisms (Häder et al., 2011). Moreover, CDOM undergoes photochemical transformation, decreasing its absorbance (i.e., photobleaching, e.g., Osburn et al., 2009), producing biologically labile substrates (Mopper et al., 2015) and climate-active gases such as carbon dioxide (CO2), carbon monoxide (CO), and methane (CH4) (i.e., photomineralization, e.g., White et al., 2010; Powers and Miller, 2015; Zhang and Xie, 2015).
CDOM in the ocean can be classified as being either allochthonous (e.g., terrestrial inputs, sedimentary release) or autochthonous (i.e., in situ biological production). Autochthonous CDOM is derived from various organisms, including bacteria (Ortega-Retuerta et al., 2009), phytoplankton, zooplankton, and macroalgae (Nelson and Siegel, 2013 and references therein).
Ulva prolifera (U. prolifera) and Sargassum are two widespread epipelagic macroalgae in global oceans (https://www.gbif.org). U. prolifera belongs to the order of Ulvales and the family of Ulvaceae, whereas Sargassum falls in the order of Fucales and the family of Sargassaceae. These two macroalgae are the primary contributors to the widespread occurrence of seaweed tides globally (Smetacek and Zingone, 2013). One notable location for U. prolifera outbreaks is the southern Yellow Sea in the northwestern Pacific. Blooms of U. prolifera, known as green tides, have become an annual event in the Yellow Sea since 2007, occasionally accompanied by outbreaks of Sargassum, known as golden tides (Figures 1A, C) (Zhang et al., 2019a, Zhang et al., 2019b). Floating Sargassum has historically been most abundant in the Sargasso Sea, and since 2011 a Great Atlantic Sargassum Belt extending from west Africa to the Gulf of Mexico has been observed (Figure 1B), representing the world’s largest macroalgal aggregation (Wang et al., 2018, 2019). Although outbreaks of macroalgae may pose challenges to manage coastal environments (Smetacek and Zingone, 2013), using open-ocean afforestation to capture atmospheric CO2 to mitigate global warming has received increasing attention (Bach et al., 2021).
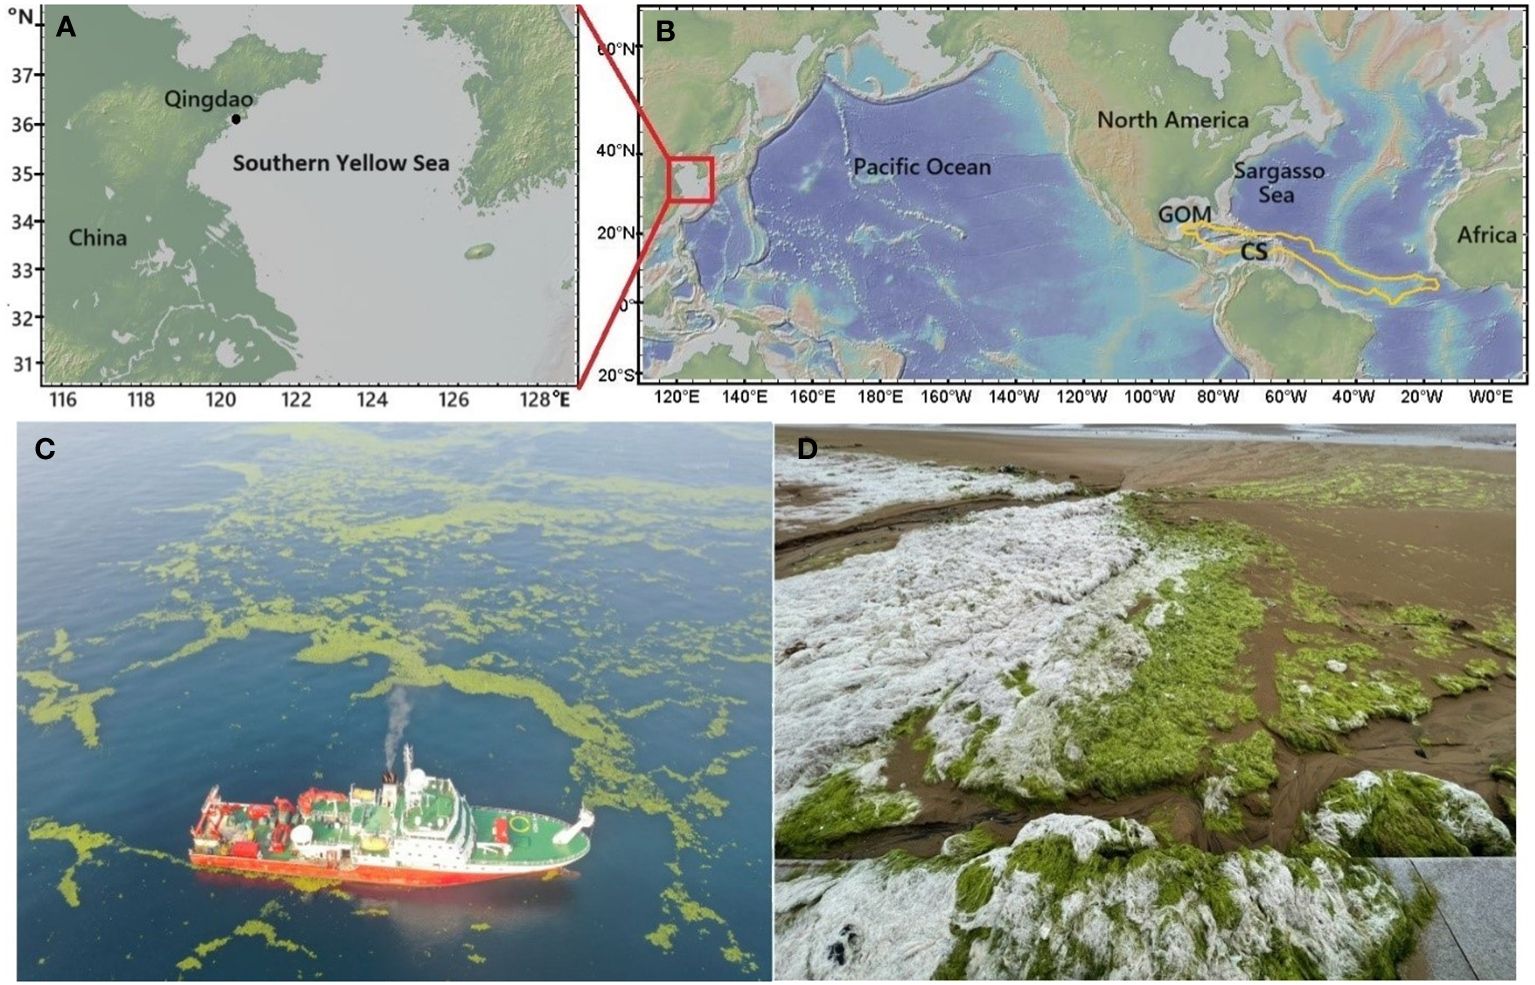
Figure 1 Maps of the southern Yellow Sea (A), dashed lines show the traditional boundaries; the Sargasso Sea, the Caribbean Sea (CS) and Gulf of Mexico (GOM) in the Atlantic Ocean (B), the Great Atlantic Sargassum Belt in summer months is indicated by the golden line (Wang et al., 2019); floating U. prolifera in the southern Yellow Sea (C), photographed on June 22, 2021; U. prolifera fronds washed ashore in Qingdao, China, exhibiting a whitening effect under natural sunlight (D), captured on June 29, 2023. The map was made using GeoMapApp (https://www.geomapapp.org)/CC BY/CC BY (Ryan et al., 2009).
Both U. prolifera and Sargassum release substantial amounts of CDOM at variable rates into surrounding seawater throughout their life stages (e.g., Shank et al., 2010a; Perry et al., 2018; Powers et al., 2019, 2020; Li et al., 2022, 2023). Given the massive biomass of these macroalgae, which can reach millions of tons wet weight (Wang et al., 2018; Xing et al., 2018; Bach et al., 2021), their contribution of CDOM is likely to have a substantial impact on regional marine DOM budgets. While the fate of U. prolifera- and Sargassum-derived CDOM with respect to microbial degradation has been relatively well studied (e.g., Zhang and Wang, 2017; Chen et al., 2020; Li et al., 2023; Xiong et al., 2023), less attention has been paid to their photochemical degradation. Shank et al. (2010b) found that CDOM leached from Sargassum (S-CDOM hereinafter) could be readily photodegraded by simulated solar radiation, losing absorbance and producing CO2 and CO. Sun et al. (2020) reported that both the abundance and molecular weight of U. prolifera-derived CDOM (UP-CDOM hereinafter) decreased under solar irradiation. We observed that U. prolifera washed ashore turned white (Figure 1D), a phenomenon likely attributable to the photobleaching of the plants.
In this study, we compared the absorption characteristics of S-CDOM and UP-CDOM and their photoreactivities with respect to absorbance photobleaching and photoproductions of CO2, CO, and CH4. The significance of photomineralization to the fate of the S- and UP-CDOM and to the regional atmospheric greenhouse gas budgets was discussed.
2 Materials and methods
2.1 Sample collection and pretreatment
Fresh fronds of U. prolifera and Sargassum were collected during the bloom stage from the coast of Qingdao, China in June 2021. Immediately after sampling, they were taken to the laboratory, thoroughly rinsed with autoclave-sterilized seawater (115°C, 30 min), air-dried, and refrigerated at -20°C for further treatments. The fronds (10 g) were cut into small pieces using a ceramic knife and ground to a finer consistency in an agate mortar. The ground fronds were added to 2 L of artificial seawater (salinity 36.03, ASTM D1141-98, 2021) in a glass beaker and ultrasonic-pulverized for 10 min. The suspension was prefiltered through a 6.5-μm bolting silk, followed by filtration sequentially through glass microfiber GF/F filters (Whatman) and 0.20 μm Nylon membranes (Millipore) to remove particles including microorganisms. The final absorbances of the filtrates were below 1.0 (cell pathlength: 1 cm) at 280 nm so that Beer-Lambert Law was obeyed. The corresponding concentration of dissolved organic carbon (DOC) was 959.6 μmol L-1 for the U. prolifera filtrate and 3537.8 μmol L-1 for the Sargassum filtrate.
The filtrate was then bubbled with a mixture of nitrogen (N2) and oxygen (O2) with a mole ratio of 79:21 to reduce the background content of CO2, CO, and CH4. For CO and CH4 samples, the filtrate’s pH increased during bubbling and was adjusted to its original value (7.36) using 0.10 mol L-1 hydrochloric acid; whereas for CO2 samples, the samples’ pH was preadjusted to 4 with 1.0 mol L-1 HCl before bubbling and was adjusted back to the original value using 0.10 mol L-1 NaOH after bubbling. The filtrate was then siphoned into 95.0-mL cylindrical quartz tubes (length: 25.0 cm; i.d.: 2.2 cm). The tubes were sealed without headspace using ground glass stoppers following profuse overflow.
Before use, the GF/F filters were pre-combusted at 450°C for 5 h and Nylon membranes were thoroughly rinsed with Mill-Q water; all glassware was thoroughly rinsed with Milli-Q water, air-dried, and then combusted at 450°C for 5 h.
2.2 Irradiation
Irradiations were performed using a solar simulator (Q-SUN Xe-1, Q-Lab Corporation, USA) equipped with a 1800-W xenon lamp. A special UV glass filter was installed to remove UV radiation with wavelengths< 290 nm. The sample-filled quartz tubes were horizontally immersed (~2 mm below the water surface) in a temperature-controlled water bath (20.0 ± 0.5°C) located immediately beneath the exposure chamber of the solar simulator. The samples were irradiated under full spectrum for 10 min to determine the photoproduction rate of CO and for 24 h to determine the photoproduction rates of CO2 and CH4. All irradiations were accompanied by dark controls. Samples were incubated and analyzed in triplicate.
The photon fluxes of the solar simulator at the upper surface of the irradiation cells were measured using an OL-756 spectroradiometer fitted with a 2-inch OL IS-270 integrating sphere and calibrated using an OL 752-10E irradiance standard. Figure 2 shows a comparison of the solar simulator’s photon flux spectrum with those of sunlight recorded hourly on June 30, 2023, in Qingdao, China (36.369°N, 120.690°E). The solar simulator’s photon flux integrated over the UVB region (280–320 nm) was 0.57 times that of sunlight measured at 11:30, 0.89 times over the UVA region (320–400 nm), and 0.59 times over the VIS region (400–600 nm). Summing these hourly solar photon fluxes yields the daily photon flux in Qingdao on June 30, 2023. The 24-h simulated irradiation for the full spectrum (280–600 nm) corresponds to 2.1 days of the solar irradiation on that specific date (1.88 days for the UVB band, 2.81 days for the UVA band and 1.85 days for the VIS band).
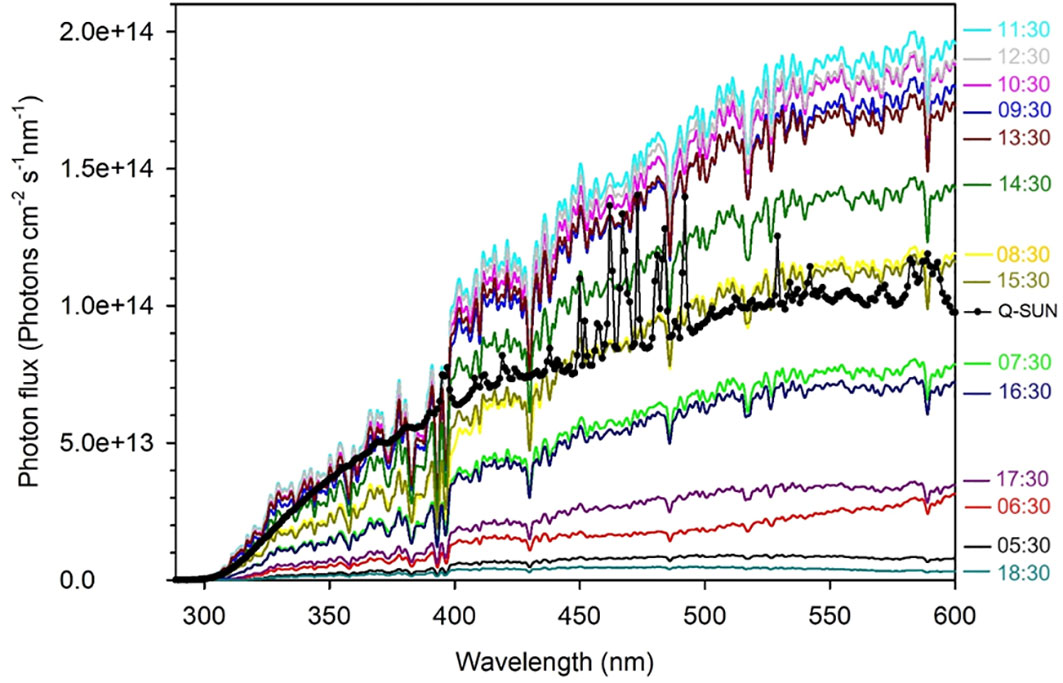
Figure 2 The UV and visible spectral photon fluxes of the Q-Sun solar simulator (the black line with dots) and the clear-sky sun recorded hourly on June 30, 2023 in Qingdao (36.369°N, 120.690°E), China (colored lines).
2.3 Analyses
CH4 and CO were measured using a static headspace method as described by Zhang et al. (2020). Briefly, water samples were transferred to a 50-mL glass syringe fitted with three-way valves (glass fiber-reinforced polypropylene). The syringe was rinsed with sample water before the final drawing. Then 5 mL N2 were introduced into the syringe to obtain a 1:6 gas-to-water ratio. The syringe was vigorously shaken for 6 min and the equilibrated headspace gas was injected into a Peak Performer 1 FID gas chromatograph (1-mL sample loop; Peak laboratories, USA) for quantification of CH4 and CO. The analyzer was equipped with a methanizer to convert CO to CH4 and standardized by frequent injections of a gaseous standard containing 5.00 ppmv CH4 and 4.43 ppmv CO in pure N2 (National Institute of Metrology, China). In keeping with the sample’s 100% relative humidity, the dry standard gas was saturated with water vapor before injection. To estimate the analytical blank, a water sample was repeatedly extracted with pure N2 until the CH4 and CO signals diminished to stable levels. For CH4, ten sequential analyses of the extracted sample arrived at a mean blank of 0.007 nmol kg−1 with a standard deviation of 0.002 nmol kg−1. The lower detection limit, defined as three times the standard deviation, was thus 0.006 nmol kg−1. For CO, the blank was 0.003 nmol kg-1 and the lower detection limit was 0.007 nmol kg-1. The analytical reproducibility was determined to be ± 4% (n = 10) for CH4 at a concentration of ~5 nmol kg−1 and ± 6% (n = 10) for CO at a concentration of ~4 nmol kg-1.
CO2 (in the form of dissolved inorganic carbon, DIC) was measured using an infrared CO2 detector-based AS-C3 DIC Analyzer (Apollo SciTech Inc., USA) calibrated against the Certificated Reference Materials from Andrew G. Dickson’s lab at the Scripps Institution of Oceanography, with a precision of ± 2 μmol kg-1 (Chen et al., 2022). The amounts of photochemically produced CO2, CO, and CH4 were calculated as the differences between the irradiated samples and the parallel dark controls.
Absorbance spectra (250–600 nm, 1-nm intervals) of the filtered water samples were recorded at room temperature using a UV-visible spectrophotometer (Cary 100, Agilent, USA). The samples were placed in 1-cm quartz cuvettes and referenced to Milli-Q water. Absorbance was baseline-corrected by subtracting the average absorbance over an interval of 5 nm around 685 nm (Babin et al., 2003). The Napierian absorption coefficient, aCDOM(λ) (m−1), where λ is wavelength in nanometers, was calculated as 2.303 times the absorbance divided by the cuvette’s pathlength in meters (0.01 m). The lower detection limit for the absorption coefficient measurement, defined as three times the standard deviation of five replicate analyses of pure water, was determined to be 0.02 ± 0.01 m-1 over 280–600 nm.
Spectral slope coefficients over 275–295 nm (S275-295) of CDOM absorption spectra were calculated using linear regression of the log-transformed absorption spectra, following the method of Helms et al. (2008). S275–295 has been used as an indicator of the mean molecular weight of CDOM, with higher S275–295 values associated with lower molecular weights (Helms et al., 2008).
DOC was quantified using a TOC-L Analyzer (Shimadzu, Japan) equipped with an ASI-L autosampler. All samples were pre-acidified with H3PO4 to pH = 2. The instrument was calibrated using potassium hydrogen phthalate standard solutions and checked every six sample runs against the reference deep seawater (DOC: 41–44 μmol L-1) provided by the Hansell laboratory at the University of Miami. The relative standard deviation of replicate measurements of the reference deep seawater was approximately 2%. Instrumental blanks were determined using Milli-Q water and deducted from the samples’ results.
An Orion Versa Star Pro benchtop meter (Thermo Scientific) fitted with a Ross Ultra pH electrode (Orion 8157 BNUMD) was used to determine pH; the system was standardized with three NIST buffers at pH 4.01, 7.00 and 10.01.
2.4 Calculations of absorbed photons and apparent quantum yield
The photon flux absorbed by CDOM at wavelength λ (nm), QCDOM(λ) (mol photons s-1 nm-1), was calculated according to Hu et al. (2002):
In Equation 1, Q0 (mol photons m−2 s−1 nm−1) is the photon flux at the upper water surface inside the quartz cell; aCDOM(λ)(m-1) the geometric mean of the absorption coefficients measured before and after irradiation; at(λ) (m-1) the sum of aCDOM(λ) and the spectral absorption coefficient of pure water (Buiteveld et al., 1994; Pope and Fry, 1997); S the longitudinal cross-section of the quartz tube (0.0042 m2); L the light pathlength of the tube (0.0268 m), calculated as the squared root of the latitudinal cross-section of the tube (Osburn et al., 2001).
AQY, defined as the number of moles of a photoproduct formed per mole of photons absorbed by CDOM, is used to characterize the efficiency of a given CDOM photoreaction (Hu et al., 2002). Broadband (280–500 nm) AQYs for CO2 (AQYCO2 in mol CO2 (mol photons)-1), CO (AQYCO in mol CO (mol photons)-1), and CH4 (AQYCH4 in mol CH4 (mol photons)-1) were calculated using Equation 2.
Since the concentrations of CDOM chromophores are unknown, apparent AQY for photobleaching was calculated as the loss of aCDOM at a given wavelength (e.g., 330 nm, Osburn et al., 2009) divided by the number of moles of photons absorbed by CDOM (AQYble(330) in m-1 (mole photons)-1)):
In Equation 3, the wavelength of 330 nm was chosen to facilitate comparison with earlier studies (e.g., Osburn et al., 2009) and also because maximum photolysis rates of aquatic CDOM occur at or near this wavelength (Hu et al., 2002).
For comparison with earlier studies reporting spectrally resolved AQYs but without providing broadband AQYs, we calculated simulated solar spectrum-weighted mean AQYs ( ) over the wavelength range of 280–500 nm according to Zhang et al. (2006):
In Equation 4, Qλ denotes the spectral irradiance of the solar simulator used in this study (Figure 2); AQYλ the spectrally resolved AQY of absorbance photobleaching, CO2, CO, or CH4 reported previously. To assess the uncertainty of using for comparison with broadband AQYs, we calculated both the broadband AQY and of CO (280–500 nm) for water samples collected from the Estuary and Gulf of St. Lawrence using the spectral CO AQYs and full-spectrum CO photoproduction rates obtained by Zhang et al. (2006). The ratios of the broadband AQY to averaged 1.09 with a standard deviation of 0.29 (n = 54).
3 Results and discussion
3.1 Absorption characteristics of macroalgal CDOM
The absorption coefficients of the original (i.e., unirradiated) UP- and S-CDOM decreased quasi-exponentially with increasing wavelength over the UV-visible range (280–600 nm). A shoulder over 310–355 nm, however, superimposed the general trend of the S-CDOM spectrum, while the UP-CDOM spectrum lacked discernible shoulders (Figures 3A, B). The peak wavelength of the S-CDOM shoulder-converted peak was found to be ~330 nm (Figure 3B inset), which is characteristic of mycosporine-like amino acids (Carreto et al., 2005). Based on the absorption coefficients averaged over 254–500 nm, respectively, Sargassum leached out 3.5 times more CDOM than did U. prolifera per unit wet weight of the macroalgae. The DOC-normalized absorption coefficient at 254 nm (a*CDOM(254)), an indicator of the aromaticity of DOM (Weishaar et al., 2003), was 0.49 L mgC-1 m-1 for UP-CDOM and 0.68 L mgC-1 m-1 for S-CDOM. The relatively higher value for S-CDOM is probably due to Sargassum containing a high content of phlorotannins, a class of polymers of phloroglucinol (1,3,5-trihydroxybenzene) synthesized by brown algae but absent in green algae (Stern et al., 1996; Powers et al., 2020). The disparities in the absorption spectral shape and a*CDOM(254) between the UP- and S-CDOM suggest that different macroalgae may produce different compounds that possess distinct CDOM absorption features. However, the two CDOM pools displayed similar S275-295 values (UP-CDOM: 0.0214 nm-1; S-CDOM: 0.0208 nm-1), implying that they had comparable average molecular weights.
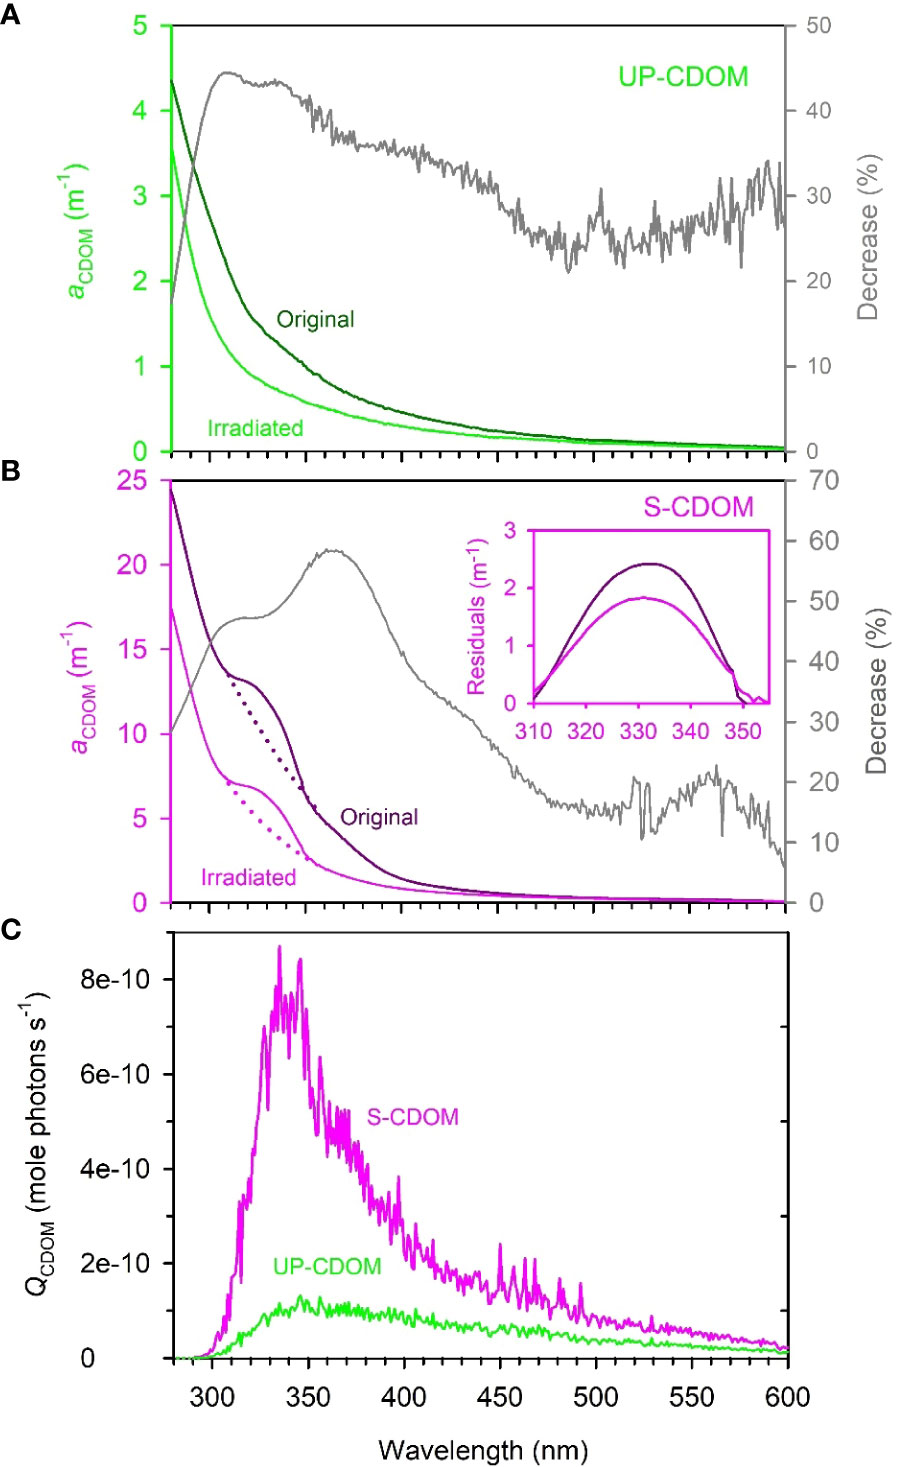
Figure 3 The absorption spectra of UP-CDOM (A) and S-CDOM (B) before and after 24-h irradiation and the spectral photon flux absorbed by UP-CDOM and S-CDOM over the 24-h irradiation (C). Grey lines in (A, B) represent the percent decreases in aCDOM(λ) after the irradiation. In (B), the dotted lines represent the exponential fits of aCDOM(λ) to the wavelength ranges of 300–310 nm and 355–365 nm combined. The inset indicates the residuals between the measured and fitted aCDOM(λ) over the shoulder wavelength range of 310–355 nm. The residuals convert the shoulders into peaks to facilitate the identification of the peak wavelength (~330 nm).
The values of a*CDOM(254) from this study are lower than those reported in the surface Yellow Sea during spring and summer (2.0–2.5 L mg C-1 m-1, Yang et al., 2021). This difference may be attributed to sulfated polysaccharides present in the cell wall and intercellular substance of U. prolifera and Sargassum (Rushdi et al., 2020; Zhong et al., 2020). These polysaccharides contribute much less to the aromaticity than to the DOC content according to their molecular structures. It is also plausible that DOM in the surface Yellow Sea contains significant amounts of terrigenous materials, which are known to be enriched with aromatic moieties relative to marine DOM (Liang et al., 2023). The values of S275-295 from this study are comparable to those reported for fresh, autochthonous CDOM in the northern Yellow Sea (range 0.0200–0.0211, mean 0.0205 ± 0.0007 nm-1, Zhang et al., 2018) and the Bohai Sea (range 0.0228–0.0241 nm-1, mean 0.0235 ± 0.0006 nm-1, Zhang et al., 2022). In contrast, older CDOM in these two areas exhibited higher S275-295 values (0.0260 and 0.0270 nm-1, respectively) (Zhang et al., 2018, 2022).
3.2 Photobleaching of macroalgal CDOM
After the 24-h irradiation, the mean absorption coefficient in the UVB, UVA, and VIS regimes decreased, respectively, by 37.3%, 39.2%, and 28.3% for the UP-CDOM (Figure 3A) and by 40.6%, 51.9%, and 22.9% for the S-CDOM (Figure 3B). UVA thus led to the largest reduction of the mean absorption coefficient for both CDOM pools, in line with the absorbed photon flux being strongest within this band (Figure 3C). The photobleaching increased S275-295 by 86% (from 0.0214 to 0.0399 nm-1) for UP-CDOM and by 49% (from 0.0208 to 0.0310 nm-1) for S-CDOM, indicating decreases in the average molecular weight of CDOM. Notably, the characteristic shoulder in the S-CDOM spectrum persisted after the irradiation (Figure 3B) but the shoulder area, calculated as the integral of the shoulder aCDOM(λ) over 310–355 nm (Figure 3B inset), decreased by 21%. This decrease was less than the 53% reduction in the corresponding background area represented by the integral of the background aCDOM(λ) (dotted lines) over the same wavelength range (Figure 3B), suggesting that the shoulder-specific compound is less prone to photobleaching than the rest of the S-CDOM.
The 24-h irradiation decreased the aCDOM(330) by 44% (from 1.38 m-1 to 0.78 m-1) for UP-CDOM and by 48% (from 12.01 m-1 to 6.29 m-1) for S-CDOM. Following Equation (3), AQYble(330) is calculated to be 466 m-1 (mole photons)-1 for UP-CDOM and 1108 m-1 (mole photons)-1 for S-CDOM (Table 1). S-CDOM was thus more susceptible to photobleaching than UP-CDOM. Note that the wavelength of 330 nm is within the absorption shoulder of S-CDOM. Since the shoulder-specific compound is relatively less susceptible to photobleaching than the background S-CDOM (see above), the difference in AQYble(330) between the two CDOM pools could be even larger if only the background S-CDOM were considered. The AQYble(330) values for UP- and S-CDOM are much higher than those reported previously for CDOM in the Saguenay river (154 m-1 (mole photons)-1) (Zhang and Xie, 2015), CDOM in groundwaters of the Îles-de-la-Madeleine in the Gulf of St. Lawrence, Canada (0.02–0.18 m-1 (mol photons)-1) (Qi et al., 2018) and CDOM in waters across the Mackenzie shelf of the western Canadian Arctic (0.080–0.140 m-1 (mole photons)-1) (Osburn et al., 2009) (Table 1). This comparison indicates that the UP- and S-CDOM are far more sensitive to photobleaching than CDOM in natural waters on an absorbed-photons basis.
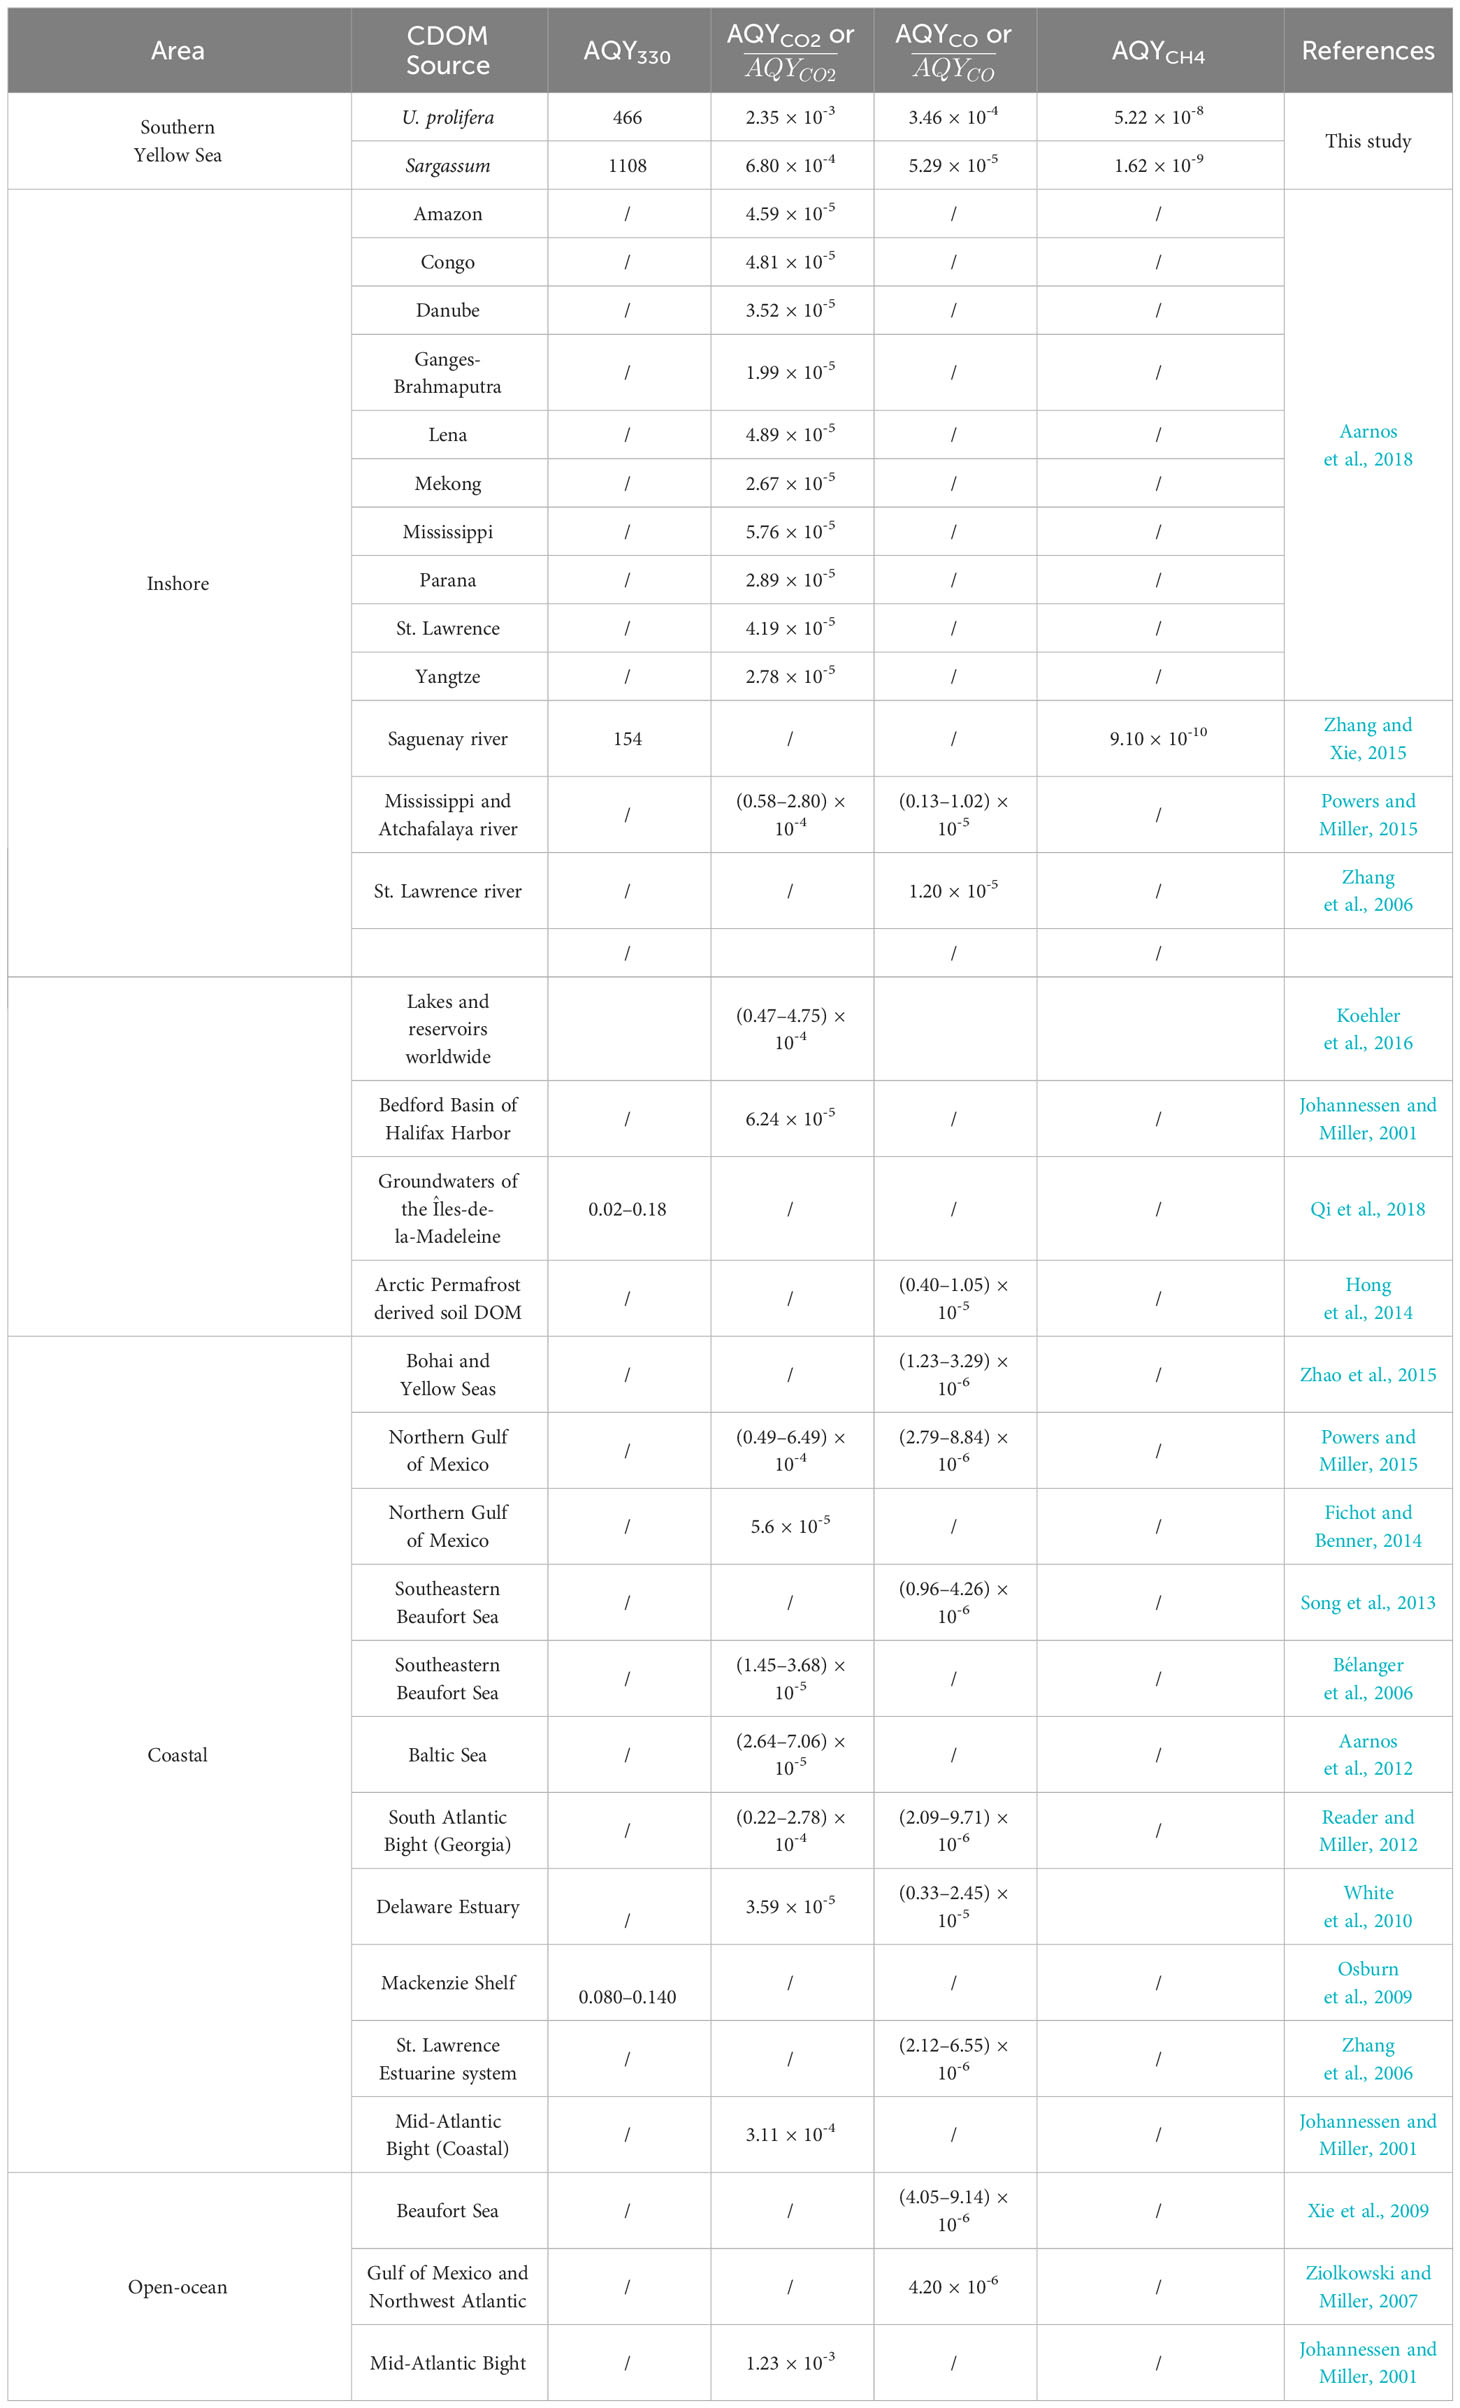
Table 1 Comparison of broadband AQYble(330), AQYCO2, AQYCO, and AQYCH4 in this study with the broadband AQYble(330), , , and broadband AQYCH4 derived from literature over 280–500 nm.
3.3 Photomineralization of macroalgal CDOM
3.3.1 Broadband AQYs of CO2, CO and CH4
For CDOM derived from both macroalgae, AQYCO2 is the highest, followed sequentially by AQYCO and AQYCH4 (Table 1). The ratio of AQYCO2 to AQYCO is 6.8 for UP-CDOM and 12.9 for S-CDOM. These ratios are in line with those of 7–22.5 obtained from coastal waters (e.g., Johannessen, 2000; Xie et al., 2009; White et al., 2010; Reader and Miller, 2012), higher than that of 2 for the Halifax Harbor, and lower than that of 63 for the Mid-Atlantic Bight (Johannessen, 2000). The ratio of AQYCO to AQYCH4 is 6628 for UP-CDOM and 32857 for S-CDOM. The ratio for UP-CDOM (6628) closely aligns with those for CDOM in the upper St. Lawrence estuary (6300–9594) and is an order of magnitude higher than those for CDOM in blue waters of the North Atlantic and North Pacific (460–499) (Li et al., 2020). The ratio for S-CDOM (32857) markedly exceeds those for CDOM in waters across the land-ocean continuum (460–15869) (Li et al., 2020).
The two macroalgal CDOM pools displayed substantially different AQYs for the three gaseous photoproducts. The AQY of UP-CDOM is 3.5 times that of S-CDOM for CO2, 6.5 times for CO, and 32.5 times for CH4 (Table 1). CO2 photoproduction has long been considered to result from photodecarboxylation and is thus linked to carboxylic groups (Miles and Brezonik, 1981; Xie et al., 2004). CO photoproduction likely involves both carbonyls (Pos et al., 1998) and methoxy-substituted aromatics as precursors (Stubbins et al., 2008; Ossola et al., 2022). Photoproduction of CH4 plausibly goes through the generation of methyl radicals from methyl groups, followed by H-abstraction from diverse substrates (Bange & Uher, 2005). Several methyl compounds, such as acetone (Bange & Uher, 2005), dimethyl sulfide (Zhang & Xie, 2015), and acetaldehyde (Xie et al., 2019), have been identified as potential CH4 precursors. The different AQYs of UP- and S-CDOM could partly stem from differing photochemical efficiencies of the relevant precursory substrates and/or different proportions of these substrates in the bulk CDOM pools. The higher photobleaching AQY (Section 3.1) but lower photomineralization AQYs of S-CDOM relative to UP-CDOM imply that a higher proportion of the S-CDOM was photochemically transformed into transparent or weakly absorbing materials instead of mineralized products.
Both the AQYCO2 and AQYCO values of the UP- and S-CDOM in this study are orders of magnitude higher than those of CDOM in inshore, coastal, and open-ocean waters worldwide (Table 1). The AQYCH4 values for UP- and S-CDOM are 2–57 times higher than those for CDOM in the Saguenay River water (9.1 × 10⁻¹⁰, Zhang and Xie, 2015). These results indicate that the fresh UP- and S-CDOM are more prone to photomineralization than CDOM in various natural waters. The lower AQYCO values for CDOM in natural waters could partly result from CDOM photobleaching by pre-exposure to sunlight in the environment. Photobleaching, particularly at the initial stage, can rapidly reduce the CO photoproduction efficiency (Zhang et al., 2006).
3.3.2 Potential contributions to the cycles of CO2, CO, and CH4 in the southern Yellow Sea
The high photoreactivities of UP- and S-CDOM demonstrated above suggest that these CDOM pools may significantly contribute to the cycles of CO2, CO, and CH4 in surface oceans at local or regional scales during blooms of U. prolifera and Sargassum. In principle, the photoproduction rates of these gases from the macroalgal CDOM in surface oceans can be approximated by multiplying their broadband AQYs by the solar photon fluxes absorbed by the macroalgal CDOM, ignoring the difference between the spectral composition of the solar-simulated radiation used for determining the broadband AQYs and that of the natural solar radiation reaching the surface oceans (Figure 2). It is, however, difficult to obtain the fraction of solar photon fluxes absorbed by the macroalgal CDOM within floating macroalgal mats because of the strong and irregular interference of the underwater light field by the macroalgae. In this study, we therefore do not target floating macroalgal mats themselves. Instead, we will focus on the areas immediately downstream of the floating mats, assuming that the surface-water concentrations of the macroalgal DOM in these areas are similar to those inside the macroalgal mats.
In 2017, surface-water DOC concentration in the southern Yellow Sea area with floating U. prolifera increased from 105.2 μmol C L-1 at the early stage of the U. prolifera bloom (April) to 136.4 μmol C L-1 during the peak bloom (June), and fell to 107.3 μmol C L-1 during the senescing period (late August and early September) (Wang et al., 2020). Given that the southern Yellow Sea receives no large river runoff and that its surface water residence time is about 5–6 years (Liu et al., 2019), the difference in DOC concentration between April and June (i.e., 31.2 μmol C L-1) can be approximately equated to the net accumulation of DOC newly released from U. prolifera. This new DOC accounted for 23% of the bulk DOC in the surface water in June 2017. In June 2019, DOC in waters covered by dense U. prolifera was 36% higher than those without U. prolifera in the southern Yellow Sea (Li et al., 2023). U. prolifera usually blooms (i.e., green tides) from mid-April to mid-August (https://www.mnr.gov.cn/sj/).
The monthly-mean daily photon fluxes over 280–500 nm during green-tide periods in the southern Yellow Sea are derived using the Simple Model of the Atmospheric Radiative Transfer of Sunshine version 2.9.5 (SMARTS) (Gueymard, 1995, 2001). The key inputs of this model are as follows: site pressure: 101.325 mb; altitude: 0 km, height: 0 km; default atmosphere: mid-latitude summer; CO2 concentration: 413 ppmv; extraterrestrial spectrum: Gueymard, 2004 (synthetic); aerosol model: S&F_Maritime; albedo: fixed broadband albedo. Outputs of the model are presented in Table 2. Assuming that the UV and visible absorption coefficients of CDOM are roughly proportional to DOC and that CDOM is the dominant light absorber over 280-500 nm in surface water immediately downstream of the U. prolifera bloom, ~29% (the average of 23% and 36%) of the daily photon flux is absorbed by the UP-CDOM released during the U. prolifera bloom. Multiplying the broadband AQYs for the UP-CDOM (Table 1) by the daily photon fluxes absorbed by the UP-CDOM yields photoproduction rates of 1.57–1.83 × 10⁴ μmol CO2 m-2 d-1, 2.31–2.69 × 10³ μmol CO m-2 d-1, and 0.35–0.41 μmol CH4 m-2 d-1 (Table 2). In this calculation, the DOC ascribed to release from U. prolifera obtained from June was applied to the entire bloom period (i.e., mid-April to mid-August). The ranges represent the maximum variation of the solar irradiance among different months.
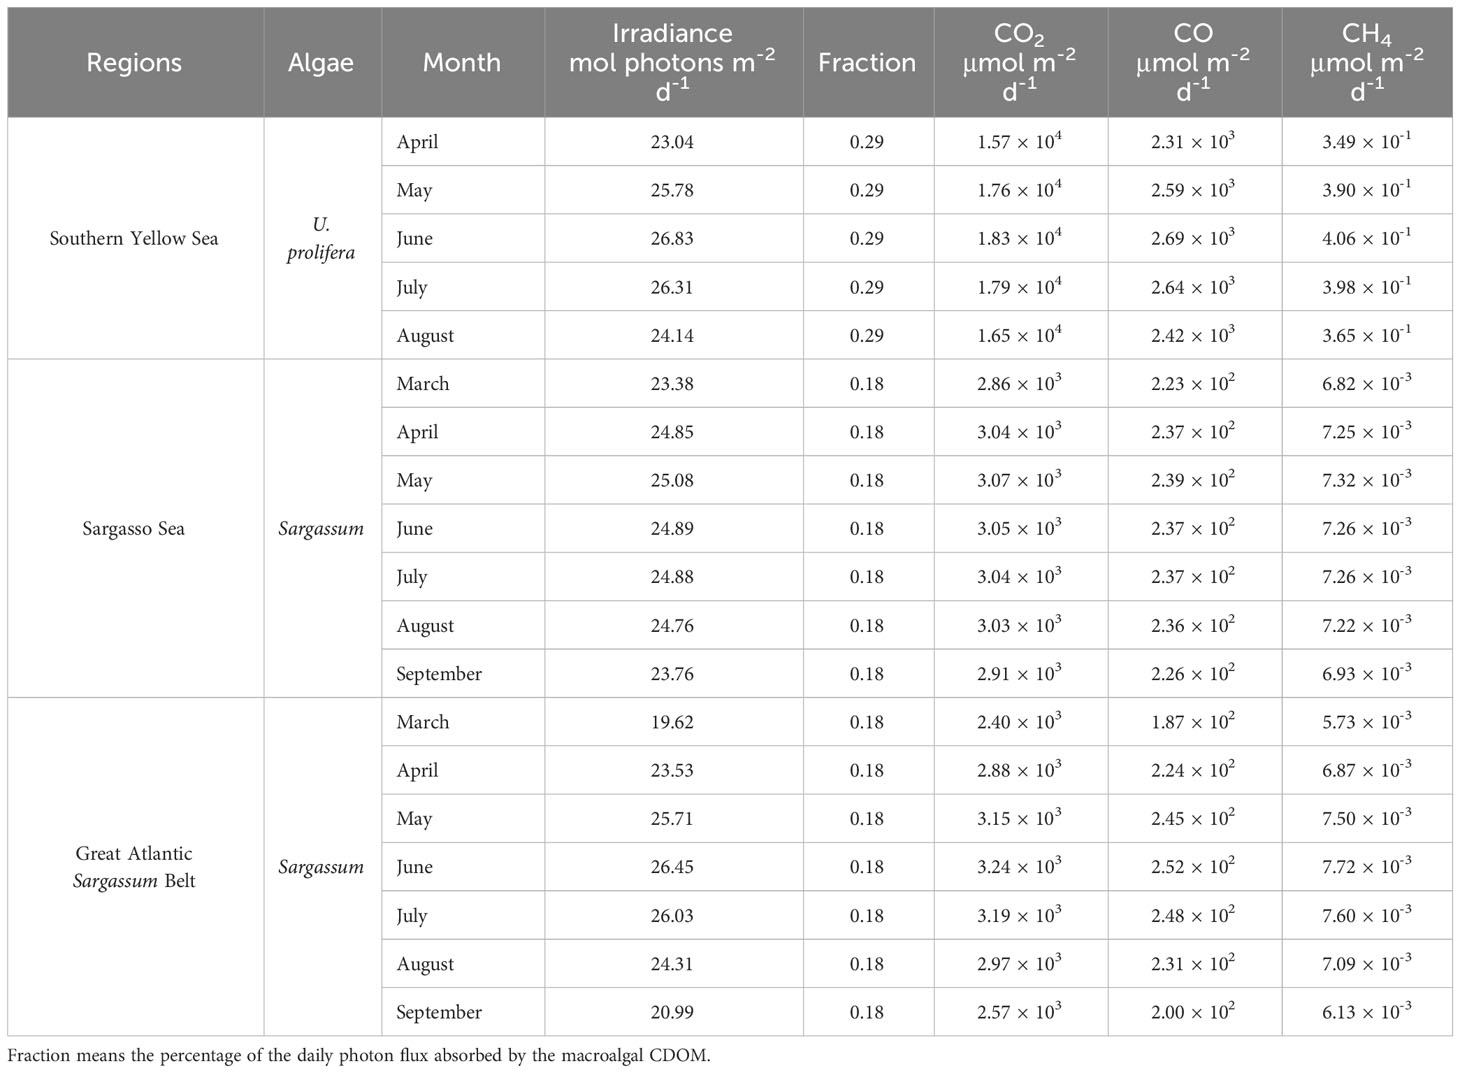
Table 2 Monthly-mean daily total irradiance integrated over 280–500 nm derived from SMARTS 295 and estimated photoproduction rates of CO2, CO and CH4 from UP-CDOM or S-CDOM during the bloom periods of U. prolifera or Sargassum in different regions.
The Yellow Sea overall is a sink of atmospheric CO2 at an influx of 356–2740 µmol m-2 d-1 (Choi et al., 2019; Wang and Zhai, 2021; Ko et al., 2022). The estimated photoproduction rate of CO2 is 6–51 times this influx, suggesting that the influx of CO2 in areas downstream of floating U. prolifera mats may be reduced or even the sign of the CO2 flux may be reversed.
The estimated CO photoproduction rates from UP-CDOM (2.31–2.69 × 10³ μmol m-2 d-1) are two orders of magnitude higher than the CO photoproduction rates (50.8 μmol m-2 d-1 in spring (Yang et al., 2011) and 23.8 μmol m-2 d-1 in autumn (Zhao et al., 2015) and two to three orders of magnitude higher than the sea-to-air CO fluxes obtained in the Yellow Sea areas free of green tides, 1.23–18.60 μmol m-2 d-1 in spring (Yang et al., 2011) and 0.08–4.58 μmol m-2 d-1 in summer (Wang et al., 2015). Therefore, CDOM released during U. prolifera outbreaks could greatly accelerate local or regional biogeochemical cycling of CO, including its emission to the atmosphere and microbial consumption (Wang et al., 2015).
The estimated CH4 photoproduction rates from the UP-CDOM (0.35–0.41 μmol m-2 d-1) are close to the lower end of the reported sea-to-air CH4 flux range in the Yellow Sea areas free of green tides in spring and summer (0.81–17.5 μmol m-2 d-1, Zhang et al., 2004, 2023). Hence, U. prolifera outbreaks may also enhance CH4 emission fluxes locally or regionally.
The effect of S-CDOM on photoproduction of these gases in the southern Yellow Sea cannot be assessed due to lack of data on the contribution of Sargassum to DOC or CDOM in this region.
3.3.3 Potential contributions to the cycles of CO2, CO, and CH4 in the Sargasso Sea
Sargassum blooms (i.e., golden tides) typically occur from March to September in the tropical Atlantic (Johns et al., 2020). During the bloom season, Sargassum carbon can account for ~18% of the phytoplankton carbon in the Great Atlantic Sargassum Belt (Wang et al., 2018). Similarly, assuming that the UV and visible absorption coefficients of CDOM were roughly proportional to the carbon content and that CDOM was the dominant light absorber in surface water, ~18% of the daily photon flux was absorbed by the S-CDOM released during the Sargassum bloom. Assuming that the broadband AQYs of CO2, CO and CH4 for CDOM derived from the Sargassum in the southern Yellow Sea also apply to the Sargassum in the Sargasso Sea (Table 1), the photoproduction rate of the gases are calculated to be 2.57–3.24 × 10³ μmol CO2 m-2 d-1, 1.87–2.52 × 10² μmol CO m-2 d-1, and 5.73–7.72 × 10⁻³ μmol CH4 m-2 d-1 in the golden-tide area in the Sargasso Sea and the Great Atlantic Sargassum Belt (Table 2).
Although the Sargasso Sea is a net sink for atmospheric CO2 on an annual basis (0.68–1.92 × 10³ μmol m-2 d-1) (Bates et al., 1998; Nelson et al., 2001), in summer it is a CO2 source at an efflux of 1.92–2.53 × 10³ μmol m-2 d-1 in the area clear of Sargassum (Bates et al., 1998). The estimated CO2 photoproduction rate from S-CDOM (2.57–3.24 × 10³ μmol m-2 d-1) is 1.3–3.8 times the summer efflux, potentially enhancing the strength of the CO2 emission.
The estimated CO photoproduction rates from S-CDOM (1.87–2.52 × 10² μmol m-2 d-1) are one to two orders of magnitude higher than the CO photoproduction rate of ~50 μmol m-2 d-1, CO bio-consumption rate of 7.75–98.58 μmol m-2 d-1, and sea-to-air CO flux of 2.93–6.54 μmol m-2 d-1 at the onset of spring and midsummer in the upper Sargasso Sea near Bermuda (Zafiriou et al., 2008).
The estimated CH4 photoproduction rate from the S-CDOM (5.73–7.72 × 10⁻³ μmol m-2 d-1) is three orders of magnitude lower than the sea-air CH4 efflux of 1.6–4.4 μmol m-2 d-1 in the upper Sargasso Sea (Holmes et al., 2000) or the average efflux of 1.9 μmol m-2 d-1 in the subtropical North Atlantic (Kolomijeca et al., 2022).
The photoproduction rates of CO2, CO, and CH4 in the Great Atlantic Sargassum Belt are also presented in Table 2. They are in similar magnitudes to those in the Sargasso Sea. Although no sufficient literature data of these gases are available for the Sargassum belt, it is reasonable to posit that photomineralization of S-CDOM may also significantly enhance the cycling of CO2 and CO, including their outgassing rates, during the bloom periods.
4 Conclusions
Both UP- and S-CDOM displayed quasi-exponential decay absorption spectra over the UV-VIS range. The S-CDOM spectrum, however, possessed a broad shoulder over the 310–355 nm range that is suggestive of mycosporine amino acids. S-CDOM gave rise to a higher a*CDOM(254) than that of UP-CDOM, indicating a higher aromaticity of S-CDOM. The different chemical and optical characteristics of the two CDOM pools led to S-CDOM showing a higher photobleaching efficiency but a lower photomineralization efficiency compared to UP-CDOM. However, the photobleaching and photomineralization efficiencies of both CDOM pools are orders of magnitude higher than those of CDOM in various natural waters. Moreover, the two macroalgal CDOM pools showed the highest AQYs for CO2, followed sequentially by CO and CH4.
The presumed release of large amounts of fresh CDOM from extensive mats of floating U. prolifera and Sargassum in surface oceans, combined with the very high photoreactivity of this macroalgal CDOM, may provide photochemical “hotspots” leading to enhanced emissions of greenhouse gases, such as CO2 CO and CH4, to the atmosphere on local or regional scales. This effect should be considered when assessing ocean afforestation as a CO2 removal method to mitigate climate warming.
This study only serves to offer a first-approximation assessment of photochemical release of greenhouse gases from floating U. prolifera and Sargassum mats. Potentially large uncertainties remain and need to be mitigated in the future. These include but are not limited to 1) a verification of if the photoreactivity of CDOM leached from the ground fronds of these macroalgae is similar to that of CDOM released from live macroalgae, and 2) field investigations quantifying CDOM released from U. prolifera and Sargassum in the real environments.
Data availability statement
The original contributions presented in the study are included in the article/supplementary material. Further inquiries can be directed to the corresponding authors.
Author contributions
YZ: Conceptualization, Funding acquisition, Project administration, Supervision, Writing – original draft, Writing – review & editing. KF: Data curation, Formal analysis, Investigation, Writing – original draft. ML: Data curation, Formal analysis, Investigation, Writing – original draft. JL: Methodology, Validation, Writing – original draft. XZ: Methodology, Validation, Writing – original draft. WZ: Methodology, Validation, Writing – original draft. HZ: Methodology, Validation, Writing – original draft. XW: Investigation, Methodology, Writing – original draft. HX: Supervision, Validation, Writing – review & editing.
Funding
The author(s) declare financial support was received for the research, authorship, and/or publication of this article. This work was supported by the National Natural Science Foundation of China (grant No. 42076032) and Key Research and Development Program of Shandong Province (2020ZLYS04).
Conflict of interest
The authors declare that the research was conducted in the absence of any commercial or financial relationships that could be construed as a potential conflict of interest.
Publisher’s note
All claims expressed in this article are solely those of the authors and do not necessarily represent those of their affiliated organizations, or those of the publisher, the editors and the reviewers. Any product that may be evaluated in this article, or claim that may be made by its manufacturer, is not guaranteed or endorsed by the publisher.
References
Aarnos H., Gélinas Y., Kasurinen V., Gu Y., Puupponen V. M., Vähätalo A. V. (2018). Photochemical mineralization of terrigenous DOC to dissolved inorganic carbon in ocean. Global Biogeochem. Cy. 32, 250–266. doi: 10.1002/2017GB005698
Aarnos H., Ylöstalo P., Vähätalo A. V. (2012). Seasonal phototransformation of dissolved organic matter to ammonium, dissolved inorganic carbon, and labile substrates supporting bacterial biomass across the Baltic Sea. J. Geophys. Res. 117, G01004. doi: 10.1029/2010JG001633
ASTM D1141-98 (2021). Standard Practice for Preparation of Substitute Ocean Water. (United States: ASTM International)
Babin M., Stramski D., Ferrari G. M., Claustre H., Bricaud A., Obolensky G., et al. (2003). Variations in the light absorption coefficients of phytoplankton, nonalgal particles, and dissolved organic matter in coastal waters around Europe. J. Geophys. Res. 108, 3211. doi: 10.1029/2001JC000882
Bach L. T., Tamsitt V. T., Gower J., Hurd C. L., Raven J. A., Boyd P. W. (2021). Testing the climate intervention potential of ocean afforestation using the Great Atlantic Sargassum Belt. Nat. Commun. 2, 2556. doi: 10.1038/s41467-021-22837-2
Bange H. W., Uher G. (2005). Photochemical production of methane in natural waters: Implications for its present and past oceanic source. Chemosphere 58, 177–183. doi: 10.1016/j.chemosphere.2004.06.022
Bates N. R., Takahashi T., Chipman D. W., Knap A. H. (1998). Variability of pCO2 on diel to seasonal timescales in the Sargasso Sea near Bermuda. J. Geophys. Res. 103, 15567–15585. doi: 10.1029/98JC00247
Bélanger S., Xie H., Krotkov N., Larouche P., Vincent W. F., Babin M. (2006). Photomineralization of terrigenous dissolved organic matter in Arctic coastal waters from 1979 to 2003: Interannual variability and implications of climate change. Global Biogeochem. Cy. 20, GB4005. doi: 10.1029/2006GB002708
Buiteveld H., Hakvoort J. M. H., Donze M. (1994). “The optical properties of pure water,” in SPIE Proceedings on Ocean Optics XII, vol. 2258 . Ed. Jaffe J. S., 174–183. doi: 10.1117/12.190060
Carreto J. I., Carignan M. O., Montoya N. G. (2005). A high-resolution reverse-phase liquid chromatography method for the analysis of mycosporine-like amino acids (MAAs) in marine organisms. Mar. Biol. 146, 237–252. doi: 10.1007/s00227-004-1447-y
Chen J., Li H. M., Zhang Z. H., He C., Shi Q., Jiao N. Z., et al. (2020). DOC dynamics and bacterial community succession during long-term degradation of Ulva prolifera and their implications for the legacy effect of green tides on refractory DOC pool in seawater. Water Res. 185, 116268. doi: 10.1016/j.watres.2020.116268
Chen Z. Y., Zhai W. D., Yang S., Zhang Y., Liu P. F. (2022). Exploring origin of oxygen-consuming organic matter in a newly developed quasi-hypoxic coastal ocean, the Bohai Sea (China): A stable carbon isotope perspective. Sci. Total Environ. 837, 155847. doi: 10.1016/j.scitotenv.2022.155847
Choi Y., Kim D., Cho S., Kim T. W. (2019). Southeastern Yellow Sea as a sink for atmospheric carbon dioxide. Mar. pollut. Bull. 149, 110550. doi: 10.1016/j.marpolbul.2019.110550
Fichot C. G., Benner R. (2014). The fate of terrigenous dissolved organic carbon in a river-influenced ocean margin. Global Biogeochem. Cy. 28, 300–318. doi: 10.1002/2013GB004670
Gueymard C. (1995). SMARTS, A simple model of the atmospheric radiative transfer of sunshine: Algorithms and performance assessment (1679 Clearlake Road, Cocoa, FL 32922: Professional Paper FSEC-PF-270-95, Florida Solar Energy Center).
Gueymard C. (2001). Parameterized transmittance model for direct beam and circumsolar spectral irradiance. Solar Energy 71, 325–346. doi: 10.1016/S0038-092X(01)00054-8
Häder D. P., Helbling E. W., Williamson C. E., Worrest R. C. (2011). Effects of UV radiation on aquatic ecosystems and interactions with climate change. Photochem. Photobiol. Sci. 10, 242–260. doi: 10.1039/c0pp90036b
Helms J. R., Stubbins A., Ritchie J. D., Minor E. C., Kieber D. J., Mopper K. (2008). Absorption spectral slopes and slope ratios as indicators of molecular weight, source, and photobleaching of chormophoric dissolved organic matter. Limnol. Oceanogr. 53, 955–969. doi: 10.4319/lo.2008.53.3.0955
Holmes M. E., Sansone F. J., Rust T. M., Popp B. N. (2000). Methane production, consumption, and air-sea exchange in the open ocean: An evaluation based on carbon isotopic ratios. Global Biogeochem. Cy. 14, 1–10. doi: 10.1029/1999GB001209
Hong J., Xie H. X., Guo L. D., Song G. S. (2014). Carbon monoxide photoproduction: Implications for photoreactivity of Arctic permafrost-derived soil dissolved organic matter. Environ. Sci. Technol. 48, 9113–9121. doi: 10.1021/es502057n
Hu C., Muller-Karger F. E., Zepp R. G. (2002). Absorbance, absorption coefficient, and apparent quantum yield: A comment on common ambiguity in the use of these optical concepts. Limnol. Oceanogr. 47, 1261–1267. doi: 10.4319/lo.2002.47.4.1261
Johannessen S. C. (2000). A photochemical sink for dissolved organic carbon in the ocean. Canada: Dalhousie University, Halifax, Nova Scotia. Ph.D. Thesis.
Johannessen S. C., Miller W. L. (2001). Quantum yield for the photochemical production of dissolved inorganic carbon in seawater. Mar. Chem. 76, 271–283. doi: 10.1016/S0304-4203(01)00067-6
Johns E. M., Lumpkin R., Putman N. F., Smith R. H., Muller-Karger F. E., Rueda-Roa D. T., et al. (2020). The establishment of a pelagic Sargassum population in the tropical Atlantic: Biological consequences of a basin-scale long distance dispersal event. Prog. Oceanogr. 182, 102269. doi: 10.1016/j.pocean.2020.102269
Ko Y. H., Seok M. W., Jeong J. Y., Noh J. H., Jeong Jm. Mo A., Kim T. W. (2022). Monthly and seasonal variations in the surface carbonate system and air–sea CO2 flux of the Yellow Sea. Mar. pollut. Bull. 181, 113822. doi: 10.1016/j.marpolbul.2022.113822
Koehler B., Broman E., Tranvik L. J. (2016). Apparent quantum yield of photochemical dissolved organic carbon mineralization in lakes. Limnol. Oceanogr. 61, 2207–2221. doi: 10.1002/lno.10366
Kolomijeca A., Marx L., Reynolds S., Cariou T., Mawji E., Boulart C. (2022). An update on dissolved methane distribution in the subtropical North Atlantic Ocean. Ocean Sci. 18, 1377–1388. doi: 10.5194/os-18-1377-2022
Li H. M., Feng X. T., Xiong T. Q., He C., Wu W. C., Shi Q., et al. (2023). Green tides significantly alter the molecular composition and properties of coastal doc and perform dissolved carbon sequestration. Environ. Sci. Technol. 57, 770–779. doi: 10.1021/acs.est.2c05684
Li Y., Fichot C. G., Geng L., Scarratt M. G., Xie H. (2020). The contribution of methane photoproduction to the oceanic methane paradox. Geophy. Res. Lett. 47, e2020GL088362. doi: 10.1029/2020GL088362
Li B. H., Hu J. W., Liu C. Y., Li P. F., Yang G. P. (2022). Changes in dissolved organic pool and regulation of associated nutrients during green tides: A case study of Ulva prolifera bloom in the southern Yellow Sea. Sci. Total Environ. 838, 155878. doi: 10.1016/j.scitotenv.2022.155878
Liang S. K., Zhang M. Z., Wang X. K., Li H. G., Li S. S., Ma H. Y., et al. (2023). Seasonal dynamics of dissolved organic matter bioavailability coupling with water mass circulation in the South Yellow Sea. Sci. Total Environ. 904, 166671. doi: 10.1016/j.scitotenv.2023.166671
Liu X., Dunne J. P., Stock C. A., Harrison M. J., Adcroft A., Resplandy L. (2019). Simulating water residence time in the coastal ocean: A global perspective. Geophys. Res. Lett. 46, 13910–13919. doi: 10.1029/2019GL085097
Miles C., Brezonik P. (1981). Oxygen consumption in humic-colored waters by a photochemical ferrous-feric catalytic cycle. Environ. Sci. Technol. 15, 1089–1095. doi: 10.1021/es00091a010
Mopper K., Kieber D. J., Stubbins A. (2015). “Marine photochemistry of organic matter: Processes and impacts,” in Biogeochemistry of marine dissolved organic matter. Eds. Hansell D.A., Carlson C. A. (United States Burlington: Academic Press), 389–450.
Nelson N. B., Bates N. R., Siegel D. A., Michaels A. F. (2001). Spatial variability of the CO2 sink in the Sargasso Sea. Deep-Sea Res. II 48, 1801–1821. doi: 10.1016/S0967-0645(00)00162-4
Nelson N. B., Siegel D. A. (2013). The global distribution and dynamics of chromophoric dissolved organic matter. Annu. Rev. Mar. Sci. 5, 447–476. doi: 10.1146/annurev-marine-120710-100751
Ortega-Retuerta E., Frazer T. K., Duarte C. M., Ruiz-Halpern S., Tovar-Sánchez A., Arrieta J. M., et al. (2009). Biogeneration of chromophoric dissolved organic matter by bacteria and krill in the Southern Ocean. Limnol. Oceanogr. 54, 1941–1950. doi: 10.4319/lo.2009.54.6.1941
Osburn C. L., Retamal L., Vincent W. F. (2009). Photoreactivity of chromophoric dissolved organic matter transported by the Mackenzie River to the Beaufort Sea. Mar. Chem. 115, 10–20. doi: 10.1016/j.marchem.2009.05.003
Osburn C. L., Zagarese H. E., Morris D. P., Morris, Hargreaves B. R., Cravero W. E. (2001). Calculation of spectral weighting functions for the solar photobleaching of chromophoric dissolved organic matter in temperate lakes. Limnol. Oceanogr. 46, 1455–1467. doi: 10.4319/lo.2001.46.6.1455
Ossola R. O., Gruseck R., Houska J., Manfrin A., Vallieres M., McNeill K. (2022). Photochemical production of carbon monoxide from dissolved organic matter: Role of lignin methoxyarene functional groups. Environ. Sci. Technol. 56, 13449–13460. doi: 10.1021/acs.est.2c03762
Perry R. A., Vaudrey J. M. P., Dierssen H. M. (2018). Long range transport and carbon and nitrogen dynamics of floating seagrass wracks in Greater Florida Bay. Estuar. Coast. Shelf Sci. 209, 7–17. doi: 10.1016/j.ecss.2018.05.006
Pope R. M., Fry E. S. (1997). Absorption spectrum (380–700 nm) of pure water, II, Integrating cavity measurements. Appl. Optics 36, 8710–8723. doi: 10.1364/AO.36.008710
Pos W. H., Riemer D. D., Zika R. G. (1998). Carbonyl sulfide (OCS) and carbon monoxide (CO) in natural waters: evidence of a coupled production pathway. Mar. Chem. 62, 89–101. doi: 10.1016/S0304-4203(98)00025-5
Powers L. C., Del Vecchio R., Blough N. V., McDonald N., Schmitt-Kopplin P., Gonsior M. (2020). Optical properties and photochemical transformation of the dissolved organic matter released by Sargassum. Front. Mar. Sci. 7. doi: 10.3389/fmars.2020.588287
Powers L. C., Hertkorn N., McDonald N., Schmitt-Kopplin P., Del Vecchio R., Blough N. V., et al. (2019). Sargassum sp. act as a large regional source of marine dissolved organic carbon and polyphenols. Global Biogeochem. Cy. 33, 1423–1439. doi: 10.1029/2019GB006225
Powers L. C., Miller W. (2015). Photochemical production of CO and CO2 in the Northern Gulf of Mexico: Estimates and challenges for quantifying the impact of photochemistry on carbon cycles. Mar. Chem. 171, 21–35. doi: 10.1016/j.marchem.2015.02.004
Qi L., Xie H., Gagne J. P., Chaillou G., Massicotte P., Yang G. P. (2018). Photoreactivities of two distinct dissolved organic matter pools in groundwater of a subarctic island. Mar. Chem. 202, 97–120. doi: 10.1016/j.marchem.2018.03.003
Reader H. E., Miller W. L. (2012). Variability of carbon monoxide and carbon dioxide apparent quantum yield spectra in three coastal estuaries of the South Atlantic Bight. Biogeosciences 9, 4279–4294. doi: 10.5194/bg-9-4279-2012
Rushdi M. I., Abdel-Rahman I. A. M., Saber H., Attia E. Z., Abdelraheem W. M., Madkour H. A., et al. (2020). Pharmacological and natural products diversity of the brown algae genus Sargassum. RSC Adv. 10, 24951–24972. doi: 10.1039/D0RA03576A
Ryan W. B. F., Carbotte S. M., Coplan J., O’Hara S., Melkonian A., Arko R., et al. (2009). Global multi-resolution topography synthesis. Geochem. Geophys. Geosyst. 10, Q03014. doi: 10.1029/2008GC002332
Shank G. C., Lee R., Vähätalo A., Zepp R. G., Bartels E. (2010a). Production of chromophoric dissolved organic matter from mangrove leaf litter and floating Sargassum colonies. Mar. Chem. 119, 172–181. doi: 10.1016/j.marchem.2010.02.002
Shank G. C., Zepp R. G., Vähätalo A., Lee R., Bartels E. (2010b). Photobleaching kinetics of chromophoric dissolved organic matter derived from mangrove leaf litter and floating Sargassum colonies. Mar. Chem. 119, 162–171. doi: 10.1016/j.marchem.2010.01.003
Smetacek V., Zingone A. (2013). Green and golden seaweed tides on the rise. Nature 504, 84–88. doi: 10.1038/nature12860
Song G., Xie H., Bélanger S., Leymarie E., Babin M. (2013). Spectrally resolved efficiencies of carbon monoxide (CO) photoproduction in the western Canadian Arctic: particles versus solutes. Biogeosciences 10, 3731–3748. doi: 10.5194/bg-10-3731-2013
Stern J. L., Hagerman A. E., Steinberg P. D., Winter F. C., Estes J. A. (1996). A new essay for quantifying brown algal phlorotannins and comparisons to previous methods. J. Chem. Ecol. 22, 1273–1293. doi: 10.1007/BF02266965
Stubbins A., Hubbard V., Uher G., Law C., Upstill-Goddard R. C., Aiken G. R., et al. (2008). Relating carbon monoxide photoproduction to dissolved organic matter functionality. Environ. Sci. Technol. 42, 3271–3276. doi: 10.1021/es703014q
Sun Y. X., Wang J. X., Song K. X., Feng Z. H., Zhang T. (2020). Research on photodegradation of chromophoric dissolved organic matter released by Ulva prolifera. J. Jiangsu Ocean Univ. 29, 27–32.
Wang M. Q., Hu C. M., Barnes B. B., Mitchum G., Lapointe B., Montoya J. P. (2019). The great Atlantic Sargassum belt. Science 365, 83–87. doi: 10.1126/science.aaw7912
Wang M. Q., Hu C. M., Cannizzaro J., English D., Han X. X., Naar D., et al. (2018). Remote sensing of Sargassum biomass, nutrients, and pigments. Geophys. Res. Lett. 45, 12359–12367. doi: 10.1029/2018GL078858
Wang L. X., Li X. Z., Tang X. Y., Su R. G., Shi X. Y. (2020). Effects of the occurrence of green tide (Ulva prolifera blooms) on dissolved organic matters in the Southern Yellow Sea. China Environ. Sci. 40, 806–815.
Wang W. L., Yang G. P., Lu X. L. (2015). Carbon monoxide distribution and microbial consumption in the Southern Yellow Sea. Estuar. Coast. Shelf Sci. 163, 125–133. doi: 10.1016/j.ecss.2015.06.012
Wang S. Y., Zhai W. D. (2021). Regional differences in seasonal variation of air-sea CO2 exchange in the Yellow Sea. Cont. Shelf Res. 218, 104393. doi: 10.1016/j.csr.2021.104393
Weishaar J. L., Aiken G. R., Bergamaschi B. A., Fram M. S., Fujii R., Mopper K. (2003). Evaluation of specific ultraviolet absorbance as an indicator of the chemical composition and reactivity of dissolved organic carbon. Environ. Sci. Technol. 37, 4702–4708. doi: 10.1021/es030360x
White E. M., Kieber D. J., Sherrard J., Miller W. L., Mopper K. (2010). Carbon dioxide and carbon monoxide photoproduction quantum yields in the Delaware Estuary. Mar. Chem. 118, 11–21. doi: 10.1016/j.marchem.2009.10.001
Xie H. X., Bélanger S., Demers S., Vincent W. F., Papakyriakou T. N. (2009). Photobiogeochemical cycling of carbon monoxide in the southeastern Beaufort Sea in spring and autumn. Limnol. Oceanogr. 54, 234–249. doi: 10.4319/lo.2009.54.1.0234
Xie H. X., Li Y., Zhang Y., Geng L. (2019). CDOM photodegradation: Implications for the oceanic methane paradox (Austria: Geophysical Research Abstracts, 21, EGU2019–3396, EGU General Assembly).
Xie H. X., Zafiriou O., Cai W. J., Zepp R. G., Wang Y. C. (2004). Photooxidation and its effects on the carboxyl content of dissolved organic matter in two coastal rivers in the southeastern United States. Environ. Sci. Technol. 38, 4113–4119. doi: 10.1021/es035407t
Xing Q. G., Wu L. L., Tian L. Q., Cui T. W., Li L., Kong F. Z., et al. (2018). Remote sensing of early-stage green tide in the Yellow Sea for floating macroalgae. Mar. pollut. Bull. 133, 150–156. doi: 10.1016/j.marpolbul.2018.05.035
Xiong T. Q., Li H. M., Yue Y. F., Hu Y. B., Zhai W. D., Xue L., et al. (2023). Legacy effects of late macroalgal blooms on dissolved inorganic carbon pool through alkalinity enhancement in coastal ocean. Environ. Sci. Technol. 57, 2186–2196. doi: 10.1021/acs.est.2c09261
Yang G. P., Ren C. Y., Lu X. L., Liu C. Y., Ding H. B. (2011). Distribution, flux, and photoproduction of carbon monoxide in the East China Sea and Yellow Sea in spring. J. Geophys. Res. 116, C02001. doi: 10.1029/2010JC006300
Yang L., Zhang J., Yang G. P. (2021). Mixing behavior, biological and photolytic degradation of dissolved organic matter in the East China Sea and the Yellow Sea. Sci. Total Environ. 762, 143164. doi: 10.1016/j.scitotenv.2020.143164
Zafiriou O. C., Xie H. X., Nelson N. B., Najjar R. G., Wang W. (2008). Diel carbon monoxide cycling in the upper Sargasso Sea near Bermuda at the onset of spring and in midsummer. Limnol. Oceanogr. 53, 835–850. doi: 10.4319/lo.2008.53.2.0835
Zhang Y., Chen B., Zhai W. D. (2020). Exploring sources and biogeochemical dynamics of dissolved methane in the central Bohai Sea in summer. Front. Mar. Sci. 7. doi: 10.3389/fmars.2020.00079
Zhang Y., Gao X. L., Guo W. D., Zhao J. M., Li Y. F. (2018). Origin and dynamics of dissolved organic matter in a mariculture area suffering from summertime hypoxia and acidification. Front. Mar. Sci. 5. doi: 10.3389/fmars.2018.00325
Zhang Y. Y., He P. M., Li H. M., Li G., Liu J. H., Jiao F. L., et al. (2019b). Ulva prolifera green-tide outbreaks and their environmental impact in the Yellow Sea. China. Natl. Sci. Rev. 6, 825–838. doi: 10.1093/nsr/nwz026
Zhang Y., Liu M. M., Fu X. T., Sun J., Xie H. X. (2022). Chromophoric dissolved organic matter (CDOM) release by Dictyocha fibula in the central Bohai Sea. Mar. Chem. 241, 104017. doi: 10.1016/j.marchem.2022.104107
Zhang J. H., Shi J. T., Gao S., Huo Y. Z., Cui J. J., Shen H., et al. (2019a). Annual patterns of macroalgal blooms in the Yellow Sea during 2007–2017. PloS One 14, e0210460. doi: 10.1371/journal.pone.0210460
Zhang Y., Tan D. D., He Z., Yu J., Yang G. P. (2023). Dimethylated sulfur, methane and aerobic methane production in the Yellow Sea and Bohai Sea. J. Geophys. Res. Oceans 128, e2023JC019736. doi: 10.1029/2023JC019736
Zhang T., Wang X. C. (2017). Release and microbial degradation of dissolved organic matter (DOM) from the macroalgae Ulva prolifera. Mar. pollut. Bull. 125, 192–198. doi: 10.1016/j.marpolbul.2017.08.029
Zhang Y., Xie H. (2015). Photomineralization and photomethanification of dissolved organic matter in Saguenay River surface water. Biogeosciences 12, 6823–16836. doi: 10.5194/bg-12-6823-2015
Zhang Y., Xie H., Chen G. (2006). Factors affecting carbon monoxide photoproduction in the St. Lawrence estuarine system (Canada). Environ. Sci. Technol. 40, 7771–7777. doi: 10.1021/es0615268
Zhang G. L., Zhang J., Kang Y. B., Liu S. M. (2004). Distributions and fluxes of methane in the East China Sea and the Yellow Sea in spring. J. Geophys. Res. 109, C07011. doi: 10.1029/2004JC002268
Zhao B. Z., Yang G. P., Xie H. X., Lu X. L., Yang J. (2015). Distribution, flux and photoproduction of carbon monoxide in the Bohai and Yellow Seas. Mar. Chem. 168, 104–113. doi: 10.1016/j.marchem.2014.11.006
Zhong R. T., Wan X. Z., Wang D. Y., Zhao C., Liu D., Gao L. Y., et al. (2020). Polysaccharides from marine enteromorpha: structure and function. Trends Food Sci. Techn. 99, 11–20. doi: 10.1016/j.tifs.2020.02.030
Keywords: Ulva prolifera, Sargassum, CDOM, photobleaching, photomineralization
Citation: Zhang Y, Fang K, Liu M, Liu J, Zhao X, Zhai W, Zhang H, Wang X and Xie H (2024) High photoreactivity of chromophoric dissolved organic matter derived from Ulva prolifera and Sargassum. Front. Mar. Sci. 11:1397705. doi: 10.3389/fmars.2024.1397705
Received: 08 March 2024; Accepted: 24 April 2024;
Published: 10 May 2024.
Edited by:
Liyang Yang, Fuzhou University, ChinaReviewed by:
Bin Yang, Jiangsu Ocean Universiity, ChinaJeonghyun Kim, Jeju National University, Republic of Korea
Copyright © 2024 Zhang, Fang, Liu, Liu, Zhao, Zhai, Zhang, Wang and Xie. This is an open-access article distributed under the terms of the Creative Commons Attribution License (CC BY). The use, distribution or reproduction in other forums is permitted, provided the original author(s) and the copyright owner(s) are credited and that the original publication in this journal is cited, in accordance with accepted academic practice. No use, distribution or reproduction is permitted which does not comply with these terms.
*Correspondence: Yong Zhang, yongzhang@sdu.edu.cn; Huixiang Xie, huixiang_xie@uqar.ca