A decade of change and stability for fin whale song in the North Atlantic
 Regina A. Guazzo
 Dorene L. Stevenson
 Michael K. Edell
 George J. Gagnon2
  Tyler A. Helble
- 1Naval Information Warfare Center Pacific, San Diego, CA, United States
- 2Environmental Programs, Marine Acoustics, Inc., Arlington, VA, United States
Fin whale song is a ubiquitous low-frequency pulsing that has been recorded in every ocean basin. In recent years, the complexity of fin whale song has been realized. In the North Atlantic, this song is made up of two low-frequency note types (A and B notes) and one higher-frequency note type (upsweeps). The A and B notes are produced with both singlet and doublet inter-note intervals. These song patterns are interwoven throughout an individual’s song and have been observed to shift over time, both gradually and suddenly. Like many baleen whales, the population size of fin whales is poorly defined. Passive acoustic monitoring has been suggested as a way to estimate abundance if a cue rate or calling rate can be determined. In this study, we used recordings from 119 fin whale tracks from 2013–2023 generated from passive acoustic recorders in the North Atlantic to define fin whale song patterns in this ocean basin, identify changes in these song patterns over time, and calculate cue rates. The fin whales recorded sang in 4 distinct patterns. Inter-note intervals were 25 s for A-A singlets, 13 s for B-B singlets, 12/20 s for B-B doublets, and 10/11 s for A-B doublets. B-B doublet inter-note intervals significantly increased from May 2019–April 2023 and A-B inter-note intervals showed an intra-annual increasing trend that reset each summer. Fin whale song in the North Atlantic also often includes higher frequency upsweep notes immediately prior to B notes. While A and B note peak frequency was steady over these years, upsweep peak frequency significantly decreased, continuing a similar trend that has been observed over 30 years. Despite these changes, the dominant song pattern remained consistent and cue rate for actively singing whales was relatively stable, which is in contrast to patterns observed in the North Pacific. Many of these nuances in fin whale singing behavior are newly described herein, and these findings are vital for monitoring baseline behavior, behavioral trends over time, and ultimately estimating abundance of a poorly understood species.
1 Introduction
Fin whales (Balaenoptera physalus) sing an intense, low-frequency song that has been recorded in every ocean basin and is thought to be produced by males and associated with mating (e.g., Watkins, 1981; Watkins et al., 1987; Croll et al., 2002). In the North Atlantic, this song is composed of two low-frequency note types and one higher frequency note type with regular spacings, or inter-note-intervals (INIs), between them (e.g., Helble et al., 2020). The low-frequency note types are the B note, which is more broadband and has a higher peak frequency (sometimes referred to as the classic note or 20 Hz note), and the A note, which is less broadband and has a lower peak frequency (sometimes referred to as the backbeat) (Helble et al., 2020). While backbeat and classic may be the more common ways to identify A and B notes, respectively, we have chosen this nomenclature for reasons discussed further by Helble et al. (2020) in Section 2.1. Both of these note types are short downsweeps (approximately 1 s in duration or less) with median peak frequencies measured in the central North Pacific of 16 Hz for A notes and 23 Hz for B notes with 3 dB bandwidths of 6 Hz and 13 Hz, respectively (Helble et al., 2020). In the North Atlantic, A notes have been reported to have mean frequencies of 18 Hz with 10 dB bandwidths of 7.7 Hz and B notes have been reported to have peak and mean frequencies of 22 Hz with a 10 dB bandwidth of 6.5–14.5 Hz (Simon et al., 2010; Castellote et al., 2012; Garcia et al., 2018). A third note type has also been reported in the North Atlantic, often referred to as the upsweep. The upsweep is a higher frequency (approximately 132–140 Hz), short note type, usually immediately preceding B notes, but it has also been reported as the sole note type in some song recordings (Hatch and Clark, 2004; Simon et al., 2010; Castellote et al., 2012; Garcia et al., 2018). Fin whale population size, structure, distribution, and connectedness are not well understood, but passive acoustic monitoring is a tool that could be applied to improve management decisions for this species.
Both the note type pairing (A-A, B-B, or A-B) and its corresponding INI are needed to define each fin whale song pattern (Helble et al., 2020). Fin whale INIs have been reported as occurring in singlet patterns (constant INI), doublet patterns (two alternating INIs), and triplet patterns (a pattern of three INIs, at least two of which are unique) (Watkins, 1981; Watkins et al., 1987; Thompson et al., 1992; Delarue et al., 2013; Širović et al., 2017). Doublets and triplets can occur with one or both note types, while singlets have only been observed with single note types.
While song patterns might differ between populations, song pattern alone is not enough to identify a population since individual fin whales have been observed interweaving patterns and suddenly switching song patterns in a single song bout (Helble et al., 2020). Although so far this interweaving of song patterns has only been reported in Hawaiian waters, it likely occurs more ubiquitously but is under-reported because of recording methods that do not allow individuals to be tracked (for further discussion, see Helble et al., 2020) and analysis methods that ignore note types or average INIs without regard for note types. Song patterns in a region can change gradually or suddenly. Often INIs increase over time, sometimes gradually increasing over many years (Širović et al., 2017; Weirathmueller et al., 2017; Helble et al., 2020; Best et al., 2022) and other times rapidly increasing and then resetting at a lower value at the start of each new singing season (Watkins et al., 1987; Hatch and Clark, 2004; Morano et al., 2012; Oleson et al., 2014; Širović et al., 2017). Dominant song patterns can also be suddenly replaced by new song patterns (Širović et al., 2017; Helble et al., 2020).
INIs are relatively short for fin whales (usually less than 40 s), but longer gaps between notes also occur in a fin whale’s song. These gaps average 115–150 s in duration and occur every 10–15 min (Watkins et al., 1987; McDonald et al., 1995; Nieukirk et al., 2004; Helble et al., 2020). These pauses may be surfacing events when fin whales are breathing and some even longer gaps may be related to whales joining each other or being disturbed (Watkins et al., 1987). Often the song segment in between gaps is referred to as a song bout and the notes immediately before and after these gaps may have lower received levels (Watkins et al., 1987; Helble et al., 2020).
Many different song patterns have been reported in the North Atlantic over the past 25 years (Table 1). Some song patterns are difficult to compare due to differences in methodology for measuring INI. For example, some previous research has only reported INIs between B notes, thereby ignoring any A notes that may have occurred in between or vice versa (e.g., Hatch and Clark, 2004; Castellote et al., 2012). Other times it is unclear whether A notes were present, but ignored, or were not present in the dataset (e.g., Delarue et al., 2009). Finally, many of these studies had very short durations with small sample sizes and so may not be truly representative of a time or region (e.g., Clark et al., 2002; Nieukirk et al., 2004; Simon et al., 2010; Garcia et al., 2018; Papale et al., 2023). A-A doublet song patterns have not been reported in the North Atlantic.
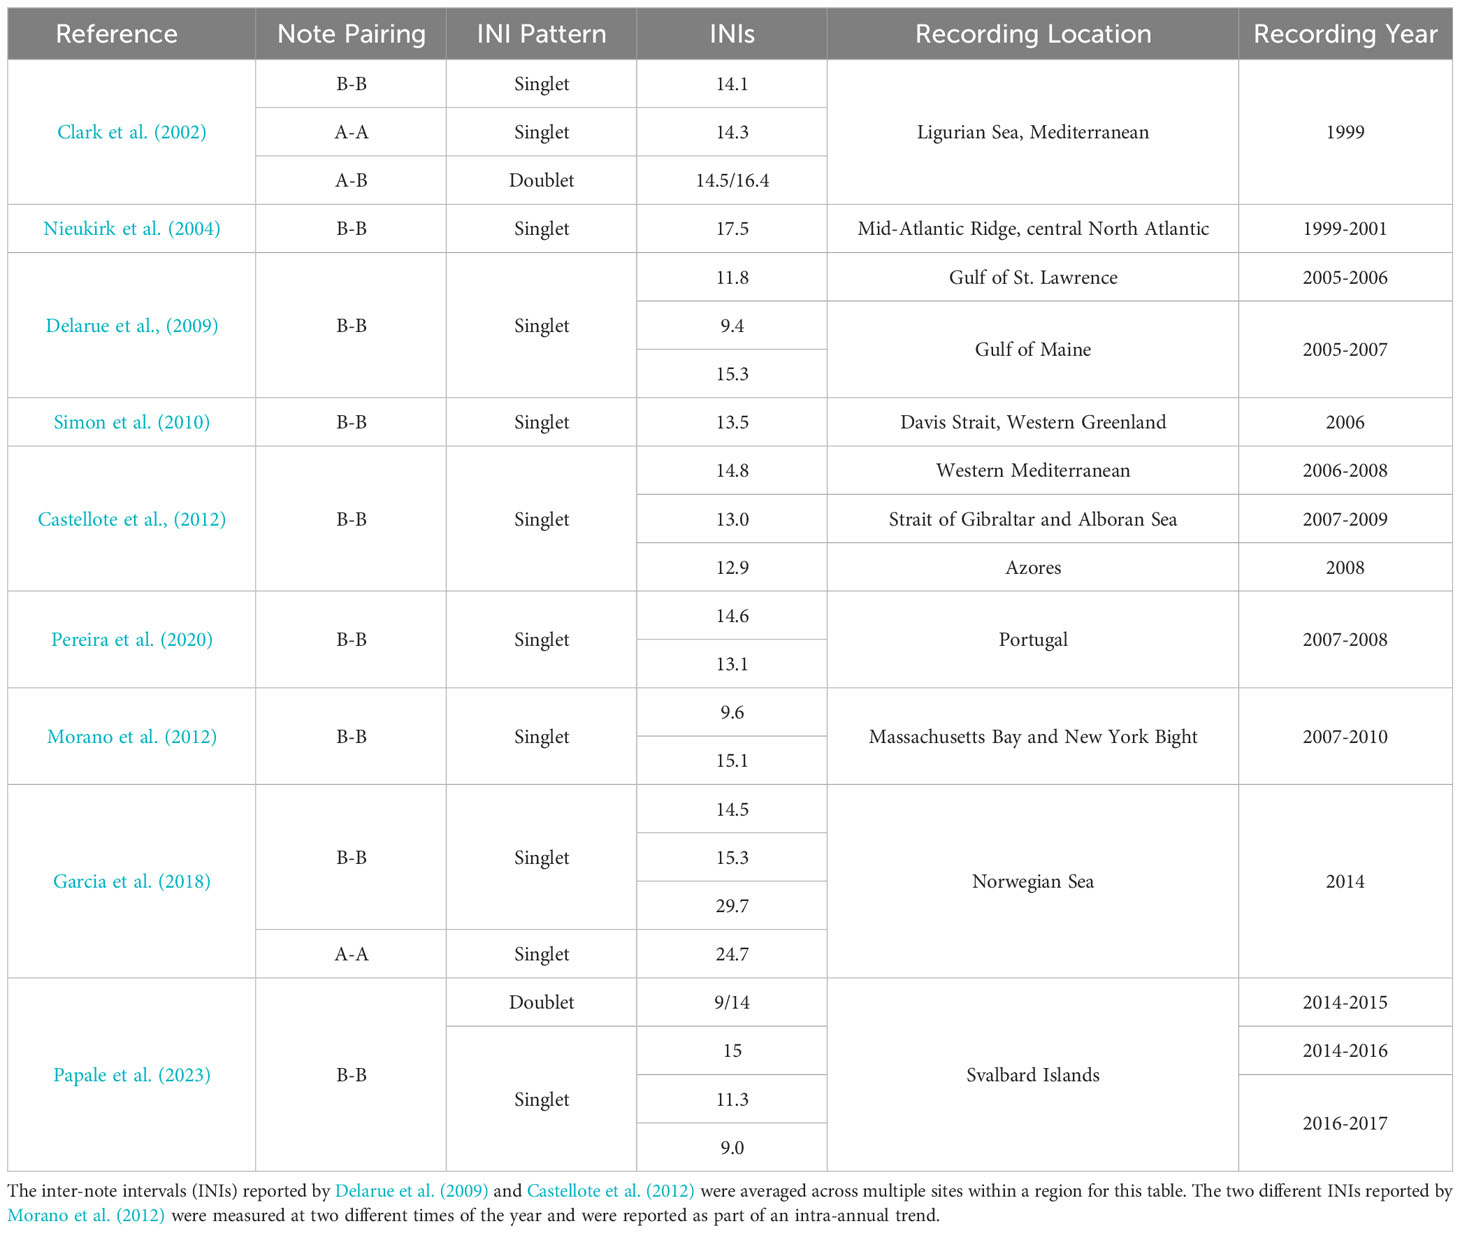
Table 1 Fin whale song patterns reported in the North Atlantic since 1999.
Recent effort has been devoted to improving cue rate estimates and understanding factors that affect cue rates (vocalizations rates) in order to estimate the number of marine mammals in an area using passive acoustic monitoring (e.g., Marques et al., 2009, Marques et al., 2012). Passive acoustic monitoring is appealing for abundance estimation because it is less limited to locations and times that are easily accessible by research vessels since hydrophones can be deployed on surface and subsurface autonomous assets to collect data for extended periods of time. If a cue rate is known for a given species or population, the density or total abundance in that area can be calculated (Harris et al., 2018). However, singing fin whale vocalization rate can be impacted by song pattern and swimming speed and so may shift over time or with behavioral state (Clark et al., 2019; Helble et al., 2020; Guazzo et al., 2021). Collecting more data in a variety of conditions and behavioral states would allow fin whale cue rate and the factors that affect it to be better understood.
Previously, Helble et al. (2020) analyzed fin whale song patterns near Kaua’i, Hawai’i over 6.5 years. They found that fin whale song patterns were much more complex than previously reported in that individual fin whales utilized multiple patterns in single song bouts and that the dominant song pattern changed over time (Helble et al., 2020). Motivated by Helble et al. (2020), we applied similar tools developed for the Kaua’i, Hawai’i dataset to a dataset of fin whale song recordings from the North Atlantic to better define fin whale song patterns in this ocean basin, identify changes in these song patterns over time, and calculate cue rates.
2 Methods
2.1 Study area and data description
Between October 2013 and April 2023, 119 recordings were made of fin whale song on U.S. Navy arrays in the North Atlantic (Figure 1). The validated recordings totaled 299 hours and contained 66,008 A and B notes in addition to upsweeps. These Navy arrays were used to manually track vocalizing fin whales, and then steered-beam recordings were made from a selection of these tracks. Because these arrays contain multiple hydrophones which allow for bearing to the source and acoustic gain, we were able to unambiguously detect, track, and subsequently record individual fin whales for hours at a time. Not every whale that was singing was tracked and not every tracked whale was recorded because tracking was manual and the recording process was a separate step for the analysts. Generally, fin whale tracks were recorded that were within close range of an array and had high received levels. Therefore, times without data should not be interpreted as times without fin whale song. Due to limited access of U.S. Navy asset information, more details about hydrophone locations and capabilities or tracking methods and accuracy are not available to provide. Segments of spectrograms from three of these recordings are shown in Figure 2.
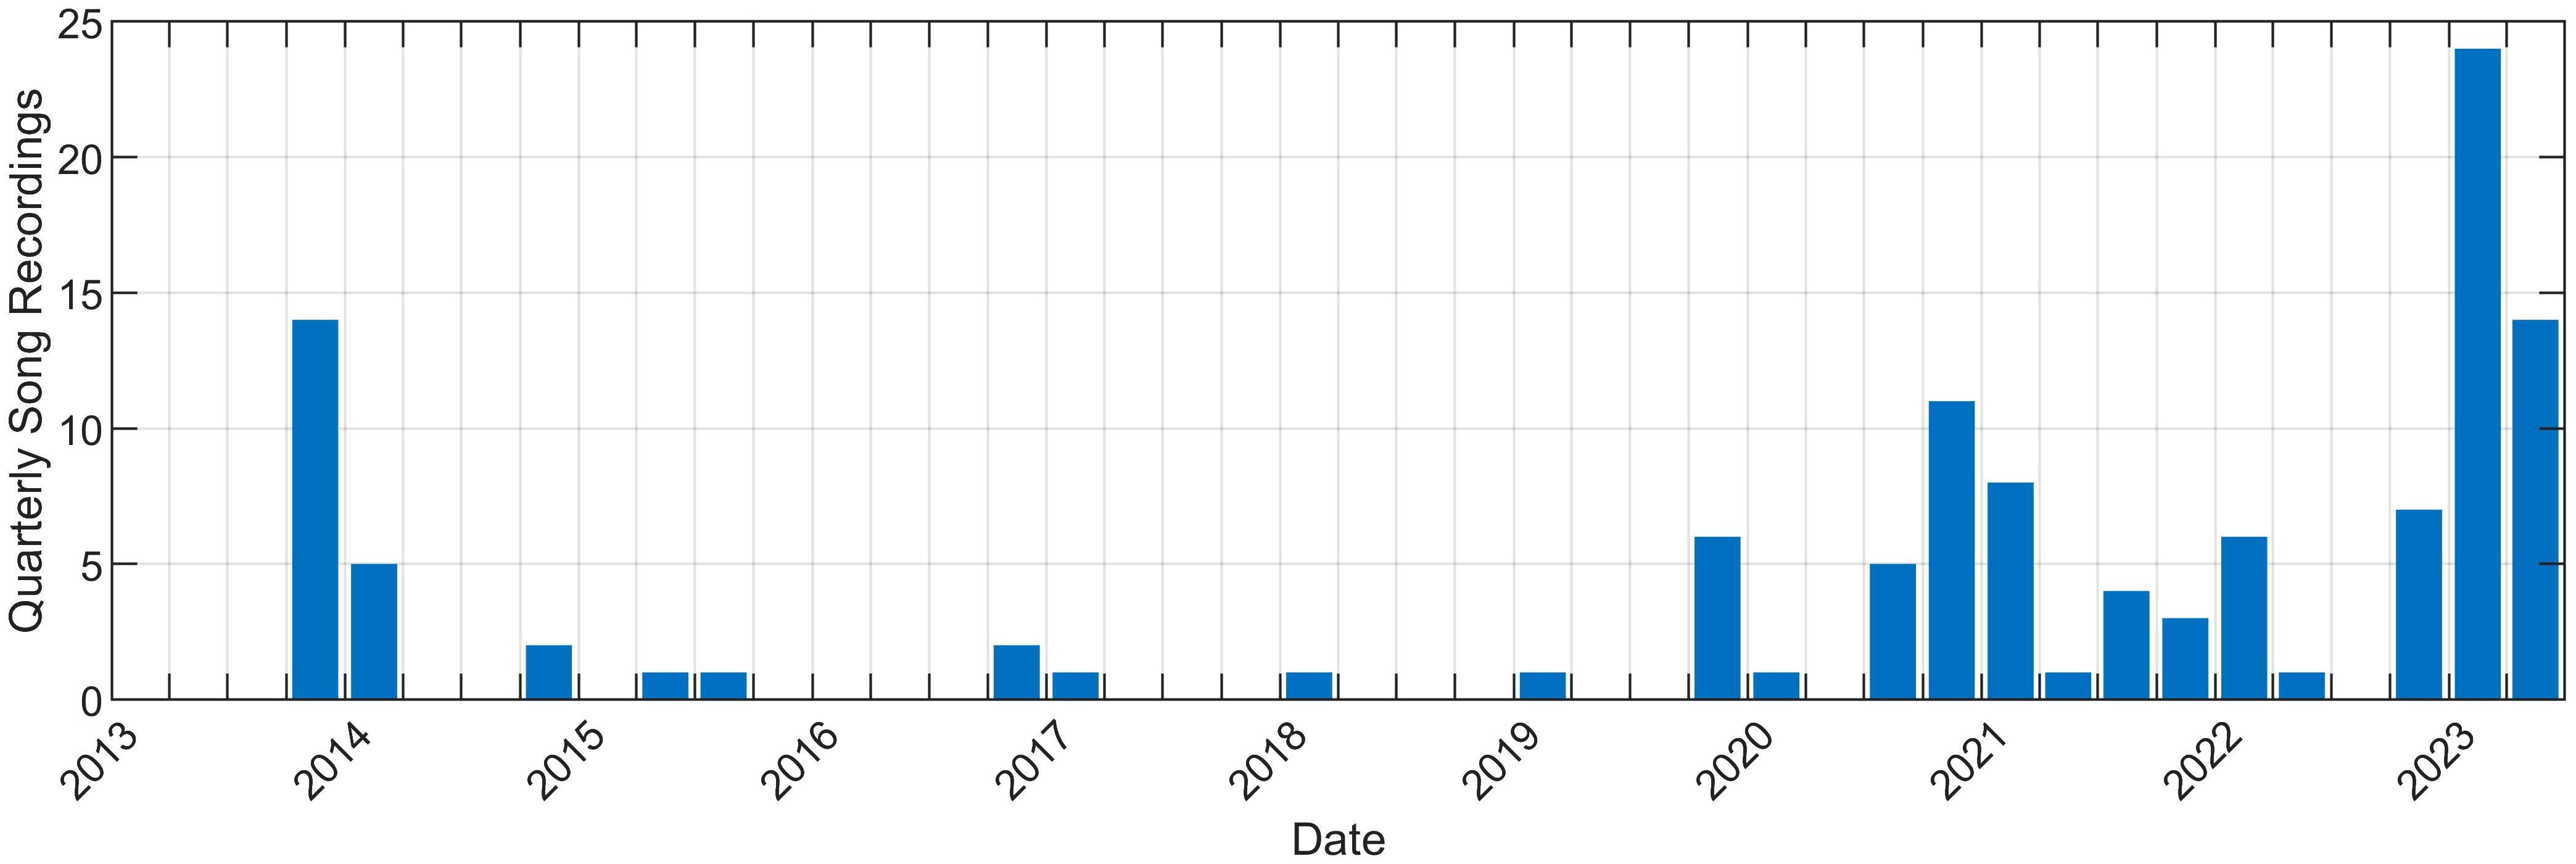
Figure 1 Number of fin whale song recordings during each quarter. The first recording was in October 2013 and the last recording was in April 2023. Note that since these processes were manual, times without data should not interpreted as times without fin whale song.
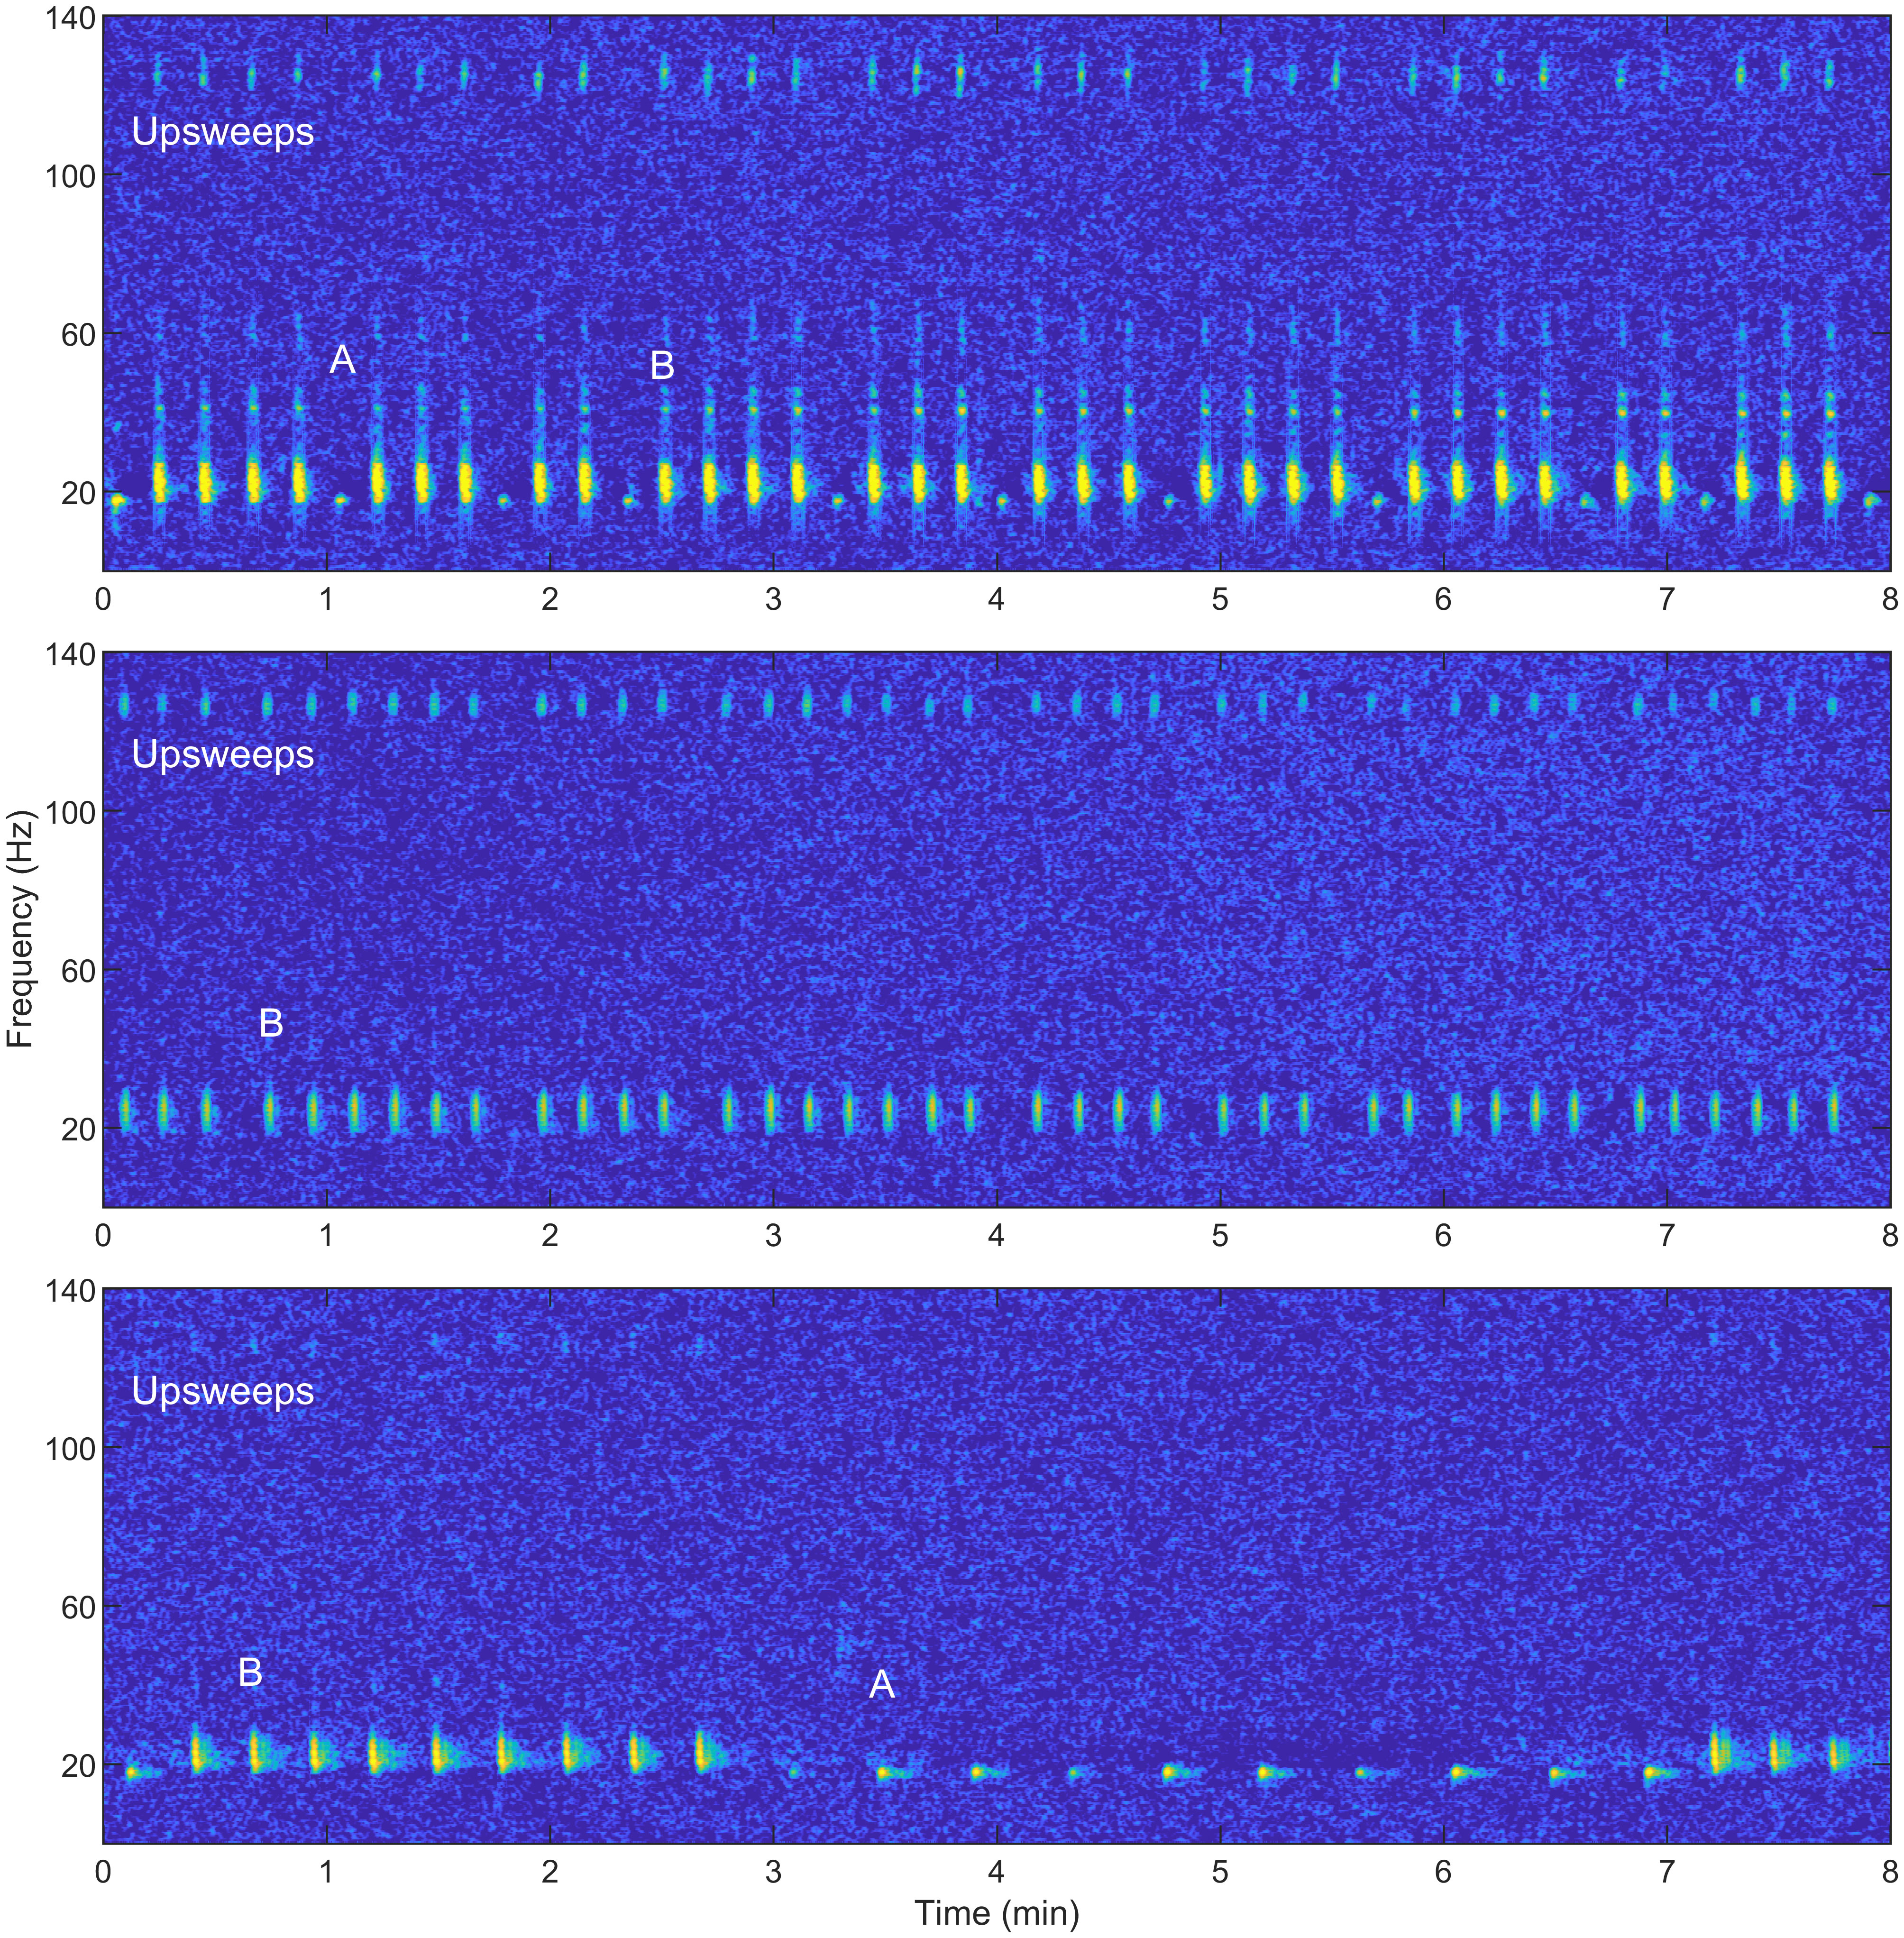
Figure 2 Segments from three example fin whale songs showing a variety of song patterns. Example note types are labeled in each spectrogram. The top spectrogram includes A notes followed by multiple B notes. Each B note has a higher frequency upsweep immediately prior to it. The middle spectrogram contains all B notes with upsweeps immediately prior to them. The B notes are arranged in a pattern with a longer inter-note interval (INI) followed by several short INIs. The bottom track contains groupings of B notes with similar INIs and groupings of A notes with different INIs. The B notes have very weak upsweeps prior to them. These recordings were resampled to 400 Hz. A 1024-point fast Fourier transform (FFT) with a Hamming window and 90% overlap were used to create the spectrograms.
2.2 Detection of fin whale notes
Notes and any other transient signals with frequency content between 10–60 Hz and a length of 0.2–4 s were detected using the generalized power-law (GPL) detector (Helble et al., 2012) on the downsampled recordings (resampled to 400 Hz). This detector was described in detail by Helble et al. (2012) and so only the specific parameters for this analysis are given here. The GPL detector identified the start and end time of each signal that met the threshold and created a template of that signal which was later used to classify note types (see Section 2.3). To make each template, the detector used a 300-point fast Fourier transform (FFT) and a Hamming window with 75% overlap and subtracted the background noise in each frequency band from the detection, leaving the spectral content of the signal. The resolution of the resulting spectral bins had a duration of 0.19 s and spectral width of 1.33 Hz.
The GPL detector was also used to separately detect all upsweeps that were part of a song. The same parameters were used for these upsweeps as those used for A and B notes except that the frequency band searched was 110–140 Hz.
2.3 Fin whale song analysis
First, the spectrograms of all recordings were viewed in Raven Pro (Bioacoustics Research Program, 2017) to sort the recordings into fin song and non-song categories. To be defined as fin song, the tracks had to consist primarily of downswept A and/or B notes, possibly with corresponding upsweeps. Next, the song recordings were processed through GPL using the detection parameters described above. In a similar way as Helble et al. (2020), an automated classifier categorized each low-frequency detection as either an A or B note depending on how much energy was in the different frequency bins, however the parameters used here were different than in Helble et al. (2020). Specifically, the GPL template of the note was summed separately over the length of the note for the 10–23 Hz band, and the 10–60 Hz band. If the ratio of energy in the lower band to the full detection band exceeded 55% of the total, then the note was categorized as an A note, otherwise the note was categorized as B. There was little ambiguity between the two note types and this empirically-determined classifier agreed well with manual annotations (only 4.6% of the notes were reclassified by the analyst during the track review process).
The note detections and classifications for each fin whale song recording were imported into Raven Pro as selection tables. An analyst visually validated the notes in the recording, which were marked with boxes in the spectrograms of the steered-beam acoustic data. We manually added notes that were visible on the spectrogram but were not detected, removed false detections, and corrected the note type of misclassified notes. The automated detection and classification process performed well and only missed 2.9% of notes, but multipath detections were the most common cause of false detections and had to be manually removed (false positives made up 32.6% of the automated detections). Although the number of multipath detections was high, they were easily distinguished from first arrivals making their manual removal straightforward.
The average length of the fin whale song recordings was approximately 2.5 hours, however, there were some recordings that were especially long and other recordings where the quality prohibited reliable detection of notes in much of the recording. If the recording was much longer than the average, we validated the clearest section and removed the automated detections outside of this segment. The median elapsed time between the first and last validated notes was 2.6 hours (min = 0.5, Q1 = 2.3, Q3 = 2.7, max = 6.8). In addition, seven whales had two different recordings of their song, either at the same time, but from separate arrays, or at different times along the track. To avoid biasing the results by counting the same song twice, we selected a single recording for each of these whales to carry forward through the analysis. In practice, the INI patterns were very similar for the two different recordings of single whales and so the choice of which recording to use did not affect the results.
We defined the INI for each note type pairing (A-A, A-B, B-A, B-B) as the difference between the time of arrival (TOA) of the first note and the TOA of the subsequent note as long as the value was less than 60 s. GPL automatically determines the TOA of each detection, with high levels of accuracy for measuring the arrival time of a variety of calls in various noise environments and signal-to-noise-ratios (SNRs) (Helble et al., 2012). Longer intervals were defined as a gap and were analyzed separately. The INIs of each pairing and the percentage of each pairing type were measured for each of the fin whale recordings.
INIs within fin whale songs often follow regular patterns. The peak INIs for each of the note pairing types within a track were determined in the same way as Helble et al. (2020) and so are only summarized here. We fit a 1- or 2-term Gaussian model to the distribution of INIs, binned in 1-second bins
where n is either 1 or 2 for a single-term or two-term model, a is the amplitude, b is the centroid location, and c controls the width of the peak. For A-B and B-A INIs, the single-term model was always selected for each since these patterns are inherently doublets, while for A-A and B-B INIs, the model with the least uncertainty (smallest 95% confidence interval widths) was selected. The variability of the INIs for each note type pairing in a recording was quantified by measuring the width of the INI peak at half of its height (for a visualization of these methods and the relevant Matlab code, see Figure 4 and the corresponding Supplementary Material of Helble et al., 2020). Peak INIs were only calculated for recordings that had at least 20 instances of that note type pairing. In this way, we applied an automatic and consistent way of determining if a song recording contained singlet (single peak) or doublet (two peak) singing patterns for each note type pairing. No triplet patterns were observed during the validation process and so note patterns were classified as either singlet or doublet.
To determine whether the observed INIs for each of the fin whale song patterns changed over time, the slopes of the peak INIs from each recording were calculated. These slopes were measured over the full dataset, over the more recent song seasons, and within song seasons. Slopes were significantly different from zero if their 95% confidence intervals did not include zero.
Cue rates were calculated for each recording by dividing the total number of unique A and B notes in the recording by the total elapsed time. This cue rate is the vocalization rate of an individual actively singing fin whale and is in units of notes/hour. This value is different from the total population cue rate which would include whales that were not singing and times when whales were not vocally active. While long breaks in song could sometimes still be part of a track (see, for example, Clark et al., 2019), in most cases, these recordings were made during periods when the whales were consistently vocalizing.
Regular intervals or gaps between notes that were greater than or equal to 60 s were present in each recording, and both the interval length and the time between each interval were measured. The notes between these gaps are defined as a song bout.
2.4 Frequency of notes
We calculated the received note peak frequency and 3 dB bandwidth for A, B, and upsweep notes within a song. To ensure accurate measurements, only notes with SNR greater than or equal to 5 dB were included. At these SNR values, peak frequency and 3 dB bandwidth were not correlated with SNR. SNR was defined as:
where RLdB is received level with background noise level removed through the GPL processor and NLdB is noise level (processing methods are described in more detail in Section IIC of Guazzo et al., 2020). FFT parameters were the same for these calculations as for the GPL detection parameters in Section 2.2. The peak frequency of each note is the frequency with the greatest amplitude in the note spectrum and the 3 dB bandwidth is the width of that peak measured 3 dB down from the peak amplitude (see Crane and Lashkari, 1996). These metrics were calculated for notes that exceeded the 5 dB SNR threshold in each recording. Then the means for each note type were taken and statistics were calculated across all recordings. Recordings were only included if they had at least 20 notes of that type that exceeded the SNR threshold.
3 Results
Between October 2013 and April 2023, 119 recordings were made of fin whale song in the North Atlantic. We validated 299 hours of recordings containing 66,008 A and B notes. These fin whales sang in four different patterns made up of A and B note pairings in both singlet and doublet INI patterns (Figures 2, 3). These song patterns will be called A-B doublet, A-A singlet, B-B singlet, and B-B doublet for the remainder of this paper (note that A-A doublet was not observed). This nomenclature is the same as used by Helble et al. (2020) and contains both the note type pairing (A-B, A-A, or B-B) and the INI pattern (singlet or doublet). Most fin whale song contained both A and B notes and higher frequency upsweeps immediately prior to B notes. However, 7 of the 118 recordings that included B notes did not contain upsweeps.
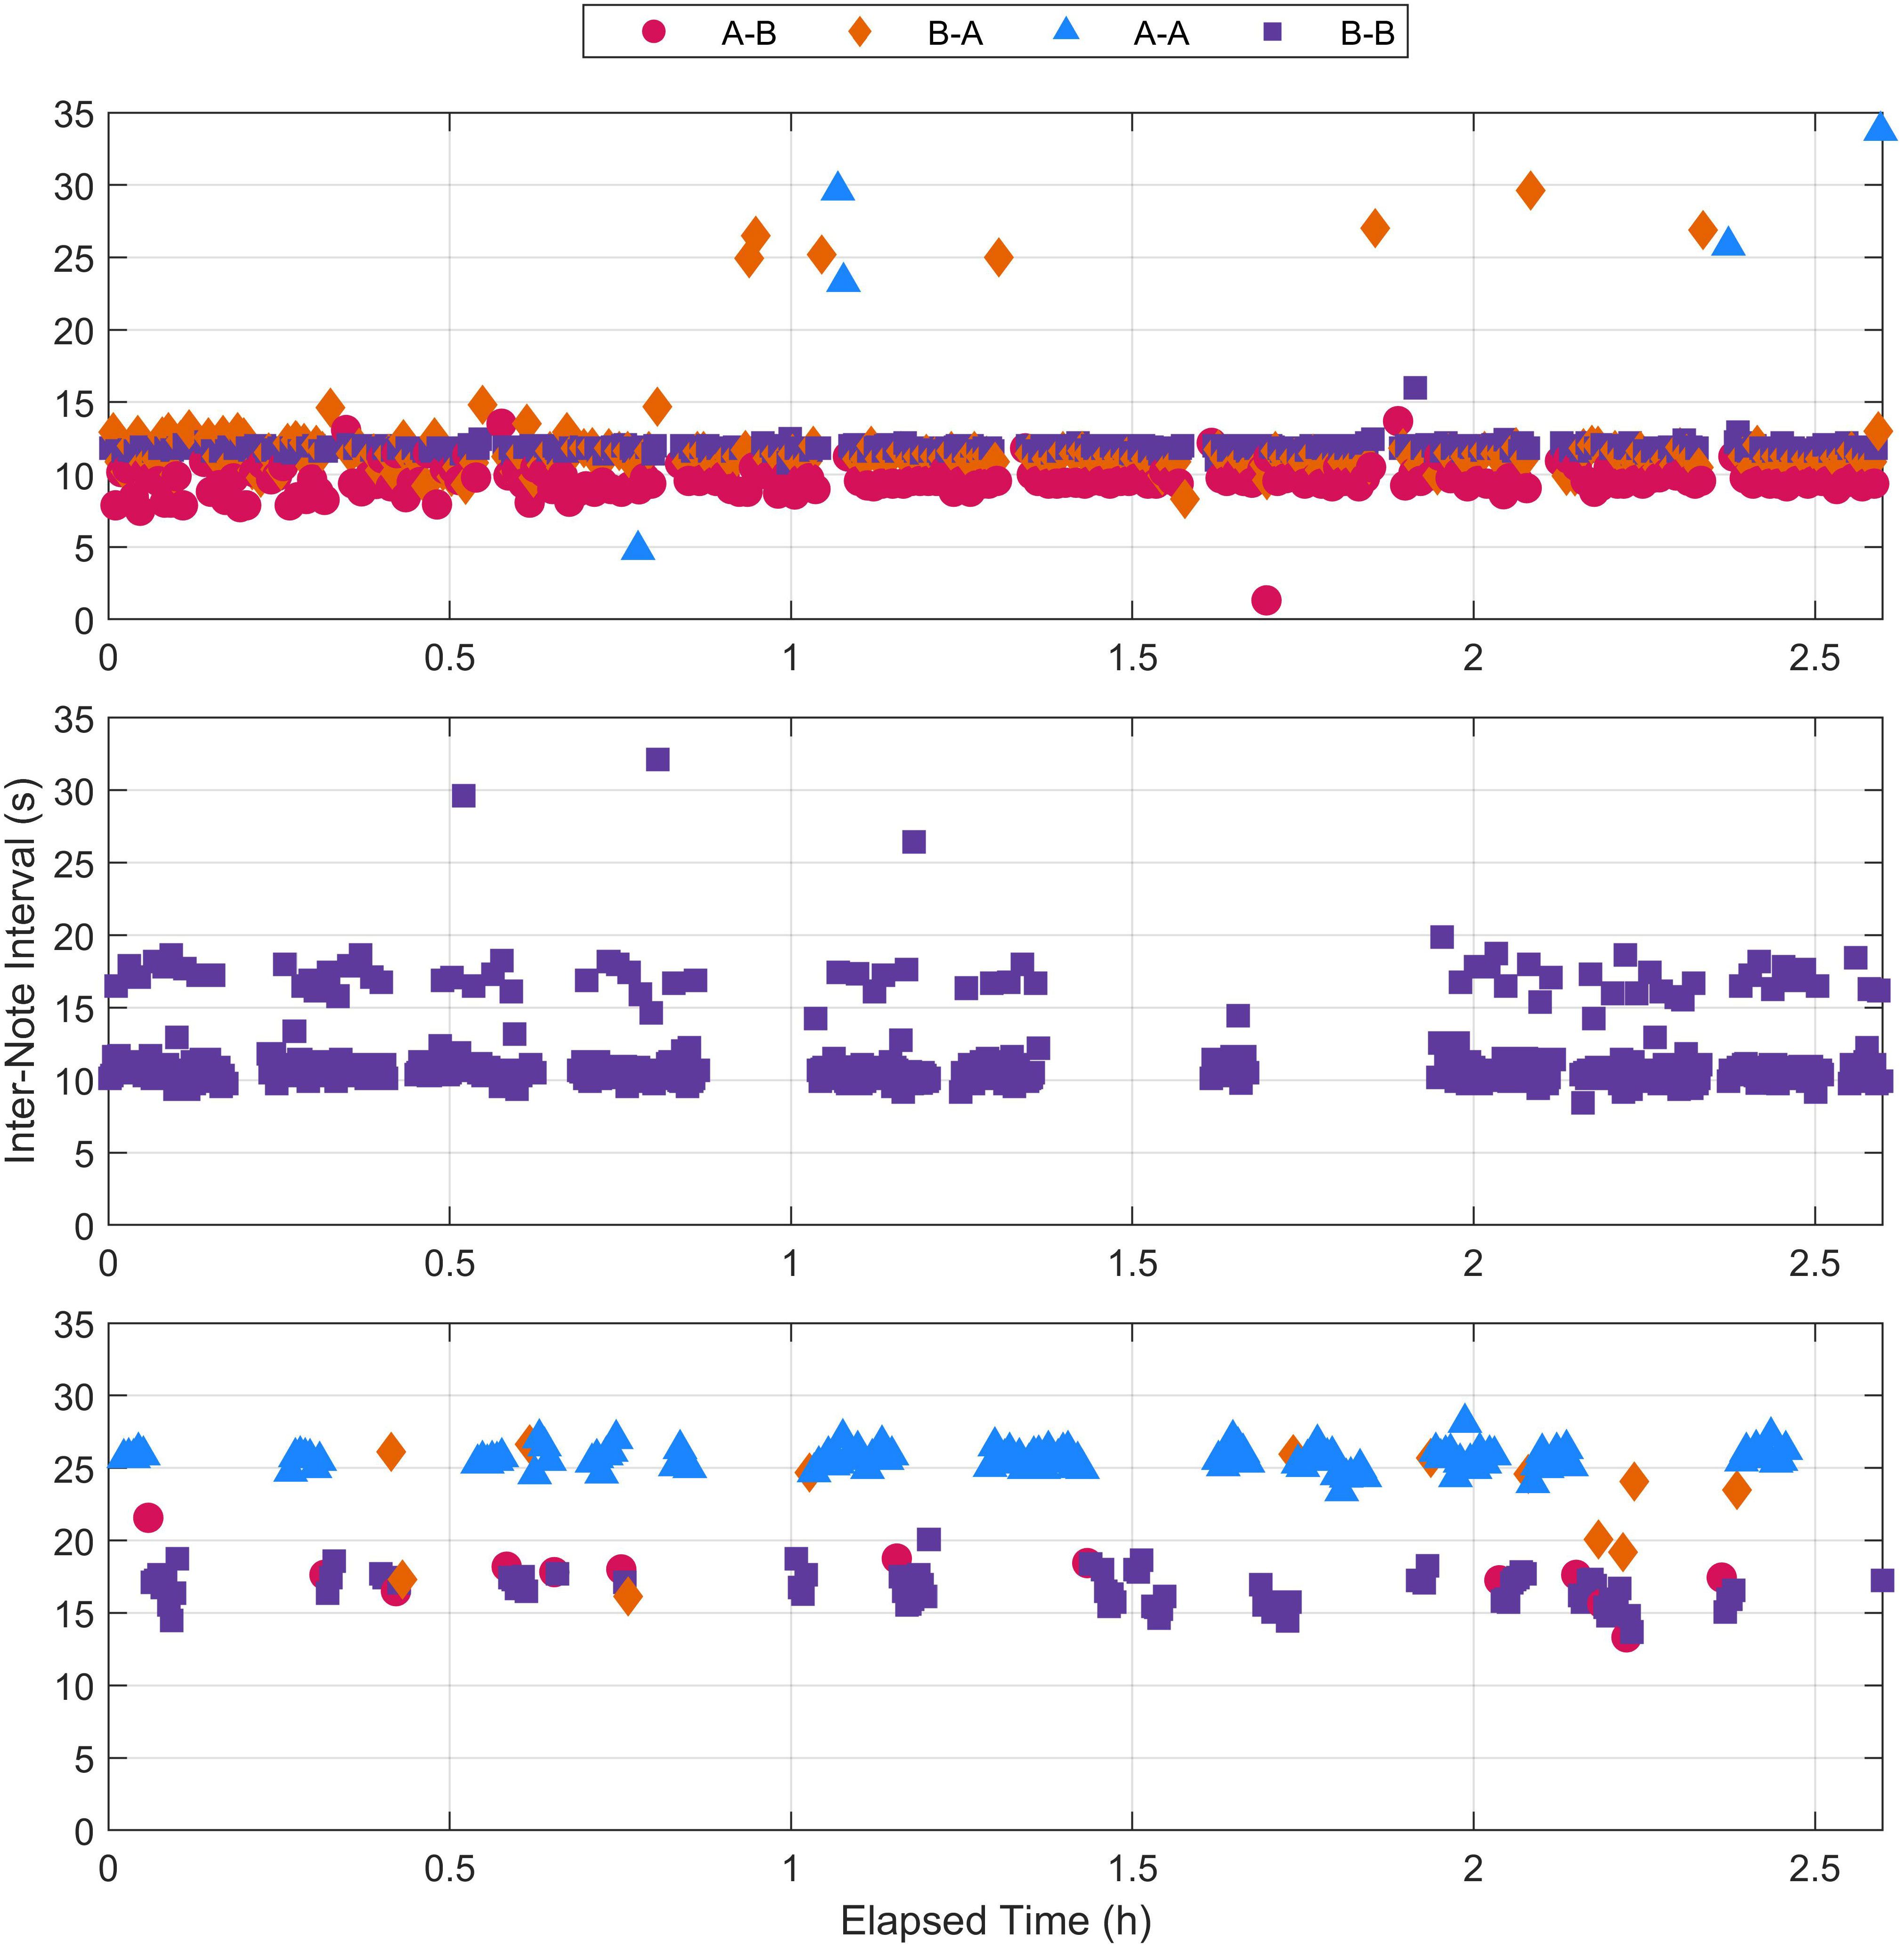
Figure 3 Inter-note interval (INI) measurements from the three example fin whale recordings shown in Figure 2. Note that while Figure 2 showed an 8 min segment of each recordings, the INIs for the full recordings are displayed here. Each note pairing type is indicated by color and shape. The recording for the top plot contained A-B doublet and B-B singlet song patterns, the recording for the middle plot contained a B-B doublet song pattern, and the recording for the bottom plot contained B-B singlet and A-A singlet song patterns.
3.1 Fin whale song analysis
For each validated song recording and note type pairing, fitted Gaussian distributions were used to determine the peak INIs and whether each note type pairing occurred in a singlet or doublet pattern (Figure 4). These INIs were also averaged across all recordings for each song pattern (Table 2). For singlet patterns, the median INIs were 25 s for A-A pairings and 13 s for B-B pairings. The median INIs for the A-B doublet pattern were 10 s for A-B pairings and 11 s for B-A pairings. The B-B doublet pattern had median INIs of 12 s for the shorter INI and 20 s for the longer INI.
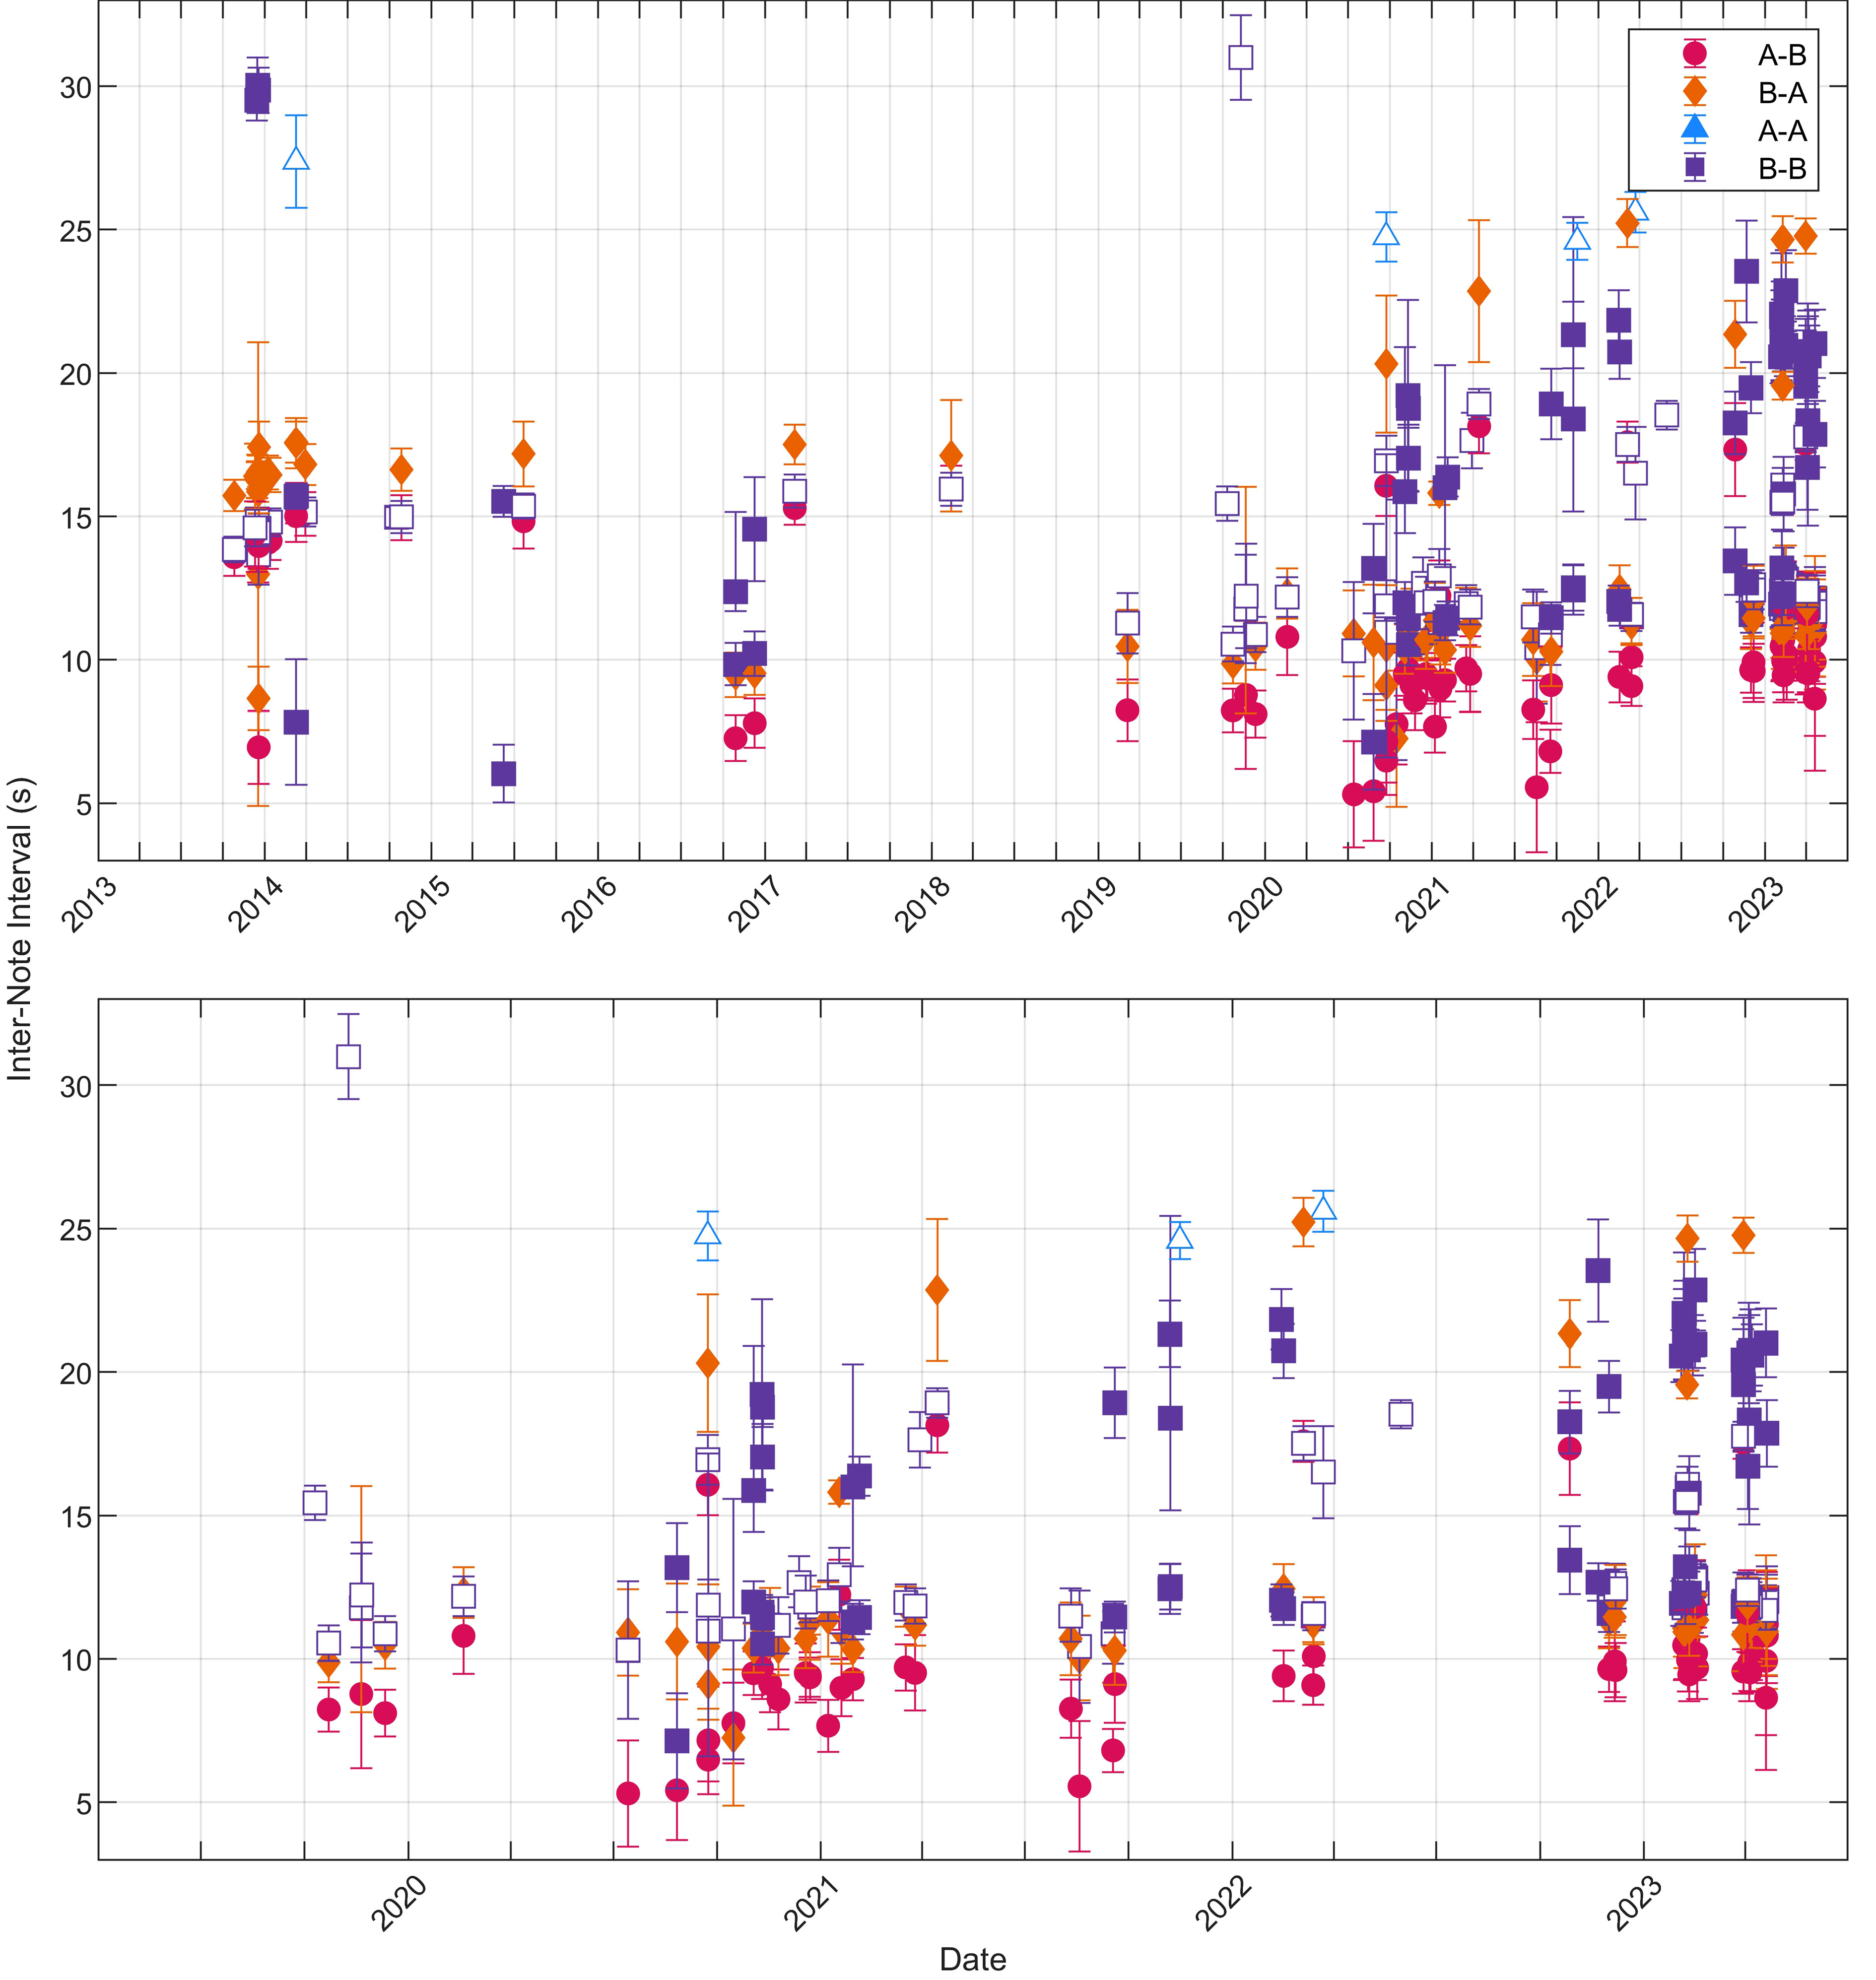
Figure 4 Peak inter-note interval (INI) values for each note pairing type in each recording plotted as a function of date (full date range top, April 2019–June 2023 bottom). Singlet (open markers) and doublet (filled markers) peaks are the maxima of the fitted Gaussian models with the width of each INI peak shown as error bars. Each marker indicates that there were at least 20 of that note pairing within the recording. Gaps between notes greater than 60 s were not included in these calculations.
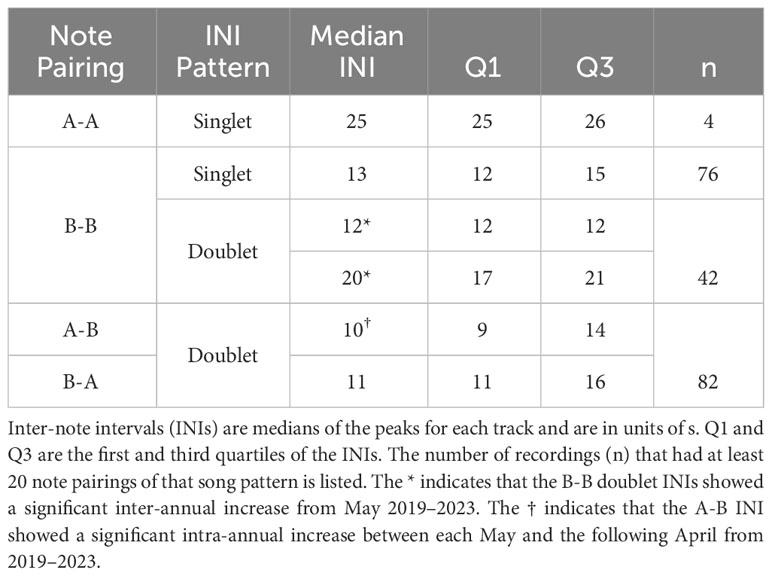
Table 2 Fin whale song patterns observed on U.S. Navy arrays in the North Atlantic between 2013–2023.
INIs can change both within a year and across many years. We did not measure potential trends before the 2019–2020 song season because the number of recordings were low and we did not want to over-interpret the data. However, from May 2019 until the end of the dataset (April 2023), the B-B doublet INIs significantly increased over time with slopes for the two INIs of 0.7 and 2.0 s/year (95% CI[0.2,1.2] and [0.3,3.6], respectively). The A-B doublet INIs also appeared to increase inter-annually, but upon closer inspection we realized that this apparent long-term trend was actually driven by uneven sampling of an intra-annual trend. Examining this intra-annual trend further, across a single year from 1 May 2020–30 April 2021 when there were the most examples of A-B doublet INIs, the A-B INIs increased significantly at 0.67 s/month (95% CI[0.12,1.22]). When the A-B INIs were combined across 2019–2023 and overlapped from May to the end of the following April regardless of year, the slope of the INIs was 0.48 s/month (95% CI[0.20,0.75]).
The percentages of note type pairings for each of the 119 fin whale recordings were calculated and are shown in Figure 5. Although the recording effort was lower in the 2014–2020 song seasons than in the other seasons, the percentage of B-B pairings in a song and the percentages of A-B/B-A pairings did not change significantly over these ten years (95% CI for slopes included zero). Of the 119 recordings, 83 included multiple song patterns (at least 20 pairs of each note pairing), which were interwoven throughout the track. Multiple song patterns were often produced in predictable patterns such as an A note followed by a variable number of singlet or doublet B-B pairings. We did not observe abrupt changes in song pattern within recordings for this North Atlantic dataset.
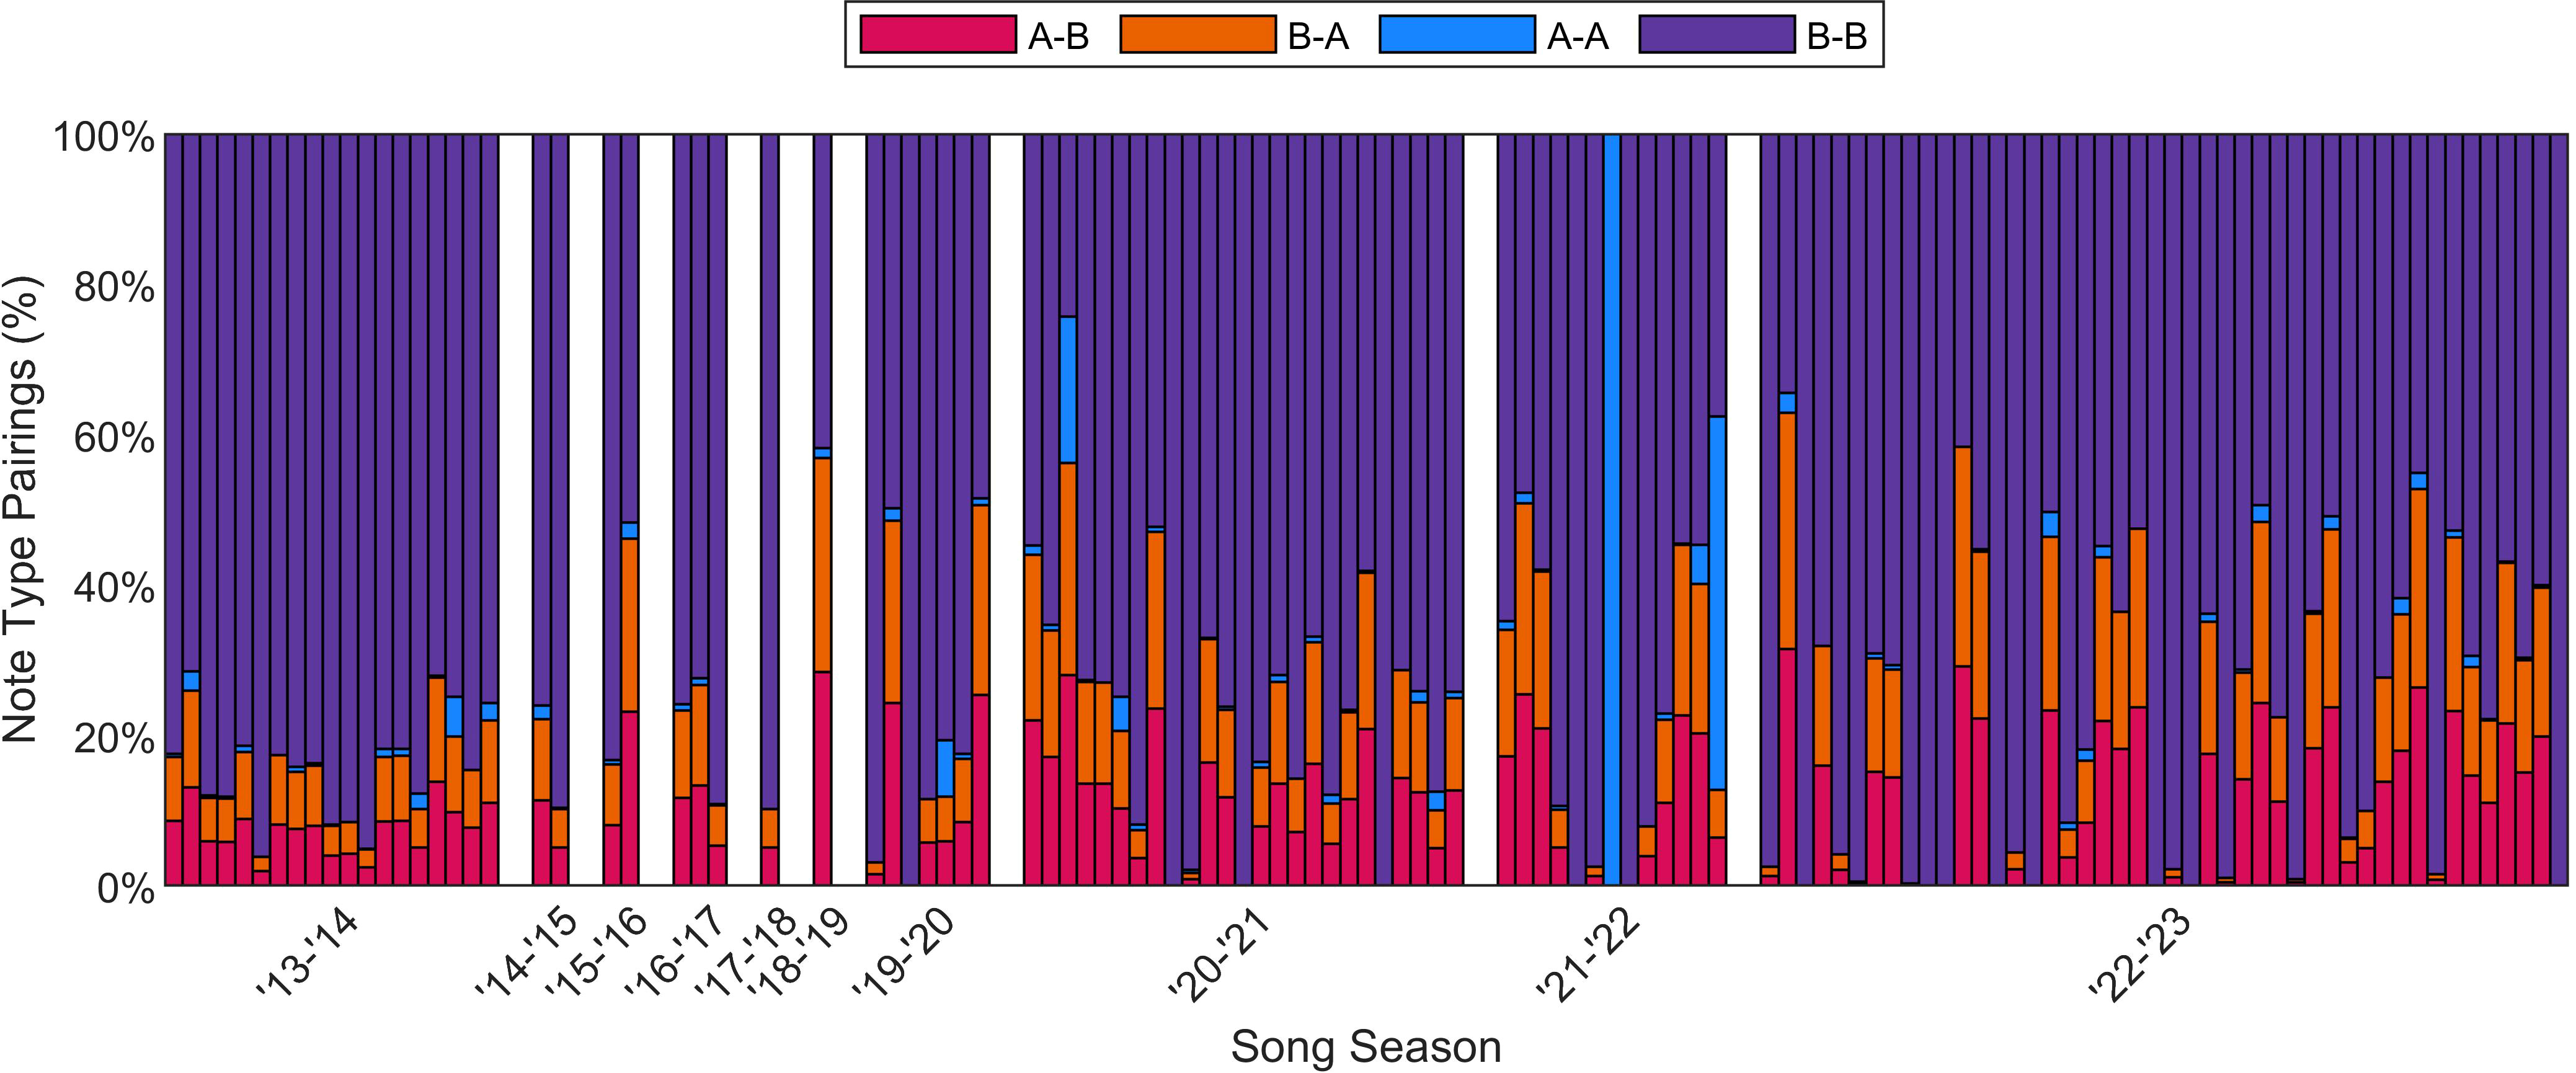
Figure 5 Percentage of different note pairings for each of the 119 fin whale recordings, spanning 2013– 2023. Each colored vertical bar represents one recording and all the recordings within a season are concatenated and grouped by season. White bars mark each of these song seasons divided at May 1 of each year, based on the observed break in fin whale song and recordings each year (see Figure 4). Doublet and singlet songs are not differentiated in this plot but B-B pairings were observed as both singlet and doublet INI patterns.
We calculated the along-track cue rate by summing the A and B notes and dividing by the total amount of elapsed time for each fin whale song recording (Figure 6). The median along-track cue rate for all 119 tracks was 222 notes/hour (Q1 = 193, Q3 = 251). While there was some variability from a minimum cue rate of 90 notes/hour to a maximum of 332 notes/hour, the fin whale cue rate showed no significant trend over this 10 year dataset.
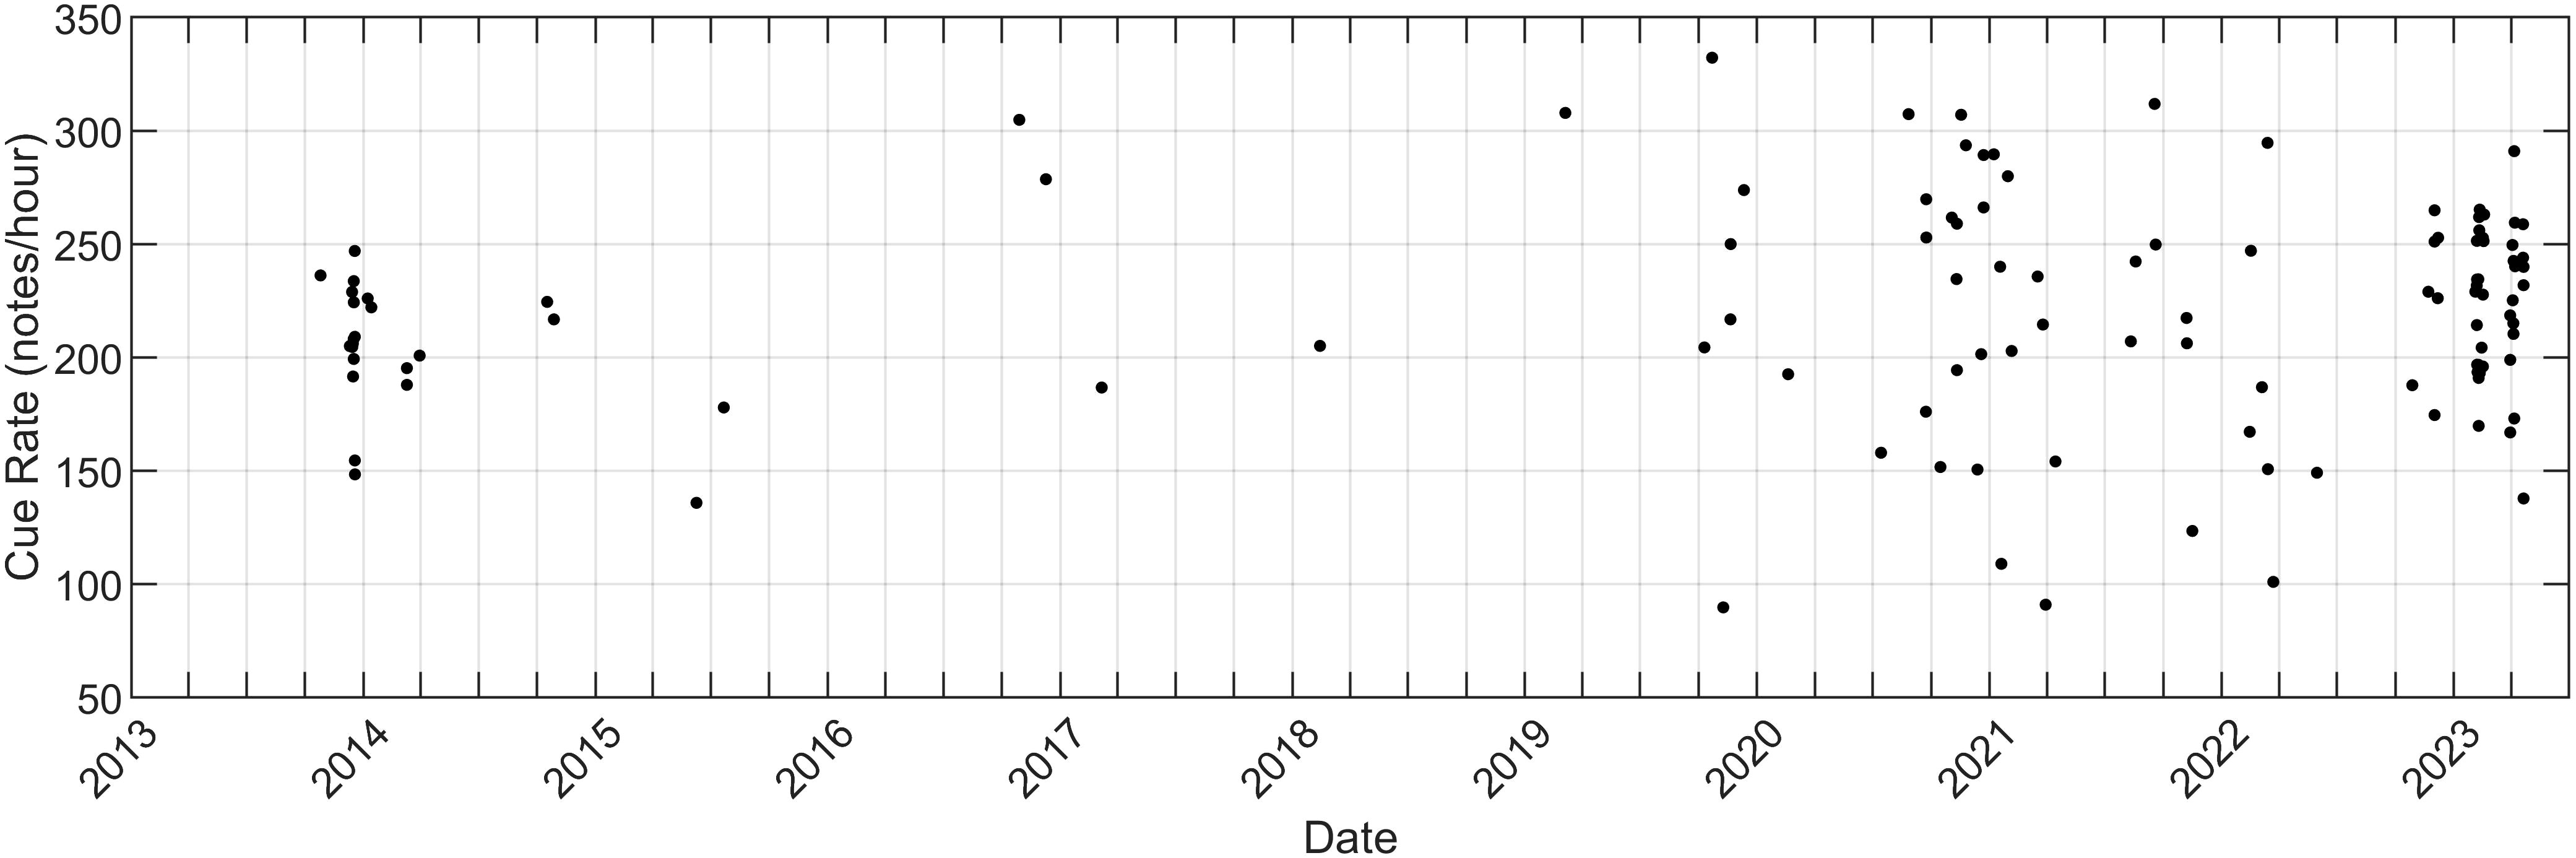
Figure 6 Along-track cue rate for North Atlantic fin whales as a function of time. Cue rate was calculated as the number of A and B notes in a recording divided by the total elapsed time and is in units of notes/hour.
Regular singing gaps greater than 60 s occurred during these fin recordings. INIs are plotted for an example longer-than-average recording without separation for note types in Figure 7. This longer recording allows us to observe the regularity of these singing gaps over hours of song. The y-axis upper limit is 200 s to illustrate the longer pauses in the fin whale song. Across all 119 recordings, there were 1189 of these gaps with a median length of 123 s (Q1 = 97, Q3 = 159) and a median spacing from the start of one gap to the start of the next of 14.0 min (Q1 = 9.4, Q3 = 18.0). The spacing between gaps showed no significant trend over this 10 year dataset.
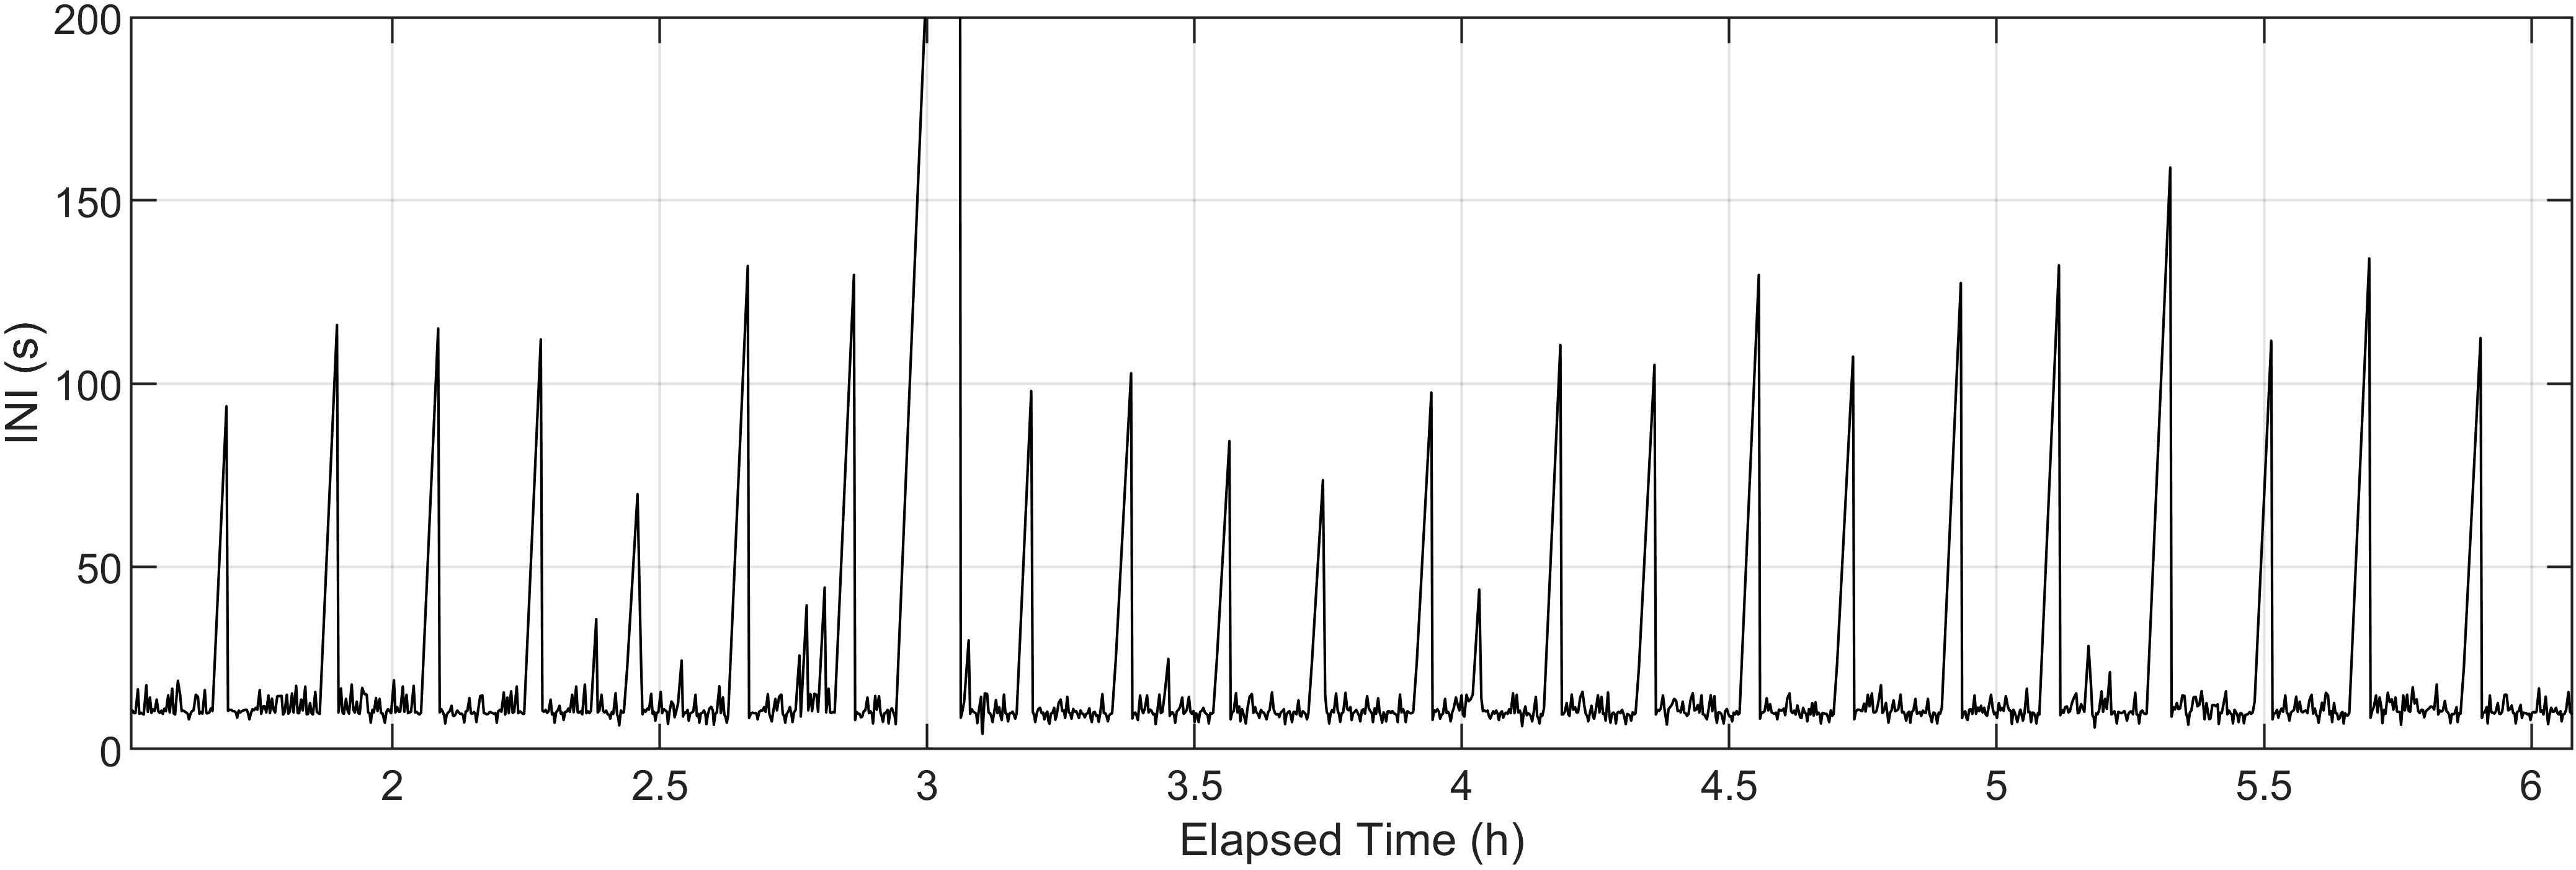
Figure 7 Inter-note intervals (INIs) for an example fin whale song recording without separation for note type pairings.
3.2 Frequency of notes
A total of 51 recordings had at least 20 A notes that met the 5 dB SNR threshold. The median peak frequency of these A notes was 18 Hz (Q1 = 18, Q3 = 18) and the median 3 dB bandwidth was 3 Hz (Q1 = 3, Q3 = 3). A total of 117 recordings had at least 20 B notes that met the 5 dB SNR threshold. The median peak frequency of these B notes was 23 Hz (Q1 = 22, Q3 = 25) and the median 3 dB bandwidth was 8 Hz (Q1 = 7, Q3 = 10). These values were not sensitive to shifting the SNR threshold up to 10 dB (resulted in shifts of<0.3 Hz). There were five recordings with B note peak frequency values averaging over 28 Hz (range: 28–31 Hz). These tracks had very few A notes and the B notes all had lower than average bandwidths (range: 6–7 Hz). The peak frequency for both note types and 3 dB bandwidth for A notes were stable over the 10 year dataset, but the B note 3 dB bandwidth significantly decreased at an average rate of -0.2 Hz/year (95% CI[-0.3,-0.2]).
A total of 98 recordings had at least 20 upsweep notes that met the 5 dB SNR threshold. The median peak frequency of these notes was 126 Hz (Q1 = 126, Q3 = 127) and the median 3 dB bandwidth was 6 Hz (Q1 = 5, Q3 = 6). Similarly to the A and B notes, these frequencies were not sensitive to shifting the SNR threshold up to 10 dB. Not every B note had a corresponding upsweep immediately prior to it, but almost every upsweep immediately preceded a B note. No upsweeps were observed immediately before A notes, but occasionally upsweeps were detected during the singing gaps when A and B notes were not detected. The peak frequency for the upsweep notes decreased significantly over the 10 year dataset at an average rate of -0.4 Hz/year (95% CI[-0.4,-0.4]), but the 3 dB bandwidth was stable over this time (Figure 8).
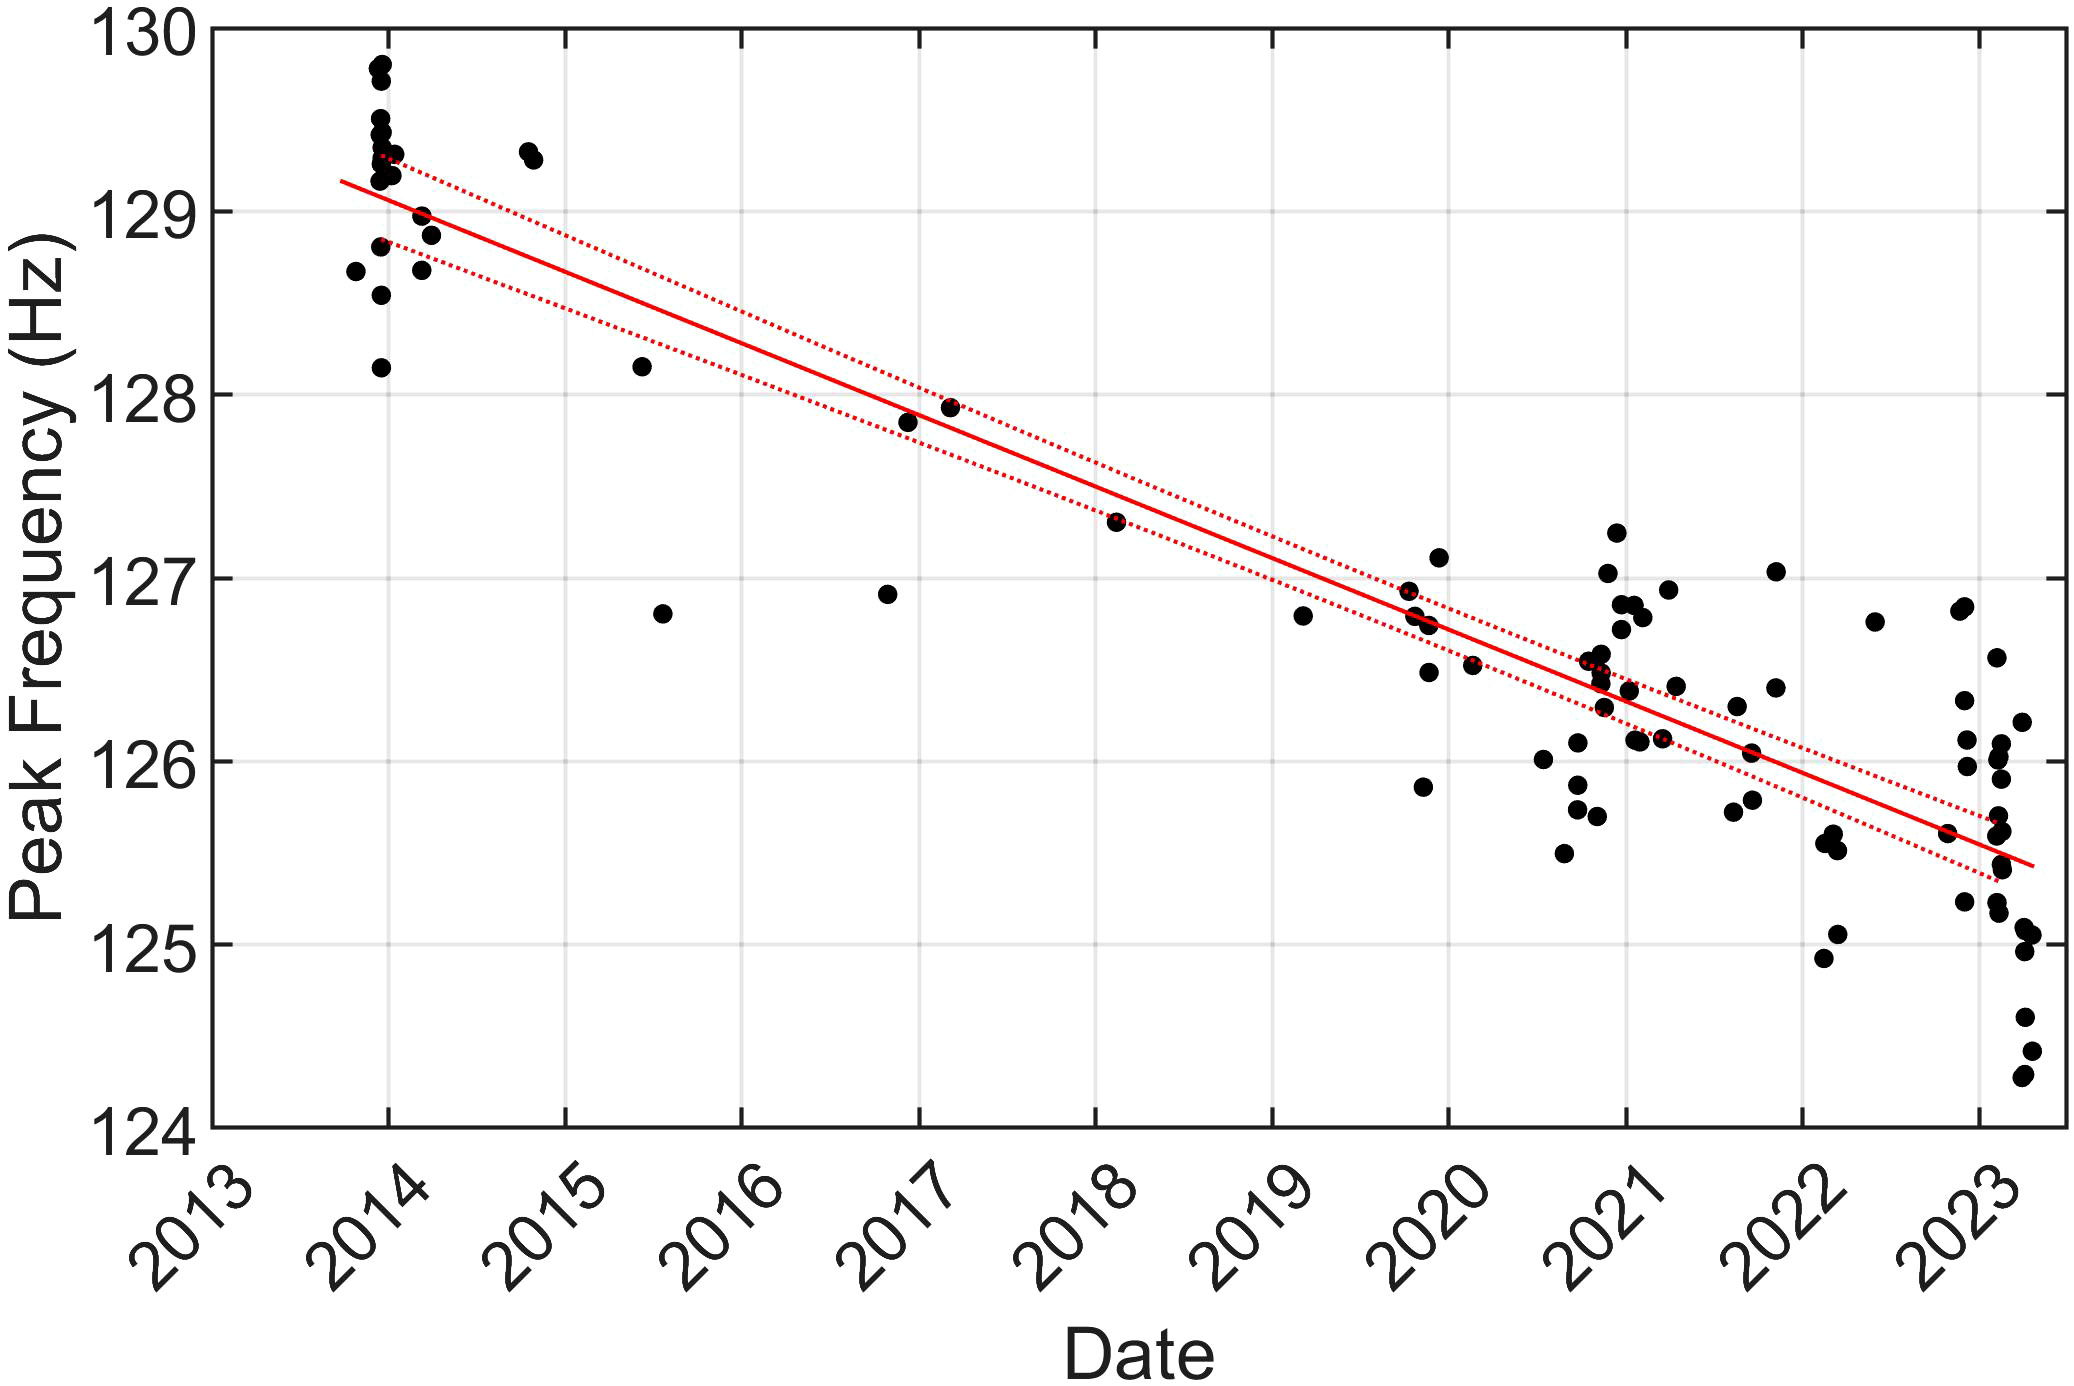
Figure 8 Mean peak frequencies of upsweep notes (black dots) for each recording that had at least 20 upsweeps with SNRs of 5 dB or greater. The line of best fit is shown in red with its 95% prediction intervals as dotted lines (non-simultaneous functional bounds).
4 Discussion
With this unique dataset, we analyzed fin whale song over almost 10 years and over all times of the year in which the fin whales were present using recordings of passive acoustic tracks of fin whales in the North Atlantic. Using similar methods to Helble et al. (2020), we differentiated between four different song patterns often interwoven within individual song and analyzed stability over time. These are likely not the only song patterns that fin whales in the North Atlantic sing, as we probably did not sample every population. Many of the nuances in fin whale singing behavior we report here have not been described in previous research. These results are needed to ultimately estimate the abundance and distribution of a poorly understood species.
Variability in INIs existed both within an individual’s song and between songs of the same type (see Figure 4). Because we are unable to group song patterns into smaller geographical areas, it is impossible to determine how much of the between-whale variability is due to pooling multiple regions versus individual variability within a region. In spite of this, the variability observed in this dataset (inter-quartile ranges of the median INIs within a song pattern of 0–5 s, see Table 2) is comparable to the variability observed at a single location at PMRF in Hawaiian waters (inter-quartile ranges of 0–7 s), suggesting that it is unlikely that the variability can be explained solely from the pooling of multiple regions.
Some of the song patterns observed in this dataset were similar to those reported in previous studies. The rarest song pattern recorded in our study was the A-A singlet with a median INI of approximately 25 s. This INI is similar to the A-A INIs reported in the Norwegian Sea in 2014 by Garcia et al. (2018). Like previous studies in the North Atlantic, no A-A doublet song pattern was observed in our dataset. B-B singlet song patterns observed here had a median INI of approximately 13 s. B-B singlet song patterns within the 12–15 s inter-quartile range have been reported in the Mediterranean in 1999 and 2006–2008, in the Davis Strait of Western Greenland in 2006, near Portugal in 2007–2008, in the Strait of Gibraltar and Alboran Sea in 2007–2009, in the Azores in 2008, and in the Norwegian Sea in 2014 (Clark et al., 2002; Simon et al., 2010; Castellote et al., 2012; Garcia et al., 2018; Pereira et al., 2020). Only one other study previously reported B-B doublet song which was recorded near the Svalbard Islands in 2016–2017, but those INIs (9/14 s) (Papale et al., 2023) were shorter than the median INIs reported here (12/20 s), although as we will discuss further, several of these song patterns have different INIs in different years and during different times of the song season. The under-representation of A-B doublet song patterns in previous studies may be due in part to some previous methodology ignoring A notes in between B notes when analyzing song pattern, but the one other study to report A-B doublet song reported INIs of 15/16 s in the Mediterranean in 1999 (Clark et al., 2002), which is greater than the median A-B INIs reported here of 10/11 s. Interestingly the A-B and B-A intervals observed here are very similar to each other (10/11 s), while in the North Pacific, they were more different (e.g., 12/20 s in Helble et al., 2020). One could argue that these A-B songs should be classified as a singlet with two different note types, but here we will keep the name doublet to avoid confusion with single-note singlets.
Some of the fin whale song pattern INIs shifted over time, both over many years and within song seasons. The B-B doublet INIs significantly increased from spring 2019–2023 and the A-B doublet song pattern INIs increased each year from summer to spring and then reset the following summer. In the North Atlantic, inter-annual INI increases for all note pairing types have been observed in the Mediterranean, although the slopes reported (0.1 s/year, Best et al., 2022) are much less than the slopes measured here for B-B doublets (0.7 and 2.0 s/year). Intra-annual B-B singlet INI increases were measured over five years near Bermuda, but inter-annual shifts were not present (Watkins et al., 1987), and over two years in Massachusetts Bay and the New York Bight (Morano et al., 2012). In the North Pacific, fin whale song patterns have also been observed to have increasing INIs both over many years (Širović et al., 2017; Weirathmueller et al., 2017; Helble et al., 2020) and within the same song season (Oleson et al., 2014; Širović et al., 2017). It is unknown why these fin whale INIs tend to increase over time and why some reset each song season while others have a long-term lengthening trend. Weirathmueller et al. (2017) saw both an increase in inter-annual INI and a decrease in frequency for fin whale song in the Northeast Pacific and suggested that there might be a trade-off between frequency and calling rate with lower frequency notes requiring a slower calling rate, but we observed an increase in INI without a corresponding decrease in B note peak frequency. One hypothesis is that INI increases could be related to population density increases over time in which whales vocalize at a slower rate to reduce overlap with other singers. Alternatively, INI increases might be a result of slow individual drift and simultaneous song synchronization. This drift may be random or may have an underlying environmental cause. Intra-annual trends could be linked to hormone levels changing throughout the song season as suggested by Oleson et al. (2014). Male humpback whales (Megaptera novaeangliae) have seasonal increases in testosterone (Clark and Clapham, 2004; Vu et al., 2012, Vu et al., 2014), and, assuming male fin whales are the only ones singing (Watkins et al., 1987; Croll et al., 2002), perhaps male fin whales have similar cycles of testosterone which affect their singing behavior resulting in higher cue rates toward the beginning of each song season than as it progresses.
Higher frequency upsweep notes are decreasing in frequency over time. Hatch and Clark (2004) also observed a similar decrease and reported a median frequency decrease of 3 Hz between 1993 and 2002 in the northeastern North Atlantic, which is equivalent to a decrease of 0.3 Hz/year, close to the 0.4 Hz/year that we calculated. Simon et al. (2010) measured a peak frequency value of 132.2 Hz for upsweeps recorded in 2006, which is equal to our estimated value if we extrapolate our line of best fit back to January 2006. Garcia et al. (2018) calculated an amplitude-weighted average frequency of 128.7 Hz for upsweeps recorded in 2014 which is in line with our measurements during that time. Interestingly, although the upsweep frequency decreased, the peak frequencies of the other notes in fin whale song did not change (although the 3 dB bandwidth of the B notes decreased at 0.2 Hz/year). This decrease of the upsweep frequencies while the low-frequency notes remained stable was also noted by Clark and Gagnon (2022). Perhaps the low frequency notes are at their lower physiological limit (as suggested for blue whales (Balaenoptera musculus) by Rice et al., 2022), although Weirathmueller et al. (2017) reported inter-annual decreases in fin whale A note frequencies that occurred as singlets in the North Pacific. Long-term decreasing frequency trends have also been observed in blue whales and bowhead whales (Balaena mysticetus) (e.g., McDonald et al., 2009; Thode et al., 2017; Rice et al., 2022). Several hypotheses have been proposed for these decreasing frequencies including that they are a result of sexual selection, population density recovery after whaling, and/or an unintended consequence of song synchronization (McDonald et al., 2009; Rice et al., 2022). More work should be done to continue to monitor the frequency of these upsweeps to see how long this 30-year trend continues and investigate variables that could be linked to this frequency decline.
While the median peak frequencies of A and B notes in the North Atlantic are similar to those measured in the North Pacific, the 3 dB bandwidths of these notes are less in the North Atlantic than the North Pacific (Helble et al., 2020). It is not surprising that there are differences in fin whale song between the two ocean basins since these populations are thought to be geographically isolated, what is surprising is that there are so many similarities. The connection of baleen whale populations and the sharing of notes and even song patterns between populations separated by ocean basins is still under investigation, but a model has been hypothesized for this process in humpback whales (Zandberg et al., 2021), which could be similar to what is happening with fin whales.
There may be a small number of individuals in the North Atlantic that produce B notes at a higher frequency than most fin whales with peak frequencies over 28 Hz compared to the median peak frequencies of 23 Hz. More work needs to be done to estimate the number of fin whales that produce this higher frequency song and whether other characteristics of these fin whales are different.
In contrast to some of the North Pacific fin whale song patterns, we did not observe sudden appearances of new song patterns, and the observed song pattern proportions seemed relatively stable over time. Perhaps the North Atlantic fin whale song patterns and note pairings are more stable over time (although Hatch and Clark, 2004 did observe times in the North Atlantic when one dominant song pattern was replaced by another), or perhaps we happened to analyze a period in between major transitions. These changes in song patterns, note pairings, and INIs can only be captured with long-duration datasets and so continuous monitoring effort needs to be prioritized.
The along-track cue rate calculated for these singing fin whale recordings was greater than the along-track cue rate calculated for North Pacific fin whales near Kaua’i, Hawai’i (Helble et al., 2020). Also, unlike the North Pacific fin whales, once all the note pairing types were combined (excluding upsweeps) these North Atlantic fin whales did not show intra- or inter-annual trends in cue rate over time, which is a benefit for combining A and B notes as a cue for passive acoustic density estimation. However, the cue rates did have substantial variability which is likely due to differences in behavior (e.g., Clark et al., 2019; Guazzo et al., 2021). Helble et al. (2020) suggested that the gaps between song bouts could be used as a cue instead. The intervals between gaps appear to be more stable between ocean basins than individual notes and are stable over time in this dataset. The number of tracks in a given time period could also be a viable cue in areas like our study area where tracking is possible. However, all of these cues would still only allow for the number of vocally active fin whales to be estimated. The proportion of time that whales are vocally active and the proportion of the population that is vocally active still needs to be determined to estimate fin whale abundance in an area.
This study adds support to the hypothesis that the gaps between song bouts correspond to surfacing events (Helble et al., 2020). The regularity of these gaps and their timing aligns with surfacing intervals that have been previously observed (Watkins et al., 1987; McDonald et al., 1995; Nieukirk et al., 2004). Occasionally these gaps occurred when two tracks approached each other similar to what was reported by Watkins et al. (1987). Singing humpback whales have also been observed to sometimes stop singing when interacting with another singer (e.g., Cholewiak et al., 2018). Upsweeps and B notes were occasionally detected during these gaps and often had lower received levels, which could be due to lower source levels from the individual or changes in acoustic transmission when the animal is closer to the surface.
Although this unique dataset allowed us to describe fin whale singing behavior in the North Atlantic across a decade and record individuals for hours at a time, we are unable to provide whale locations on a smaller scale. Fin whales might have regionally specific song patterns within an ocean basin (e.g., Hatch and Clark 2004; Delarue et al., 2009; Castellote et al., 2012) and these similarities and differences could help to increase our understanding of fin whale migration patterns and population connectivity. However, different song patterns are not necessarily indicative of different populations as found by Helble et al. (2020) in Hawaiian waters, and researchers should be cautious not to over-interpret their data if they find multiple song patterns in the same region. Future work should aim to compare fin whale singing behavior across both time and space which will be vital for management and conservation of this poorly understood species.
Due to the overwhelming number of singing fin whales passing over the study area, a recording could not be made by the analysts for all fin whale tracks. While not intended, it is possible that this could lead to some bias for certain song patterns to be recorded more often. As a result, the proportion of different song patterns observed here may be different from the rate at which these occur naturally. In addition, although we are analyzing many more fin whale songs than most previous research for longer durations each and over a decade, this sample of fin whales spread out over ten years and an unknown number of recording sites could certainly result in missed song patterns and we may be under-reporting the true diversity of songs. Therefore, it is unclear how much of the differences between previous studies and ours are due to changes in fin whale singing behavior over time or between regions that we might have under-sampled versus differences in methodology between our work and that of others such as ignoring A notes (e.g., Castellote et al., 2012) or recording for short durations and analyzing short segments of song (e.g., Papale et al., 2023).
In conclusion, fin whale song in the North Atlantic from 2013–2023 is more complex than previously reported and much of the nuances in their singing behavior has not been described in previous research. Similarly to the North Pacific, INI alone is not enough to categorize song pattern — both INI and note pairings need to be considered. Upsweep note peak frequencies have been decreasing for 30 years and should continue to be monitored, while the lower frequency notes seem to be more stable, although there is some individual variability. Although INIs for some of these song patterns have increased both within song seasons and over many years, average cue rate for actively singing fin whales has been steady over these years. More work is needed to quantify the proportion of whales that sing and understand other vocalizations that fin whales produce to develop a more complete picture of fin whale presence and abundance across the North Atlantic.
Data availability statement
The original contributions presented in the study are included in the article/Supplementary Material. Further inquiries can be directed to the corresponding author.
Ethics statement
Ethical approval was not required for the study involving animals in accordance with the local legislation and institutional requirements because this study was conducted using passive acoustic monitoring of wild animals with underwater microphones (i.e.hydrophones) and has no impact on animals’ lifecycle.
Author contributions
RG: Conceptualization, Formal analysis, Funding acquisition, Investigation, Methodology, Software, Visualization, Writing – original draft, Writing – review & editing. DS: Data curation, Writing – review & editing. ME: Data curation, Writing – review & editing. GG: Data curation, Writing – review & editing. TH: Conceptualization, Methodology, Software, Writing – review & editing.
Funding
The author(s) declare that financial support was received for the research, authorship, and/or publication of this article. This research was supported by the U.S. Navy’s Living Marine Resources Program (Award Number N0002523WR0061R). Data collection was supported by U.S. Pacific Fleet (Code N465JR, Award Number N0007020WR0EP8F) and OPNAV N974.
Acknowledgments
The authors would like to thank the members of the Whale Acoustic Reconnaissance Project (WARP) lab at NIWC Pacific — especially Gabriela Alongi and Elizabeth Henderson — for their support of this project. The authors would also like to thank Christopher W. Clark for creating this marine mammal monitoring program. The SMART SEED Grant helped RG initially start this research collaboration.
Conflict of interest
Authors DS and ME are employed by the company Marine Acoustics, Inc. GG was employed by Marine Acoustics, Inc.
The remaining authors declare that the research was conducted in the absence of any commercial or financial relationships that could be construed as a potential conflict of interest.
Publisher’s note
All claims expressed in this article are solely those of the authors and do not necessarily represent those of their affiliated organizations, or those of the publisher, the editors and the reviewers. Any product that may be evaluated in this article, or claim that may be made by its manufacturer, is not guaranteed or endorsed by the publisher.
Supplementary material
The Supplementary Material for this article can be found online at: https://www.frontiersin.org/articles/10.3389/fmars.2024.1278068/full#supplementary-material
References
Best P., Marxer R., Paris S., Glotin H. (2022). Temporal evolution of the Mediterranean fin whale song. Sci. Rep. 12, 13565. doi: 10.1038/s41598-022-15379-0
Bioacoustics Research Program (2017). Raven Pro: Interactive Sound Analysis Software (Version 1.5). (Ithaca, NY: The Cornell Lab of Ornithology). Available at: http://ravensoundsoftware.com/.
Castellote M., Clark C. W., Lammers M. O. (2012). Fin whale (Balaenoptera physalus) population identity in the western Mediterranean Sea. Mar. Mamm. Sci. 28, 325–344. doi: 10.1111/j.1748-7692.2011.00491.x
Cholewiak D. M., Cerchio S., Jacobsen J. K., Urbán-R. J., Clark C. W. (2018). Songbird dynamics under the sea: acoustic interactions between humpback whales suggest song mediates male interactions. R. Soc Open Sci. 5, 171298. doi: 10.1098/rsos.171298
Clark C. W., Borsani J. F., Notarbartolo-Di-Sciara G. (2002). Vocal activity of fin whales, Balaenoptera physalus, in the Ligurian Sea. Mar. Mamm. Sci. 18, 286–295. doi: 10.1111/j.1748-7692.2002.tb01035.x
Clark C. W., Clapham P. J. (2004). Acoustic monitoring on a humpback whale (Megaptera novaeangliae) feeding ground shows continual singing into late spring. Proc. R Soc. Lond B Biol. Sci. 271, 1051–1057. doi: 10.1098/rspb.2004.2699
Clark C. W., Gagnon G. J. (2022). Ethology and behavioral ecology of mysticetes (Cham, Switzerland: Springer Nature Switzerland AG), 11–44. chap. Baleen whale acoustic ethology. doi: 10.1007/978-3-030-98449-6
Clark C. W., Gagnon G. J., Frankel A. S. (2019). Fin whale singing decreases with increased swimming speed. R. Soc Open Sci. 6, 180525. doi: 10.1098/rsos.180525
Crane N. L., Lashkari K. (1996). Sound production of gray whales, Eschrichtius robustus, along their migration route: a new approach to signal analysis. J. Acoust. Soc Am. 100, 1878–1886. doi: 10.1121/1.416006
Croll D. A., Clark C. W., Acevedo A., Tershy B., Flores S., Gedamke J., et al. (2002). Only male fin whales sing loud songs. Cah Rev. 417, 809. doi: 10.1038/417809a
Delarue J., Martin B., Hannay D., Berchok C. L. (2013). Acoustic occurrence and affiliation of fin whales detected in the northeastern Chukchi Sea, July to October 2007–10. Arctic 66, 159–172. doi: 10.14430/arctic4287
Delarue J., Todd S. K., Van Parijs S. M., Di Iorio L. (2009). Geographic variation in Northwest Atlantic fin whale (Balaenoptera physalus) song: implications for stock structure assessment. J. Acoust. Soc Am. 125, 1774–1782. doi: 10.1121/1.3068454
Garcia H. A., Zhu C., SChinault M. E., Kaplan A. I., Handegard N. O., Godø O. R., et al. (2018). Temporal-spatial, spectral, and source level distributions of fin whale vocalizations in the Norwegian Sea observed with a coherent hydrophone array. ICES J. Mar. Sci. 76, 268–283. doi: 10.1093/icesjms/fsy127
Guazzo R. A., Durbach I. N., Helble T. A., Alongi G. C., Martin C. R., Martin S. W., et al. (2021). Singing fin whale swimming behavior in the central North Pacific. Front. Mar. Sci. 8. doi: 10.3389/fmars.2021.696002
Guazzo R. A., Helble T. A., Alongi G. C., Durbach I. N., Martin C. R., Martin S. W., et al. (2020). Lombard effect: humpback whale song source levels increase as ambient ocean noise levels increase. J. Acoust. Soc Am. 148, 542–555. doi: 10.1121/10.0001669
Harris D. V., Miksis-Olds J. L., Vernon J. A., Thomas L. (2018). Fin whale density and distribution estimation using acoustic bearings derived from sparse arrays. J. Acoust. Soc Am. 143, 2980–2993. doi: 10.1121/1.5031111
Hatch L. T., Clark C. W. (2004). Acoustic differentiation between fin whales in both the North Atlantic and North Pacific Oceans, and integration with genetic estimates of divergence. Paper SC/56/SD8 presented to the International Whaling Commission Scientific Committee.
Helble T. A., Guazzo R. A., Alongi G. C., Martin C. R., Martin S. W., Henderson E. E. (2020). Fin whale song patterns shift over time in the central North Pacific. Front. Mar. Sci. 7. doi: 10.3389/fmars.2020.587110
Helble T. A., Ierley G. R., D’Spain G. L., Roch M. A., Hildebrand J. A. (2012). A generalized power-law detection algorithm for humpback whale vocalizations. J. Acoust. Soc Am. 131, 2682–2699. doi: 10.1121/1.3685790
Marques T. A., Thomas L., Martin S. W., Mellinger D. K., Ward J. A., Moretti D. J., et al. (2012). Estimating animal population density using passive acoustics. Biol. Rev. 88, 287–309. doi: 10.1111/brv.12001
Marques T. A., Thomas L., Ward J., DiMarzio N., Tyack P. L. (2009). Estimating cetacean population density using fixed passive acoustic sensors: an example with Blainville’s beaked whales. J. Acoust. Soc Am. 125, 1982–1994. doi: 10.1121/1.3089590
McDonald M. A., Hildebrand J. A., Mesnick S. (2009). Worldwide decline in tonal frequencies of blue whale songs. Endanger. Species Res. 9, 13–21. doi: 10.3354/esr00217
McDonald M. A., Hildebrand J. A., Webb S. C. (1995). Blue and fin whales observed on a seafloor array in the Northeast Pacific. J. Acoust. Soc Am. 98, 712–721. doi: 10.1121/1.413565
Morano J. L., Salisbury D. P., Rice A. N., Conklin K. L., Falk K. L., Clark C. W. (2012). Seasonal and geographical patterns of fin whale song in the western North Atlantic Ocean. J. Acoust. Soc Am. 132, 1207–1212. doi: 10.1121/1.4730890
Nieukirk S. L., Stafford K. M., Mellinger D. K., Dziak R. P., Fox C. G. (2004). Low-frequency whale and seismic airgun sounds recorded in the mid-Atlantic Ocean. J. Acoust. Soc Am. 115, 1832–1843. doi: 10.1121/1.1675816
Oleson E. M., Širović A., Bayless A. R., Hildebrand J. A. (2014). Synchronous seasonal change in fin whale song in the North Pacific. PLoS One 9, e115678. doi: 10.1371/journal.pone.0115678
Papale E., Pelagatti M., Pedrazzi G., Buscaino G. (2023). Occurrence and patterns of fin whale songs reveal alternative migration strategies in Svalbard Islands, Norway. Sci. Rep. 13, 4436. doi: 10.1038/s41598-023-31665-x
Pereira A., Harris D., Tyack P., Matias L. (2020). Fin whale acoustic presence and song characteristics in seas to the southwest of Portugal. J. Acoust. Soc Am. 147, 2235–2249. doi: 10.1121/10.0001066
Rice A., Širović A., Hildebrand J. A., Wood M., Carbaugh-Rutland A., Baumann-Pickering S. (2022). Update on frequency decline of Northeast Pacific blue whale (Balaenoptera musculus) calls. PLoS One 17, e0266469. doi: 10.1371/journal.pone.0266469
Simon M., Stafford K. M., Beedholm K., Lee C. M., Madsen P. T. (2010). Singing behavior of fin whales in the Davis Strait with implications for mating, migration and foraging. J. Acoust. Soc Am. 128, 3200–3210. doi: 10.1121/1.3495946
Širović A., Oleson E. M., Buccowich J., Rice A., Bayless A. R. (2017). Fin whale song variability in southern California and the Gulf of California. Sci. Rep. 7, 10126. doi: 10.1038/s41598-017-09979-4
Thode A. M., Blackwell S. B., Conrad A. S., Kim K. H., Macrander A. M. (2017). Decadal-scale frequency shift of migrating bowhead whale calls in the shallow Beaufort Sea. J. Acoust. Soc Am. 142, 1482–1502. doi: 10.1121/1.5001064
Thompson P. O., Findley L. T., Vidal O. (1992). 20-Hz pulses and other vocalizations of fin whales, Balaenoptera physalus, in the Gulf of California, Mexico. J. Acoust. Soc Am. 92, 3051–3057. doi: 10.1121/1.404201
Vu E. T., Clark C., Catelani K., Kellar N. M., Calambokidis J. (2014). Seasonal blubber testosterone concentrations of male humpback whales (Megaptera novaeangliae). Mar. Mamm. Sci. 31, 1258–1264. doi: 10.1111/mms.12191
Vu E. T., Risch D., Clark C. W., Gaylord S., Hatch L. T., Thompson M. A., et al. (2012). Humpback whale song occurs extensively on feeding grounds in the western North Atlantic Ocean. Aquat Biol. 14, 175–183. doi: 10.3354/ab00390
Watkins W. A. (1981). Activities and underwater sounds of fin whales. Sci. Rep. Whales Res. Inst. 33, 83–117.
Watkins W. A., Tyack P., Moore K. E., Bird J. E. (1987). The 20-Hz signals of finback whales (Balaenoptera physalus). J. Acoust. Soc Am. 82, 1901–1912. doi: 10.1121/1.395685
Weirathmueller M. J., Stafford K. M., Wilcock W. S. D., Hilmo R. S., Dziak R. P., Tréhu A. M. (2017). Spatial and temporal trends in fin whale vocalizations recorded in the NE Pacific Ocean between 2003–2013. PLoS One 12, e0186127. doi: 10.1371/journal.pone.0186127
Keywords: fin whale, inter-note interval, calling rate, cue rate, song, bioacoustics, passive acoustic monitoring, North Atlantic
Citation: Guazzo RA, Stevenson DL, Edell MK, Gagnon GJ and Helble TA (2024) A decade of change and stability for fin whale song in the North Atlantic. Front. Mar. Sci. 11:1278068. doi: 10.3389/fmars.2024.1278068
Received: 15 August 2023; Accepted: 14 February 2024;
Published: 13 May 2024.
Edited by:
Rebecca Dunlop, The University of Queensland, AustraliaReviewed by:
John P. Ryan, Monterey Bay Aquarium Research Institute (MBARI), United StatesJulien Delarue, JASCO Applied Sciences Ltd., Canada
Samara Haver, Oregon State University, United States
Copyright © 2024 Guazzo, Stevenson, Edell, Gagnon and Helble. This is an open-access article distributed under the terms of the Creative Commons Attribution License (CC BY). The use, distribution or reproduction in other forums is permitted, provided the original author(s) and the copyright owner(s) are credited and that the original publication in this journal is cited, in accordance with accepted academic practice. No use, distribution or reproduction is permitted which does not comply with these terms.
*Correspondence: Regina A. Guazzo, regina.a.guazzo.civ@us.navy.mil