Seawater intrusion effects on nitrogen cycling in the regulated Nakdong River Estuary, South Korea
 Yan Huang1
  Bongkeun Song2
  Qinglong Zhang1
  Yunjung Park3
  Stephanie J. Wilson2,4
  Craig R. Tobias5
  Soonmo An1*
- 1Department of Oceanography, College of Natural Sciences, Pusan National University, Busan, Republic of Korea
- 2Department of Biological Sciences, Virginia Institute of Marine Science, Gloucester Point, VA, United States
- 3Department of Integrated Biological Science, College of Natural Sciences, Pusan National University, Busan, Republic of Korea
- 4Smithsonian Environmental Research Center, Edgewater, MD, United States
- 5Department of Marine Sciences, University of Connecticut, Groton, CT, United States
Research on the impact of seawater intrusion on nitrogen (N) cycling in coastal estuarine ecosystems is crucial; however, there is still a lack of relevant research conducted under in-situ field conditions. The effects of elevated salinity on N cycling processes and microbiomes were examined in situ seawater intrusion experiments conducted from 2019 to 2021 in the Nakdong River Estuary (South Korea), where an estuarine dam regulates tidal hydrodynamics. After the opening of the Nakdong Estuary Dam (seawater intrusion event), the density difference between seawater and freshwater resulted in varying degrees of seawater trapping at topographically deep stations. Bottom-water oxygen conditions had been altered in normoxia, hypoxia, and weak hypoxia due to the different degrees of seawater trapping in 2019, 2020, and 2021, respectively. Denitrification mostly dominated the nitrate (NO3-) reduction process, except in 2020 after seawater intrusion. However, denitrification rates decreased because of reduced coupled nitrification after seawater intrusion due to the dissolved oxygen limitation in 2020. Dissimilatory nitrate reduction to ammonium (DNRA) rates immediately increased after seawater intrusion in 2020, replacing denitrification as the dominant pathway in the NO3- reduction process. The enhanced DNRA rate was mainly due to the abundant organic matter associated with seawater invasion and more reducing environment (maybe sulfide enhancement effects) under high seawater-trapping conditions. Denitrification increased in 2021 after seawater intrusion during weak hypoxia; however, DNRA did not change. Small seawater intrusion in 2019 caused no seawater trapping and overall normoxic condition, though a slight shift from denitrification to DNRA was observed. Metagenomic analysis revealed a decrease in overall denitrification-associated genes in response to seawater intrusion in 2019 and 2020, while DNRA-associated gene abundance increased. In 2021 after seawater intrusion, microbial gene abundance associated with denitrification increased, while that of DNRA did not change significantly. These changes in gene abundance align mostly with alterations in nitrogen transformation rates. In summary, ecological change effects in N cycling after the dam opening (N retention or release, that is, eutrophication deterioration or mitigation) depend on the degree of seawater intrusion and the underlying freshwater conditions, which constitute the extent of seawater-trapping.
1 Introduction
Seawater intrusion stands as a pressing concern across various nations, including the US (Moore and Joye, 2021), Australia (Werner, 2010), Spain (Pulido-Leboeuf, 2004), China (Shi and Jiao, 2014), India (Manivannan and Elango, 2019), and South Korea (Jeen et al., 2021). This phenomenon is intricately linked with climate change-induced dynamics such as escalating sea levels and consequential alterations in coastal environments. Notable manifestations encompass excessive extraction of fresh groundwater from coastal aquifers and declining sediment loads, particularly conspicuous in estuarine territories (Ketabchi et al., 2016; Hussain et al., 2019).
The repercussions of seawater intrusion transcend freshwater contamination, engendering critical shortages in potable water, agricultural irrigation, and industrial functions (Wang et al., 2019). Furthermore, it significantly impinges upon water quality, sediment dynamics, and the delicate ecosystems of estuarine zones (Wang et al., 2019). Shifts in local vegetation composition are observed, favoring species with unidirectional salt tolerance (Werner et al., 2013). Additionally, seawater intrusion perturbs the biogeochemical cycling of vital nutrient elements like carbon and nitrogen (N), influencing the composition and functionality of microbial communities in estuarine and coastal ecosystems (Giblin et al., 2010; Santoro, 2010).
N is a biologically limiting nutrient that controls primary productivity. Nitrification, denitrification, anaerobic ammonia oxidation (anammox), and dissimilatory nitrate reduction to ammonium (DNRA) (An and Gardner, 2002) are the primary N transformation processes involved in benthic N cycling. Among these processes, denitrification and anammox account for 60% of marine reactive N loss (nitrate (NO3-), nitrite (NO2-), or ammonium (NH4+)) (Eugster and Gruber, 2012). Nitrification is an aerobic ammonia oxidation process that occurs primarily in oxic sediments. Conversely, NO3- reduction processes (denitrification, anammox, and DNRA) typically occur under anoxic conditions. Both denitrification (often functionally coupled with nitrification) and anammox can convert reactive N into its unreactive atmospheric form (N2), resulting in a reactive N loss. DNRA is a microbial process in which NO3- is partially reduced to NH4+, which contributes to N retention in sediments and prevents reactive N loss (An and Gardner, 2002; Deng et al., 2015).
Benthic N cycling is regulated by various environmental factors, including dissolved oxygen (DO) levels, organic matter content, salinity, substrate availability (for example, NO3-), and the presence of inhibitors (for example, sulfide) (An and Joye, 2001; Jensen et al., 2008; Giblin et al., 2010). Seawater intrusion will affect benthic N cycling (Seo et al., 2008; Giblin et al., 2010; Santoro, 2010; Hines et al., 2015; Wang et al., 2018; Neubauer et al., 2019; Widney et al., 2019; Xie et al., 2020; Mai et al., 2022; Feng et al., 2023; Xiong et al., 2023). Sediment denitrification potential was highest under freshwater conditions (salinity close to 0%), and seawater addition immediately inhibited denitrification (Seo et al., 2008). Other studies consistently demonstrated that both benthic nitrification and denitrification are suppressed at higher salinities (Laverman et al., 2007; Li et al., 2014; Osborne et al., 2015). Conversely, Fear et al. (2005) reported no association between salinity levels (2–24 PSU) and denitrification rates. Widney et al. (2019) found persistent saltwater intrusion in freshwater marshes alters N cycling by releasing NH4+-N and increasing nitrification. However, its long-term effects on N cycling have not yet been confirmed (Widney et al., 2019). Several studies have indicated that seawater intrusion can lead to increased DNRA because it has a competitive advantage over denitrification (in NO3- utilization) under high-salinity conditions (that is., seawater intrusion) (Laverman et al., 2007; Giblin et al., 2013; Marchant et al., 2014). Seawater intrusion can alter the microbial community composition, abundance, diversity, and structure involved in N cycling (Giblin et al., 2010; Santoro, 2010; Hines et al., 2015; Helali et al., 2016; Wang et al., 2018; Neubauer et al., 2019; Widney et al., 2019; Xie et al., 2020; Mai et al., 2022; Feng et al., 2023; Xiong et al., 2023). For example, it inhibits nitrifier activity (Rysgaard et al., 1999; Wang et al., 2018) and leads to shifts in both denitrifier and DNRA microbe community composition while increasing DNRA-associated gene abundance (Neubauer et al., 2019).
Previous studies have used both press and pulse seawater addition treatments (Widney et al., 2019) and laboratory NaCl treatments (Seo et al., 2008; Wang et al., 2018) to simulate seawater intrusion, which makes it difficult to replicate the in situ environment and cannot capture the potential salinity interactions and other environmental factors in a field setting. Furthermore, most of these studies have focused on seawater intrusion effects on functional genes involved in N cycling or the cycling rate itself, potentially overlooking seawater intrusion effects on environmental factors.
The Nakdong River is the second largest watershed in South Korea (Park et al., 2016), and is a water source for major cities such as Pusan and Daegu, reaching over 13 million people. The Nakdong Estuarine Dam was constructed in 1987 to protect the river from seawater intrusion and secure freshwater resources for drinking, agriculture, and industry (Kim et al., 2017). However, dam construction has hindered fresh- and seawater free exchange, resulting in a shift from estuarine to freshwater systems. The estuary morphology and environmental conditions have changed significantly since dams were constructed (Jang and Kim, 2006; Kang et al., 2007). Dam construction effects include wetland loss and fragmentation, decreasing water quality, changes in benthic animal community structure (Park et al., 2016), increased nutrient concentrations in the water-column, altered phytoplankton composition and increased phytoplankton biomass (Kim et al., 2021; Park et al., 2021), dramatic changes in macrophyte coverage and species composition (salt marshes and seagrass) (Kang et al., 2007; Park et al., 2009), and hydrological changes (Little, 2000). To address these significant ecological and hydrological changes, the Korean government plans to remove the dam and restore the Nakdong River Estuary natural ecological environment (An, 2021).
The Nakdong Estuarine Dam opening experiments were conducted to investigate dam removal feasibility. These experiments provided an optimal opportunity to examine seawater intrusion effects on N cycling in coastal estuarine ecosystems. Seawater intrusion experiments were conducted in situ during 2019–2021 by opening estuary floodgates. After the experiments, the dams were opened regularly from 2022. We examined seawater intrusion effects on benthic N cycling from 2019 to 2021 in the Nakdong River Estuary considering the following aspects: (1) benthic sediment oxygen demand (SOD); (2) benthic N transformation rates, including nitrification, denitrification, anammox, and DNRA; and (3) N cycling-related functional gene abundance changes.
2 Materials and methods
2.1 Sampling sites and protocol
The Nakdong River is situated in the southeastern portion of the Korean Peninsula and is the second longest river in the country (Figure 1), with a main channel spanning 526 km and a 23,817 km2 total catchment area. River discharge was significantly regulated by a massive 2.4 km long-barrage system constructed at the river mouth 1983–1987 (An, 2021). The barrage system comprises six main gates (width = 47.5 m, height = 9.2 m), and four regulating gates (width = 47.5 m, height = 8.3 m). The main gates were kept closed to prevent seawater intrusion. In contrast, the regulating gates remain open during low tide and are closed when the water level difference is < 0.2 m (Yoon et al., 2016; An, 2021). Freshwater discharge follows three phases based on precipitation: a dry period with less discharge from September to March (approximately 100 m3 s−1), a normal period with moderate discharge from April to June (approximately 500 m3 s−1), and a wet period with high discharge from July–September (exceeding 1200 m3 s−1). The annual precipitation is approximately 1500 mm and is concentrated in the summer. The temperature ranges from 4 to 25°C, with distinct seasonal variation. The surface sediment is dominated by muddy sand (~10% mud), with a 2.6–3.9 φ mean grain size (Choy et al., 2008). The estuary experiences a dominant semidiurnal tide, with a tidal range varying from 0.4 m during low tide to 2.0 m maximum during high tide.
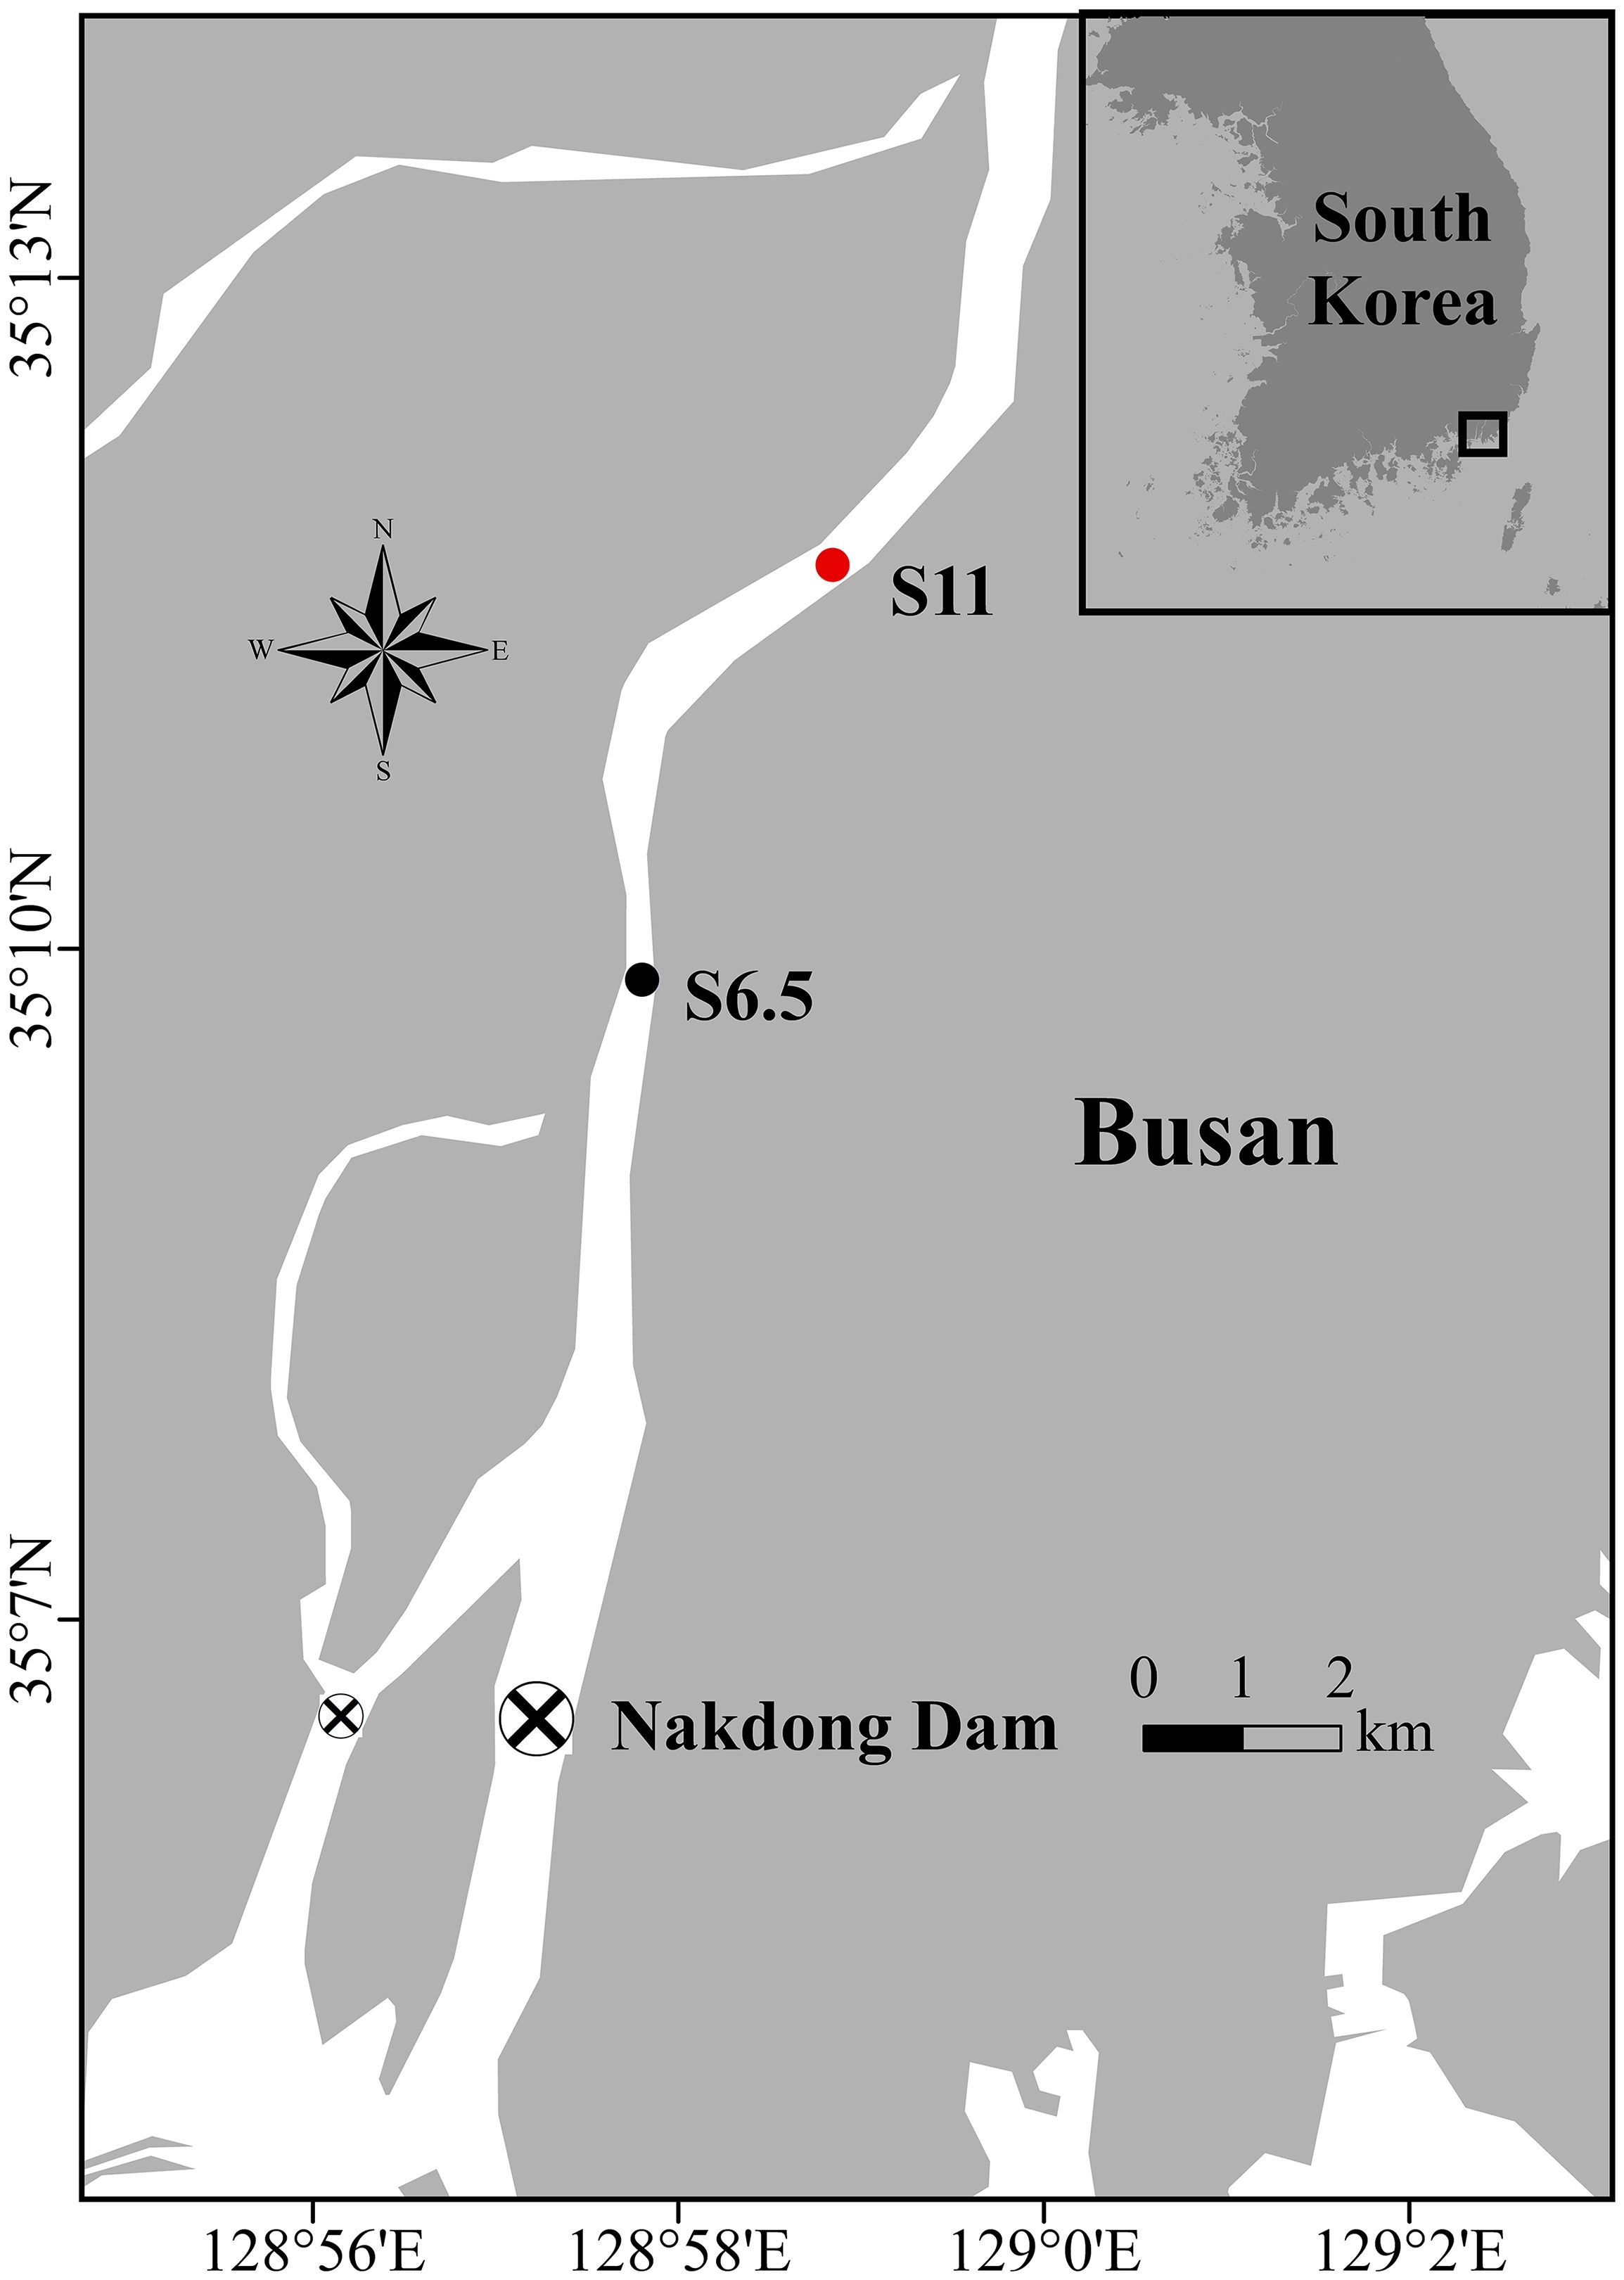
Figure 1 Map of the Nakdong River, estuarine dam, and sampling site locations along the upstream of the Nakdong River. The black dot represents S6.5, situated 6.5 km upstream from the dam and affected by each seawater intrusion. The red dot indicates S11, situated 11 km upstream from the dam, a site minimally affected by seawater intrusion.
Short-term dam opening experiments were conducted in 2019, while long-term dam opening experiments were carried out in 2020 and 2021 (Brevé et al., 2019; Baird et al., 2020; An, 2021; van den Tweel et al., 2021). In 2019, two short-term dam opening experiments took place on June 6 and September 17, involving approximately 0.64 and 1.01 million tons of seawater respectively, flowing upstream of the Nakdong River for 38 minutes and over 1 hour (An, 2021). Following that, long-term dam opening experiments were conducted in both 2020 and 2021. Since 2020, the dam has consistently remained open for one lunar tidal cycle, around 1 month. This period encompasses two tidal cycles, encompassing both high and low tides, with seawater intrusion occurring exclusively during high tides (An, 2021). In this study, we define the long-term seawater intrusion cycle as seawater intrusion during the first high tide of week 1 (SIW 1), followed by seawater intrusion during the first low tide (SIW 1-1), and then repeating similarly during the second week (SIW 2, and SIW 2-2). The first long-term dam opening experiment (third overall, including short-term trials), occurred in June 2020 (June 4–8 = SIW 1; June 19–25 = SIW 2), resulting in a total of 9.3 million tons of seawater flowing into the river (An, 2021). The long-term dam opening method was explored in April, June, August, and October 2021, coinciding with approximately 1.79, 2.07, 2.24, and 2 million tons of seawater intrusion into the river in each respective lunar tidal cycle. As a result of the experimental dam openings in 2019, 2020, and 2021, the National Water Committee decided to permanently open the floodgates (An, 2021). The long-term dam opening method was implemented for the monthly dam opening operations throughout 2022, aligning with the lunar tidal cycle.
The field monitoring and sampling as well as subsequent laboratory experiments were conducted in September 2019 (second dam opening, short-term), June 2020 (third dam opening, long-term), and October 2021 (seventh dam opening, long-term), based on the specific dam opening experiments and corresponding seawater intrusion phases (Table 1). The seawater intrusion phases can be divided into before the dam opening (BDO), seawater intrusion during the first high tide of week 1 (SIW 1), seawater intrusion during the first low tide of week 1 (SIW 1-1), and after the dam opening (ADO). S6.5, located 6.5 km upstream from the dam (the farthest point where seawater can reach in the first dam opening experiment), represents the station affected by each seawater intrusion and was evaluated from 2019 to 2021 (Figure 1). S11, situated 11 km upstream from the dam, was included in the assessment in 2021, indicating a station where seawater intrusion had negligible effects. Details of the sites visited during each seawater intrusion event are listed in Table 1.
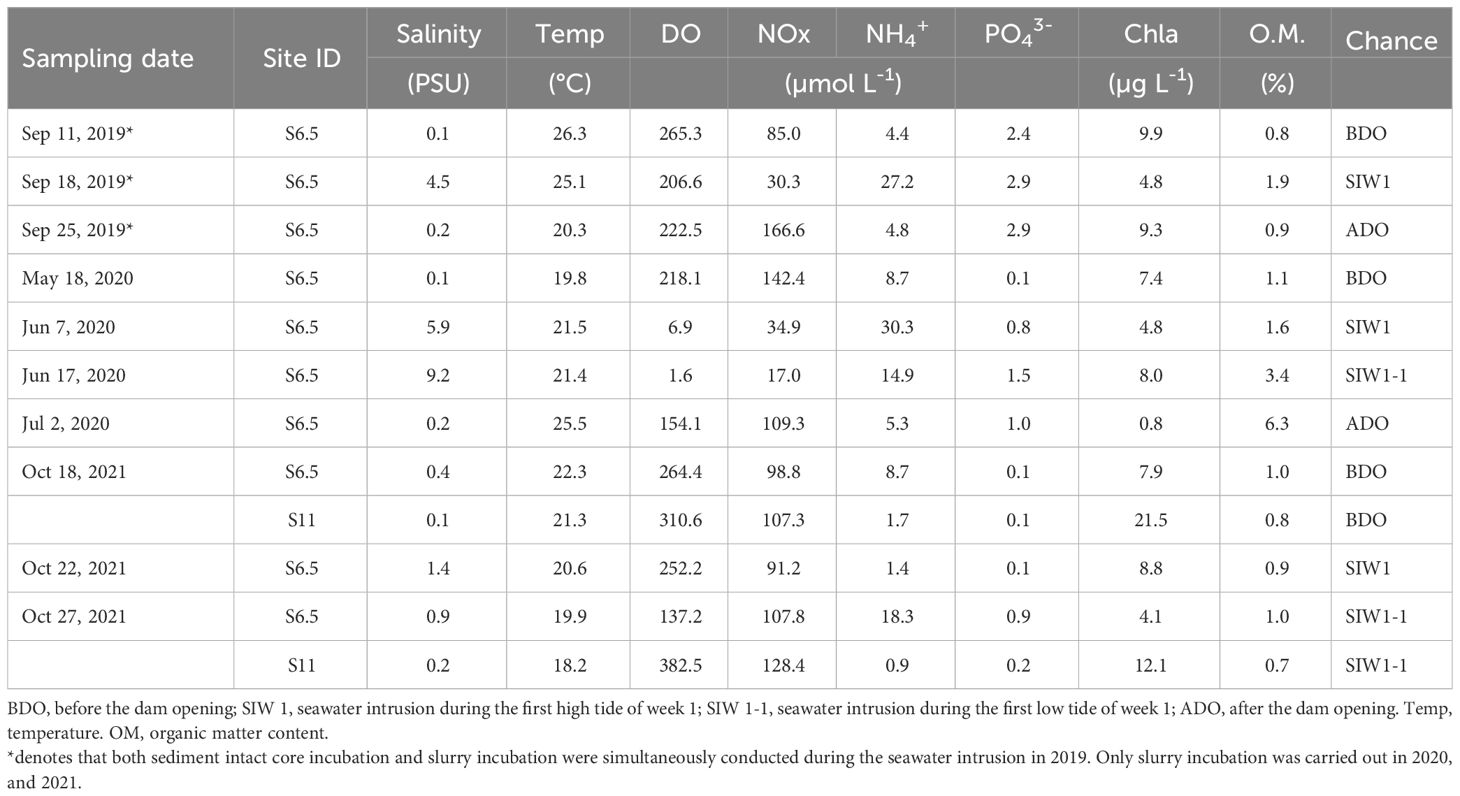
Table 1 Bottom-water conditions, and sediment organic matter content at sites during each sampling activity based on dam opening events from 2019-2021.
Depth profiles or bottom-water temperature, salinity, Chl-a, and DO were acquired using an AAQ Series H-11 multiprobe system (JFE Advantech Co., Ltd.). Intact depth profiles of water quality data were only available in 2020, and 2021. Bottom-water samples were collected in a 5 L Niskin bottle for subsequent incubation experiments and nutrient analysis. Water samples for nutrient analysis were filtered immediately upon collection through glass fiber GF/F filters (Whatman International, Maidstone, Kent, UK) and transferred into 50-mL conical sterile polypropylene centrifugal tubes (Thermo Fisher Scientific, USA).
Sediment samples were collected from the sediment cores in 2019 and grabs in 2020, and 2021. Intact sediment cores and overlying water were collected using acrylic cores (small: internal diameter = 4 cm, height = 23 cm; large: internal diameter = 8 cm, height = 33 cm) by scuba divers with minimal disturbance to the sediment–water interface (An and Joye, 2001). The cores contained approximately 8–10 cm of sediments. Upon collection, the sediment cores and water samples were immediately sealed with polyvinyl chloride caps and transported to the laboratory (within 2–3 h) for subsequent experiments. Surface sediment (0–10 cm) samples were collected using a grab sampler, sealed in sterile plastic bags, and stored in a 4°C ice box before transportation while the sediment samples for metagenomic analysis were stored in 50 mL sterile tubes and frozen with dry ice or liquid nitrogen at the sampling sites. An intact core incubation was conducted in 2019 only to measure the actual benthic N transformation rates and SOD during seawater intrusion. Anaerobic slurry incubation was conducted during each cruise from 2019–2021 to measure the potential denitrification, anammox, and DNRA rates. Aerobic slurry incubation was conducted in 2020 to assess the nitrification potential.
2.2 Bottom-water nutrient analysis and sediment profiles
The filtered bottom-water samples were stored in a −80°C freezer until nutrient analysis. Dissolved inorganic NH4+, NOx (NO3- plus NO2-), and orthophosphate (PO43-) concentrations were determined using standard methods with a spectrophotometer (Shimadzu, UV-1650PC, Japan) (Strickland and Parsons, 1972). Sediment characteristics, including water content (%), grain size proportion > 63 µm (sand content %), and sediment organic matter content (LOI %), were measured using a large core sampler in 2019 and a grab sampler after 2020. Sediment cores were sliced from 0–10 cm at 1 cm intervals and then mixed. Sediment characteristics were measured as previously described (Huang and An, 2022).
2.3 Intact core incubations for benthic denitrification, anammox, DNRA and SOD measurements
Intact sediment cores with their upper caps removed and in situ bottom-water (approximately 20 L) were pre-incubated overnight in the dark at in situ water temperature and O2 saturation in an incubation tank. The tank was amended with Na15NO3- tracer (98–99% atom %, Sigma-Aldrich) at the beginning of the pre-incubation to reach a final concentration of 100 μmol L-1. Immediately after the pre-incubation, the intact cores were incubated for approximately 24 h. Duplicate cores were subsequently used to determine the oxygen concentrations at 0, 1, 2, and 24 h using a membrane inlet mass spectrometer (MIMS) (Kana et al., 1994; Deng et al., 2015; Huang and An, 2022). As described above, the water samples were filtered and preserved for DNRA analysis at each time point.
2.4 Anaerobic slurry incubations to assess potential denitrification, anammox, and DNRA rates
Slurry incubations were conducted according to Thamdrup and Dalsgaard (2002) and Shan et al. (2016) to determine potential denitrification, anammox, and DNRA rates, and their relative contributions to total NO3- reduction. First, homogenized subsamples (0–10 cm) from the fresh sediment were sieved through a 1.0 mm copper sieve to remove visible shells or roots (Wang et al., 2020), and 3 g of sediment and He-purged bottom-water were transferred to 40 mL gas-tight glass vials (Exetainer, Labco, UK), which were sealed immediately to prevent bubbles or headspace. After being pre-incubated overnight to consume the residual O2 and NOx, the slurries received one of three different tracer combinations (15NH4Cl, 15NH4Cl plus K14NO3, or Na15NO3, 98–99% atom %, Sigma-Aldrich) to a final concentration of approximately 100 μmol L-1 15N in each vial. Triplicate vials were sacrificed at 0, 24, 48, and 72 h after 18–24 h, when the 15N tracer reached equilibrium. N2 gas production was immediately analyzed by MIMS system, and 15NO3–amended slurry samples were used for 15NH4+ analysis.
Using the OX/MIMS method (15NH4+ oxidation and MIMS analysis technique) described by Yin et al. (2014), DNRA activity (potential rates from slurry incubation both in 2019 and 2020 or actual rates from core incubation) was determined. The 15NH4+ samples were purged with helium gas to eliminate any 29N2 and 30N2 produced via denitrification and/or anammox in the intact core/slurry incubations and were transferred to 12 mL gas-tight glass vials. Subsequently, a hypobromite iodine solution (0.2 mL) was added to oxidize the 15N gas (29N2 and 30N2), which was analyzed using MIMS to calculate the DNRA rate. In 2021, DNRA activity was detected through KCl extractions and alkaline acid trap diffusion, followed by analysis using an Elemental Analyzer Isotope Ratio Mass Spectrometer (EA-IRMS) system at the University of Connecticut Marine Science (Holmes et al., 1999).
2.5 Aerobic slurry incubations for potential nitrification
Potential nitrification rates were measured in oxic slurries enriched with 15NH4+. Briefly, 3 g of sieved sediment and 40 mL in situ bottom-water were transferred into a 50-mL centrifugal tube and amended with 15NH4+ to a final concentration of 100 μmol L-1 15N in each tube. The slurries were collected and filtered immediately for initial 15NO3- analysis. Triplicate vials were incubated for 6 h on a shaker table at the in situ temperature and collected for the final 15NO3- analyses. 15NO3- samples were analyzed at the University of Connecticut Marine Science using an IRMS system (Casciotti et al., 2002).
2.6 Rates calculation
In the anoxic slurry incubations, 15NH4+-amended and 15NH4+ + 14NO3- treatments were used to test whether all ambient 14NO3- was consumed during pre-incubation and to assess the presence of anammox activity in the sediment (based on 29N2 production). The 15NO3- treatment was used to determine potential denitrification and anammox rates, denitrification contribution to total N2 production, and DNRA contribution to N reduction according to the equations reported by Thamdrup and Dalsgaard (2002).
Both denitrification and anammox contributed to total 29N2 production based on the 15NO3- tracer experiment. Relative denitrification and anammox contributions to total 29N2 production were quantified using the following Equation 1:
where P29, A29 and D29 (nmol N g-1 d-1) denote the total 29N2 production rate during slurry incubation, anammox contribution to the 29N2 production rate, and denitrification, respectively, to the 29N2 production rate. Denitrifiers can use 14NO3- and 15NO3- randomly to produce N2 gas; denitrification occurs after 14N and 15N random pairing, according to. Therefore, D29 was estimated using the following Equation 2:
where P30 represents the total 30N2 production rate during slurry incubation and FN represents the 15N mole fraction in 14NO3-, which can be obtained by measuring the 14NO3- concentrations before and after 14NO3- tracer addition.
Finally, the potential anammox and denitrification rates were calculated using the following Equations 3, 4:
where Dt and A29 (nmol N g-1 day-1) represent the potential denitrification and anammox rates, respectively. The potential DNRA (nmol N g-1 day-1) was calculated from the increase in 15NH4+, which was converted from 15N gas (29N2 and 30N2). Potential nitrification (nmol N g-1 day-1) was calculated from the increase in 15NO3- during oxic slurry incubation.
In the intact-core incubations, the measured O2, 29N2, and 29N2 concentration linear regression slopes against time were used to calculate the rate. The units for sediment oxygen uptake (µmol O2 l-1 h-1) and benthic N reduction (denitrification, anammox, and DNRA, µmol N2 l-1 h-1) in the core incubation were converted to mmol O2 m-2 day-1 and mmol N m-2 day-1, respectively, by dividing them by the intact incubation sediment surface area.
Anammox activity was confirmed using a 15NH4+ tracer, which supported the anoxic slurry incubation hypothesis (Thamdrup and Dalsgaard, 2002). Therefore, N2 production was derived from both denitrification and anammox in intact core incubations, from which the actual denitrification and anammox activity was calculated using the revised isotope pairing technique (Risgaard-Petersen et al., 2003; Huang and An, 2022). The actual total N2 production (P14) and anammox and denitrification rates (aao14 and den14) in the intact core were calculated according to Huang and An (2022).
2.7 Total gene abundances measurements related to N cycling
The frozen sediment samples (0.5 g) were used for DNA extraction using the DNeasy PowerLyzer PowerSoil kit (Qiagen) as described in the manufacturer’s protocol at the Virginia Institute of Marine Science. The extracted genomic DNA was sequenced by Novogene Corporation (CA, USA) using an Illumina NovaSeq 600 platform (2 x 150 bp). The raw metagenome sequences were uploaded to the KBase pipeline. Functional gene profiles of each metagenome were examined using the FAMA program, particularly N cycling genes in nitrification (amoA), denitrification (nirS and nirK), anammox (hzo), and DNRA (nrfA). The gene abundances were aggregated for each process and normalized using the reference gene effective fragment count per kg (efpkg). The gene abundance variability of bottom-water microbial communities was measured in 2020.
2.8 Statistical analyses
One-way analysis of variance (ANOVA) was used to determine whether seawater intrusion had a significant impact on various hydrological parameters, nutrient concentrations, SOD, and N transformation rates (denitrification, anammox, and DNRA) at different sites and cruises. Homogeneity of variance and normal distribution tests were conducted prior to ANOVA. If any data did not meet the assumptions of ANOVA, non-parametric tests (such as the Kruskal–Wallis test) were utilized. Statistical significance at P<0.05 was considered significant. Pearson’s correlation analyses were used to examine the relationship between N transformation rates and environmental parameters. All statistical analyses were performed using Statistical Package for the Social Sciences (SPSS) version 25.
3 Results
3.1 In situ bottom-water and sediment physicochemical characteristics
Overall, bottom-water temperatures and DO ranged from 18.2–26.3°C and 1.6–382.5 μmoL L-1, respectively (Table 1). Significant inter-annual differences (ANOVA, P = 0.042) and spatial differences (ANOVA, P = 0.04) were observed in the bottom-water DO. DO was high at S11 (346.6 μ moL L-1) and low at S6.5 (172.9 μmoL L-1). Salinity ranged from 0.1 to 9.2 PSU, with no significant spatial or inter-annual differences observed, despite a recorded salinity of 2.3 PSU at S6.5 and 0.2 PSU at S11. However, significant seawater intrusion impact was observed, evidenced by salinity measuring 0.2 PSU before the dam opening, 3.7 PSU during seawater intrusion, and returning to 0.2 PSU after the dam opening (Kruskal–Wallis test, P = 0.043). Bottom-water Chl-a values ranged from 0.8–21.5 µg L-1, and spatial variations were found between S6.5 (7.2 ± 3.7 µg L-1) and S11 (16.8 ± 6.6 µg L-1) (ANOVA, P=0.013).
Bottom-water NOx, NH4+, and PO43- concentrations ranged from 17–166.6, 0.9–30.3, and 0.1–2.9 μmoL L-1, respectively. Significant inter-annual variation in bottom-water PO43- levels (ANOVA, P< 0.01) was observed across 2019 (2.7 ± 0.3 μmoL L-1), 2020 (0.9 ± 0.6 μmoL L-1), and 2021 (0.3 ± 0.3 μmoL L-1), but not in bottom-water NOx, and NH4+. Bottom-water NOx was low for station S6.5 (88.3 ± 48.7 μmoL L-1), and high for station S11 (117.8 ± 14.9 μmoL L-1), bottom-water NH4+, and PO43- was high for station S6.5 (12.4 ± 10, and 1.3 ± 1.1 μmoL L-1), and low for station S11 (1.3± 0.5, and 0.1 ± 0.1 μmoL L-1), but only weak spatial variations were observed in bottom-water NH4+ levels (Kruskal–Wallis test, P = 0.053). After seawater intrusion, bottom-water NOx decreased from 108.4 to 68.3 μmoL L-1, while bottom-water NH4+ increased from 5.9 to 15.9 μmoL L-1 for station S6.5, although the seawater intrusion impact was not significant (ANOVA, P>0.05).
The surface sediment (0–10 cm) water content ranged from 21–41% (data not shown). The organic matter content was the highest in 2020 (3.1%), followed by 2019 (1.2%), and 2021 (0.9%) (Kruskal–Wallis test, P = 0.056). A weak spatial variation was observed in sediment organic matter (Kruskal–Wallis test, P = 0.053). The S6.5 site was rich in organic matter (1.9%), whereas the S11 site had low organic matter content (0.8%). After seawater intrusion in 2019 and 2020, organic matter content increased from 0.8% to 1.9% and from 1.1% to 3.4%, respectively, compared to levels before the dam opening (Table 1). The sediment was dominated by sand (grain size > 63 μmoL L-1), which accounted for 80% of the samples.
3.2 Depth profiles of water salinity and DO
After seawater intrusion, notable changes were observed in the bottom-water of the S6.5 station regarding salinity and DO, whereas changes were not evident in the surface and middle waters (Figure 2). Before the dam opening, bottom-water salinity remained below 0.4 PSU. However, during seawater intrusion in 2019, 2020, and 2021, salinity substantially increased, reaching levels as high as 4.5, 9.2, and 1.4 PSU, respectively (Table 2 and Figure 2).
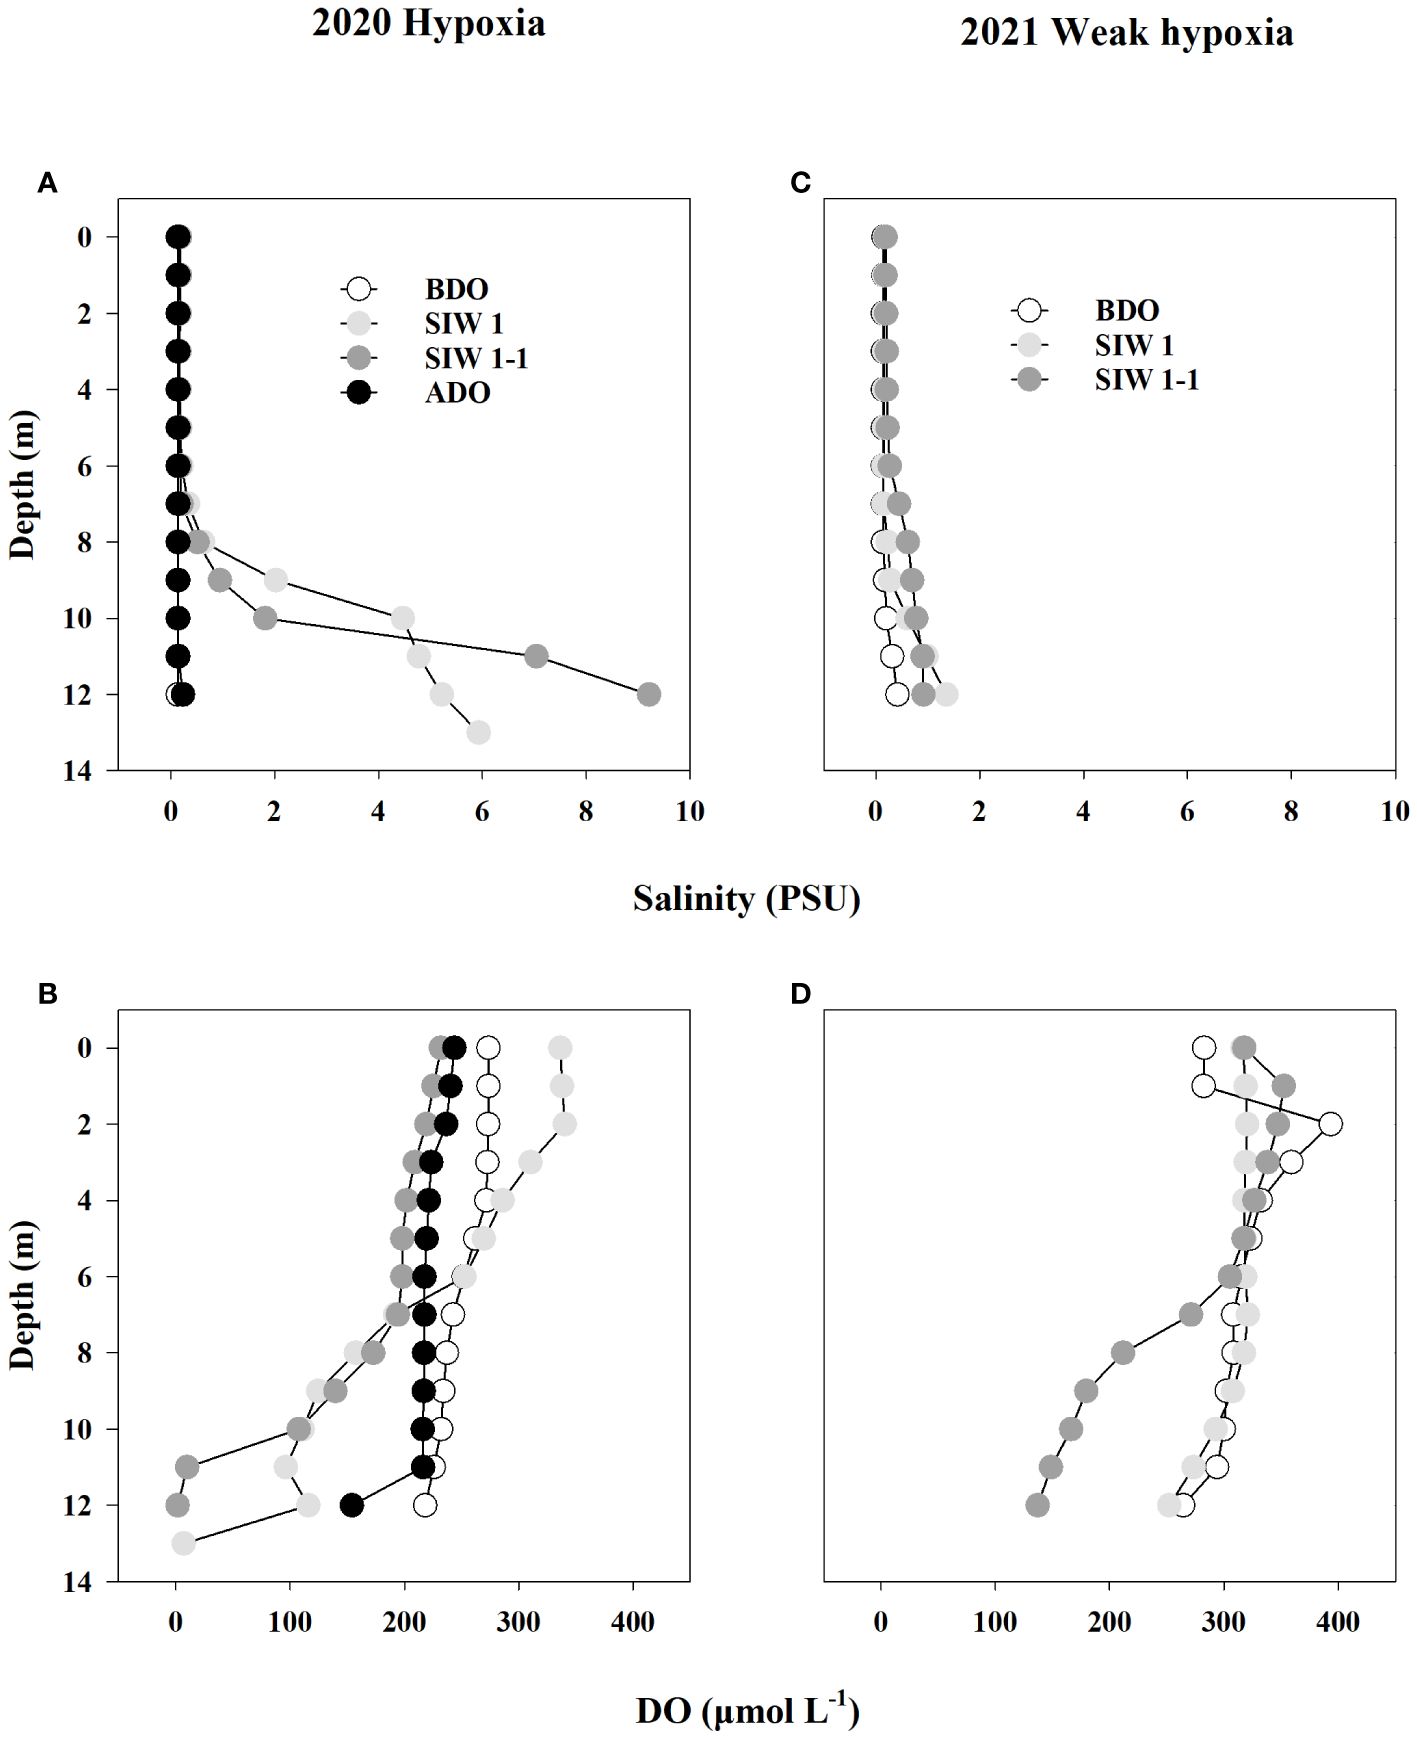
Figure 2 Salinity (A, B) and dissolved oxygen (DO, μmol L-1) (C, D) depth profiles for station S6.5 during various phases of seawater intrusion in 2020 (hypoxia) and 2021 (weak hypoxia). BDO (white circle), SIW 1 (light grey circle), SIW 1-1 (grey circle), ADO (black circle). BDO, before the dam opening; SIW 1, seawater intrusion during the first high tide of week 1; SIW 1-1, seawater intrusion during the first low tide of week 1; ADO, after the dam opening. The same abbreviations are used in Figures 3–6.
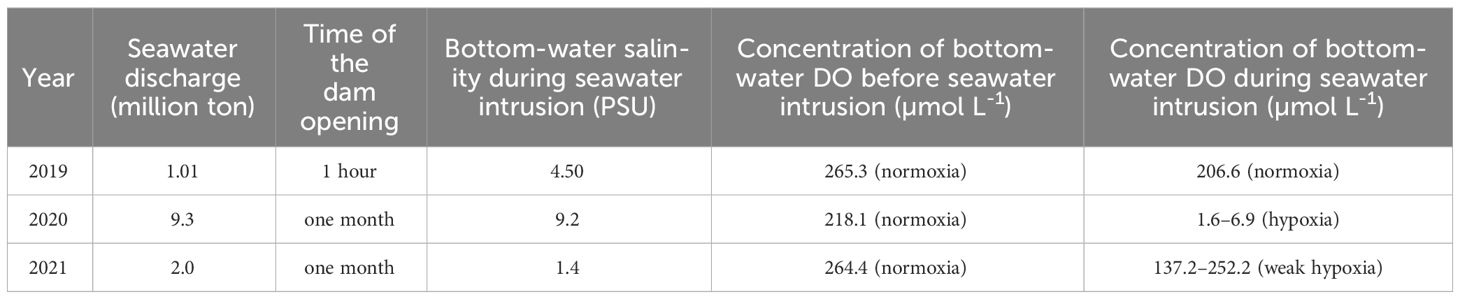
Table 2 Summary of seawater discharge, time of the dam opening, bottom-water salinity during seawater intrusion, and bottom-water DO before, and during sewater intrusion.
Bottom-water oxygen levels displayed normoxic conditions before the dam opening in 2019 (265.3 μmoL L-1), 2020 (218.1 μmoL L-1), and 2021 (264.4 μmoL L-1). However, during seawater intrusion, a significant decrease was observed, with oxygen levels dropping to 206.6 μmoL L-1 in 2019, 6.9 and 1.6 μmoL L-1 in 2020, and ranging between 252.2 and 137.2 μmoL L-1 in 2021, all during SIW 1 or SIW 1-1 (Table 2 and Figure 2). After seawater intrusion, bottom-water oxygen conditions varied among normoxia, hypoxia, and weak hypoxia in 2019, 2020, and 2021 (Table 2 and Figure 2).
3.3 Benthic SOD and actual rates of N production (P14), denitrification (den14) and anammox (aao14)
In the intact core incubation conducted in 2019, a slight increase in SOD was observed consistently before, during, and after the dam opening, with average values of 4.4 ± 0.4, 4.6 ± 1.0, and 6.9 ± 0.1 mmol O2 m-2 day-1, respectively (Figure 3A). Initially, the actual N2 production rates (P14) sharply decreased from 0.3 ± 0.1 mmol N m-2 day-1 before the dam opening to 0.02 ± 0.02 mmol N m-2 day-1 during seawater intrusion; however, they subsequently rebounded to 0.35 ± 0.19 mmol N m-2 day-1 after the dam opening (Figure 3B). Denitrification predominantly contributed to the actual nitrogen production rates, regardless of seawater intrusion. Both actual denitrification (den14) and anammox (aao14) rates displayed similar trends before, during, and after seawater intrusion, with average values of 0.22 ± 0.09, 0.01 ± 0.01, and 0.28 ± 0.15 mmol N m-2 day-1, respectively, for den14, and 0.07 ± 0.03, 0.01 ± 0.01, and 0.07 ± 0.04 mmol N m-2 day-1, respectively, for aao14 (Figure 3B). DNRA was not detected in freshwater at the S6.5 station before the dam opening. However, it significantly increased to 0.08 ± 0.00 mmol N m-2 day-1 during seawater intrusion and became negligible again after the dam opening (Figure 3B). The nitrate reduction process was dominated by denitrification both before and after the dam opening. Notably, DNRA emerged as the dominant nitrate reduction process during seawater intrusion (Figure 3B).
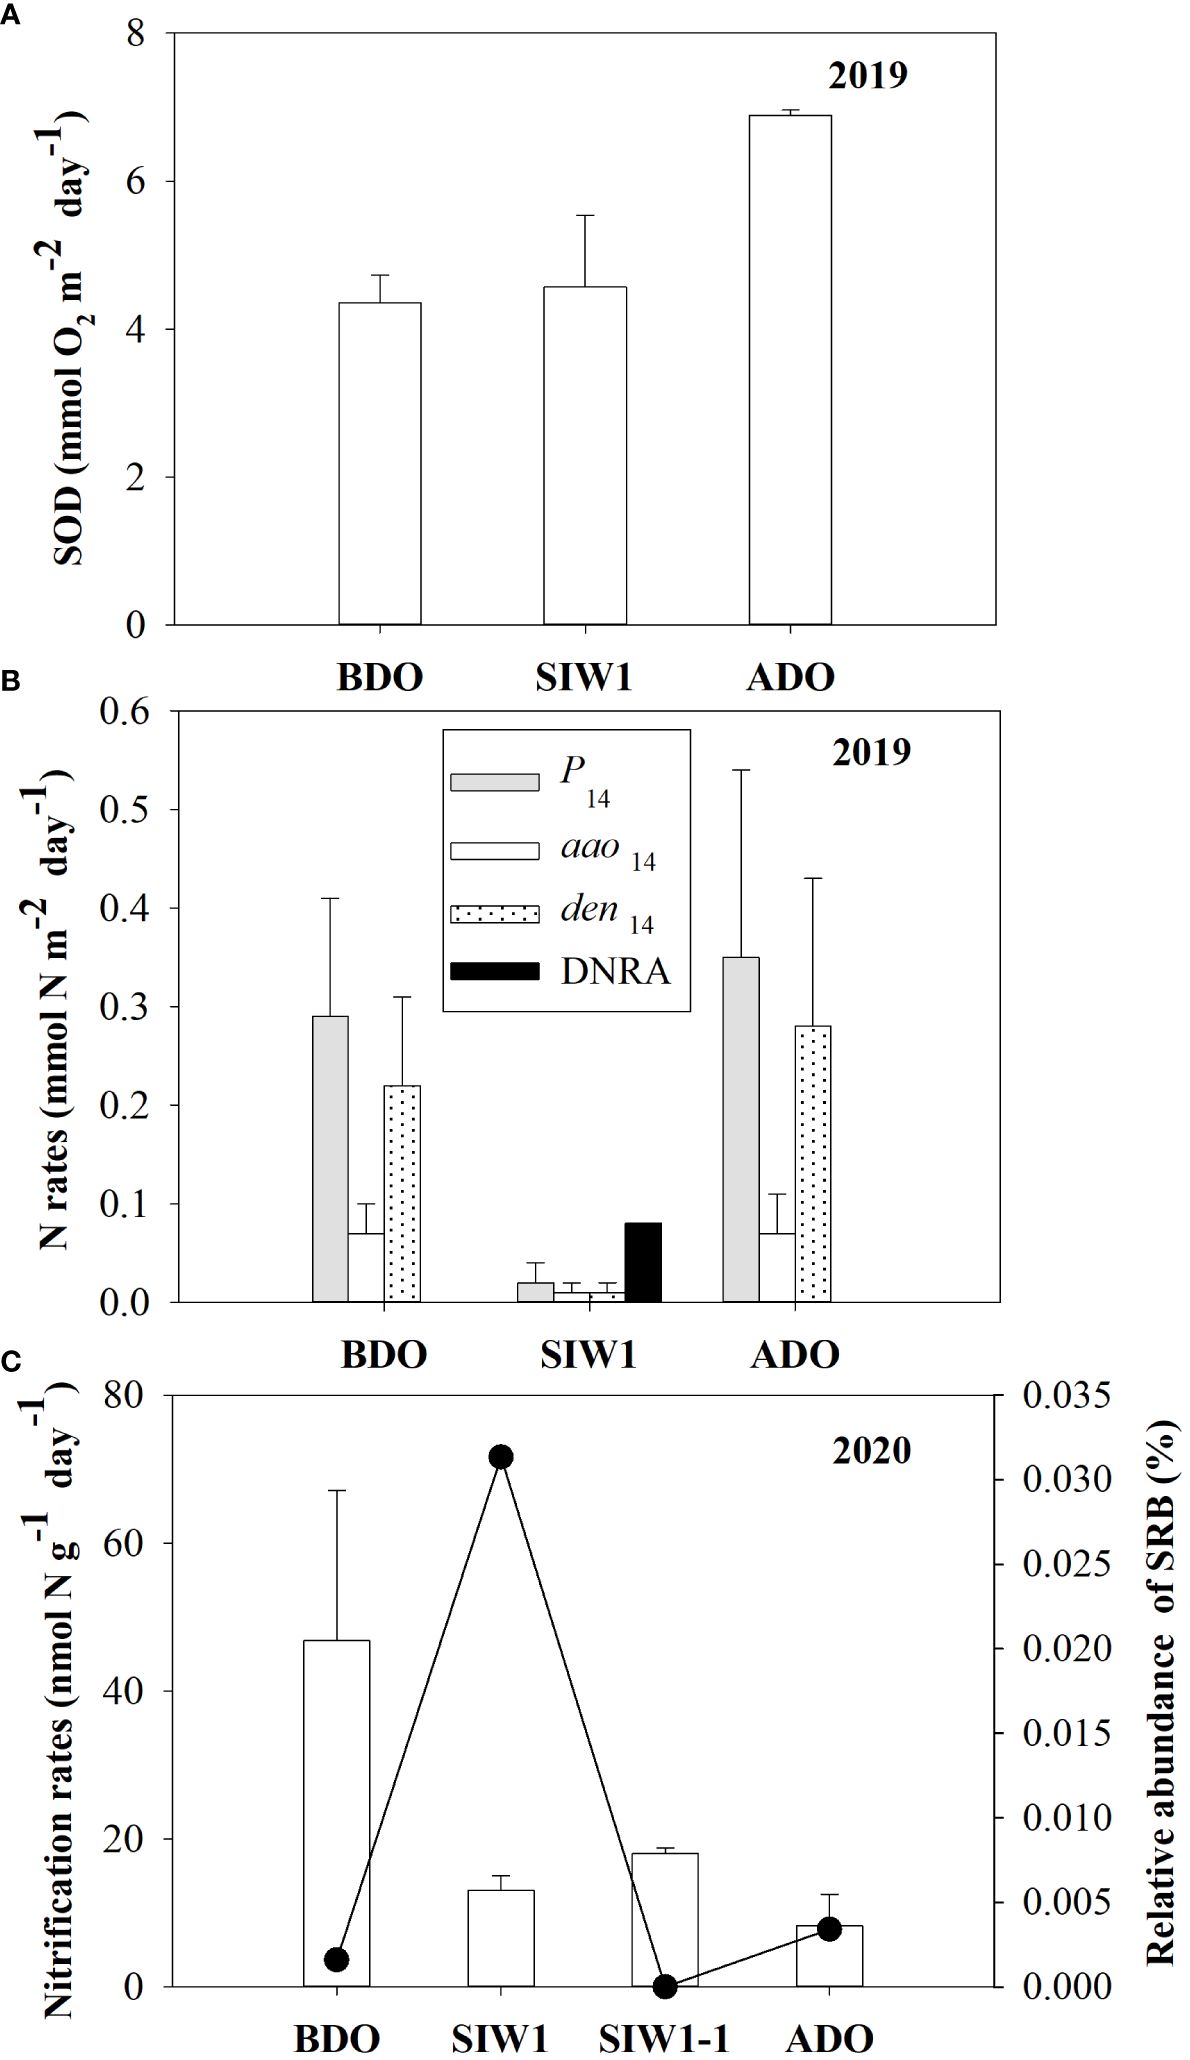
Figure 3 (A) Sediment oxygen demand (SOD, mmol O2 m-2 day -1) and (B) benthic nitrogen rates (mmol N m-2 day -1). Gray bars denote P14, white bars denote den14, dotted bars denote aao14, and black bars denote DNRA, from intact core incubations in 2019, in the order of BDO, SIW 1, and ADO. (C) Potential nitrification rates (left Y-axis, nmol N g-1day-1) in 2020 from slurry incubations and bottom-water relative abundance of sulfate-reducing bacteria (SRB) (right Y-axis, %) for station S6.5 during various phases of seawater intrusion in the order of BDO, SIW 1, SIW 1-1, and ADO. The error bars represent the standard deviation of measurements from duplicate samples in (A, B), or from three replicate samples in (C).
3.4 Potential nitrification, denitrification, anammox, and DNRA
After seawater intrusion, potential nitrification in the sediment decreased, ranging from 46.8 ± 20.3 nmol N g-1 day-1 before the dam opening to 15.5 ± 1.4 nmol N g-1 day-1 during seawater intrusion. Subsequently, the potential nitrification did not recover from seawater intrusion after the dam opening, remaining at 8.3 ± 4.2 nmol g-1 day-1 (Figure 3C).
The potential denitrification rate in sediment varied considerably, ranging from 10.6 ± 0.8 nmol N g-1 day-1 at S6.5 in 2019 after the dam opening to 925.2 ± 80.7 nmol N g-1 day-1 at S11 in 2021 before the dam opening (Figure 4A). Significantly different denitrification rates were observed across the years 2019–2021 (ANOVA, p = 0.027). Specifically, the denitrification rates showed a pattern with the highest rate in 2021 (501 ± 277.5 nmol N g-1 day-1), followed by a lower rate in 2020 (220.3 ± 69.6 nmol N g-1 day-1), and the lowest rate recorded in 2019 (57.2 ± 54.3 nmol N g-1 day-1). Weak spatial variations were also noted, ranging from 233 ± 181.6 nmol N g-1 day-1 at S6.5 to 613.9 ± 440.3 nmol N g-1 day-1 at S11 (ANOVA, p = 0.051). No significant impact of seawater intrusion on potential denitrification was observed, although the rates decreased marginally from 387.6 ± 365.9 nmol N g-1 day-1 before the dam opening to 303.8 ± 200.3 nmol N g-1 day-1 after seawater intrusion. Overall, denitrification accounted for 30–100% of total NO3- reduction, representing 76% at S6.5, 100% at S11, and 82%, 78%, and 81% before, during, and after the dam opening, respectively (Figure 5).
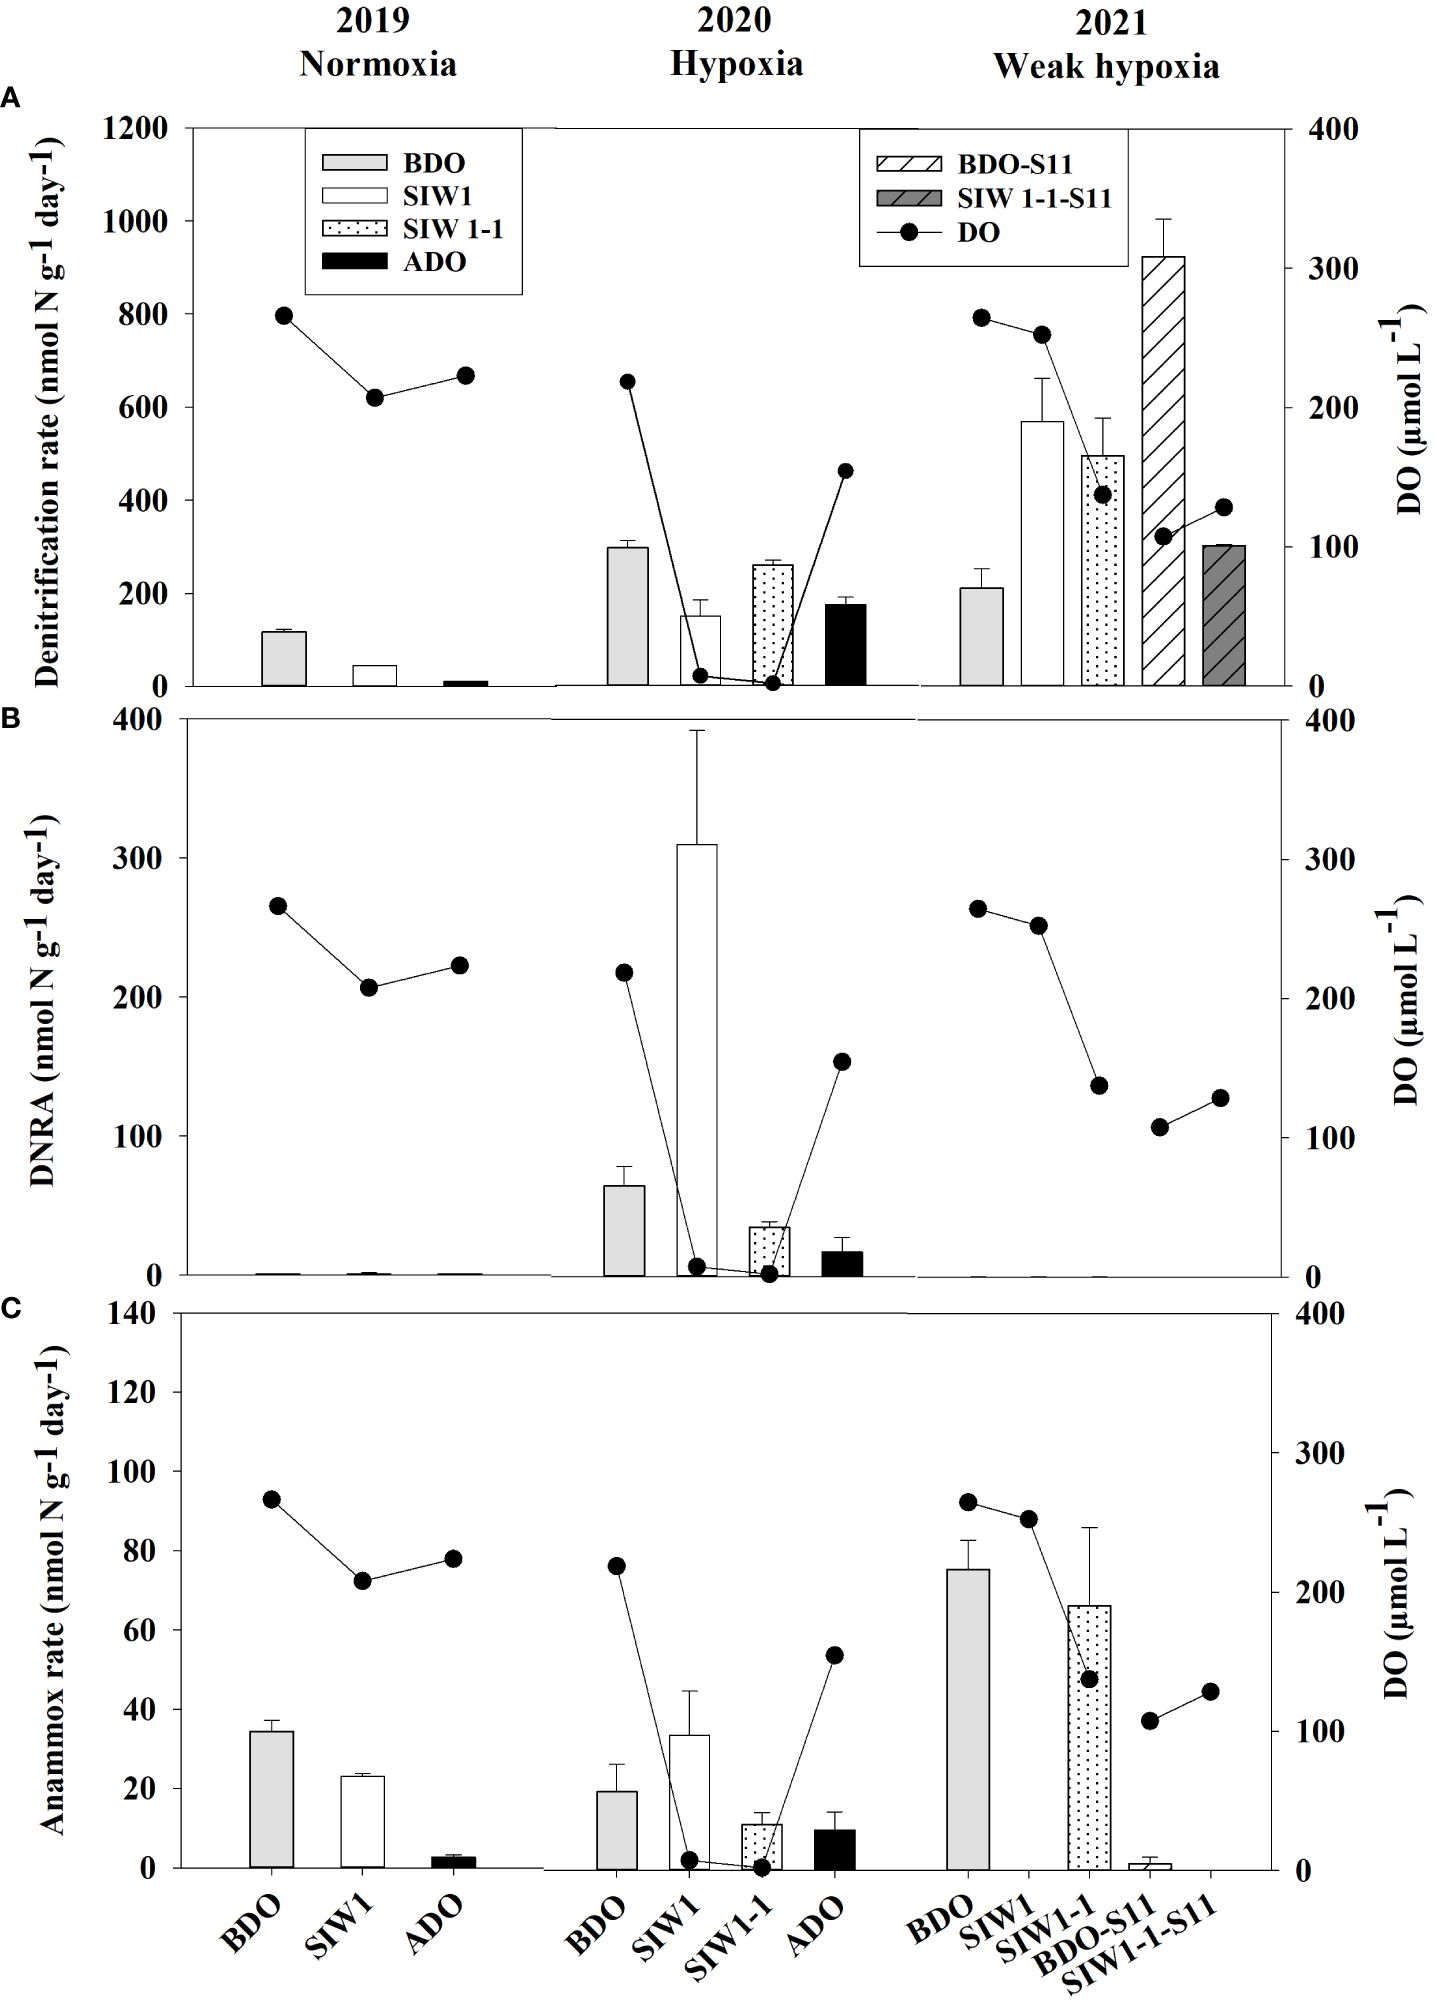
Figure 4 (A) Denitrification (nmol N g-1day-1), (B) DNRA (nmol N g-1day-1), and (C) anammox (nmol N g-1day-1) rates from slurry incubations in the order of 2019 (normoxia), 2020 (hypoxia), and 2021 (weak hypoxia), and bottom-water dissolved oxygen (DO, µmol L-1) at the represent time. BDO (light gray bars), SIW 1 (white bars), SIW 1-1 (dotted bars), and ADO (black bars) for station S6.5, and BDO-S11 (white shaded bars), SIW 1-1-S11 (gray shaded bars) for station S11. The error bars represent the standard deviation of potential denitrification, anammox, and DNRA determined from three independent sample measurements.
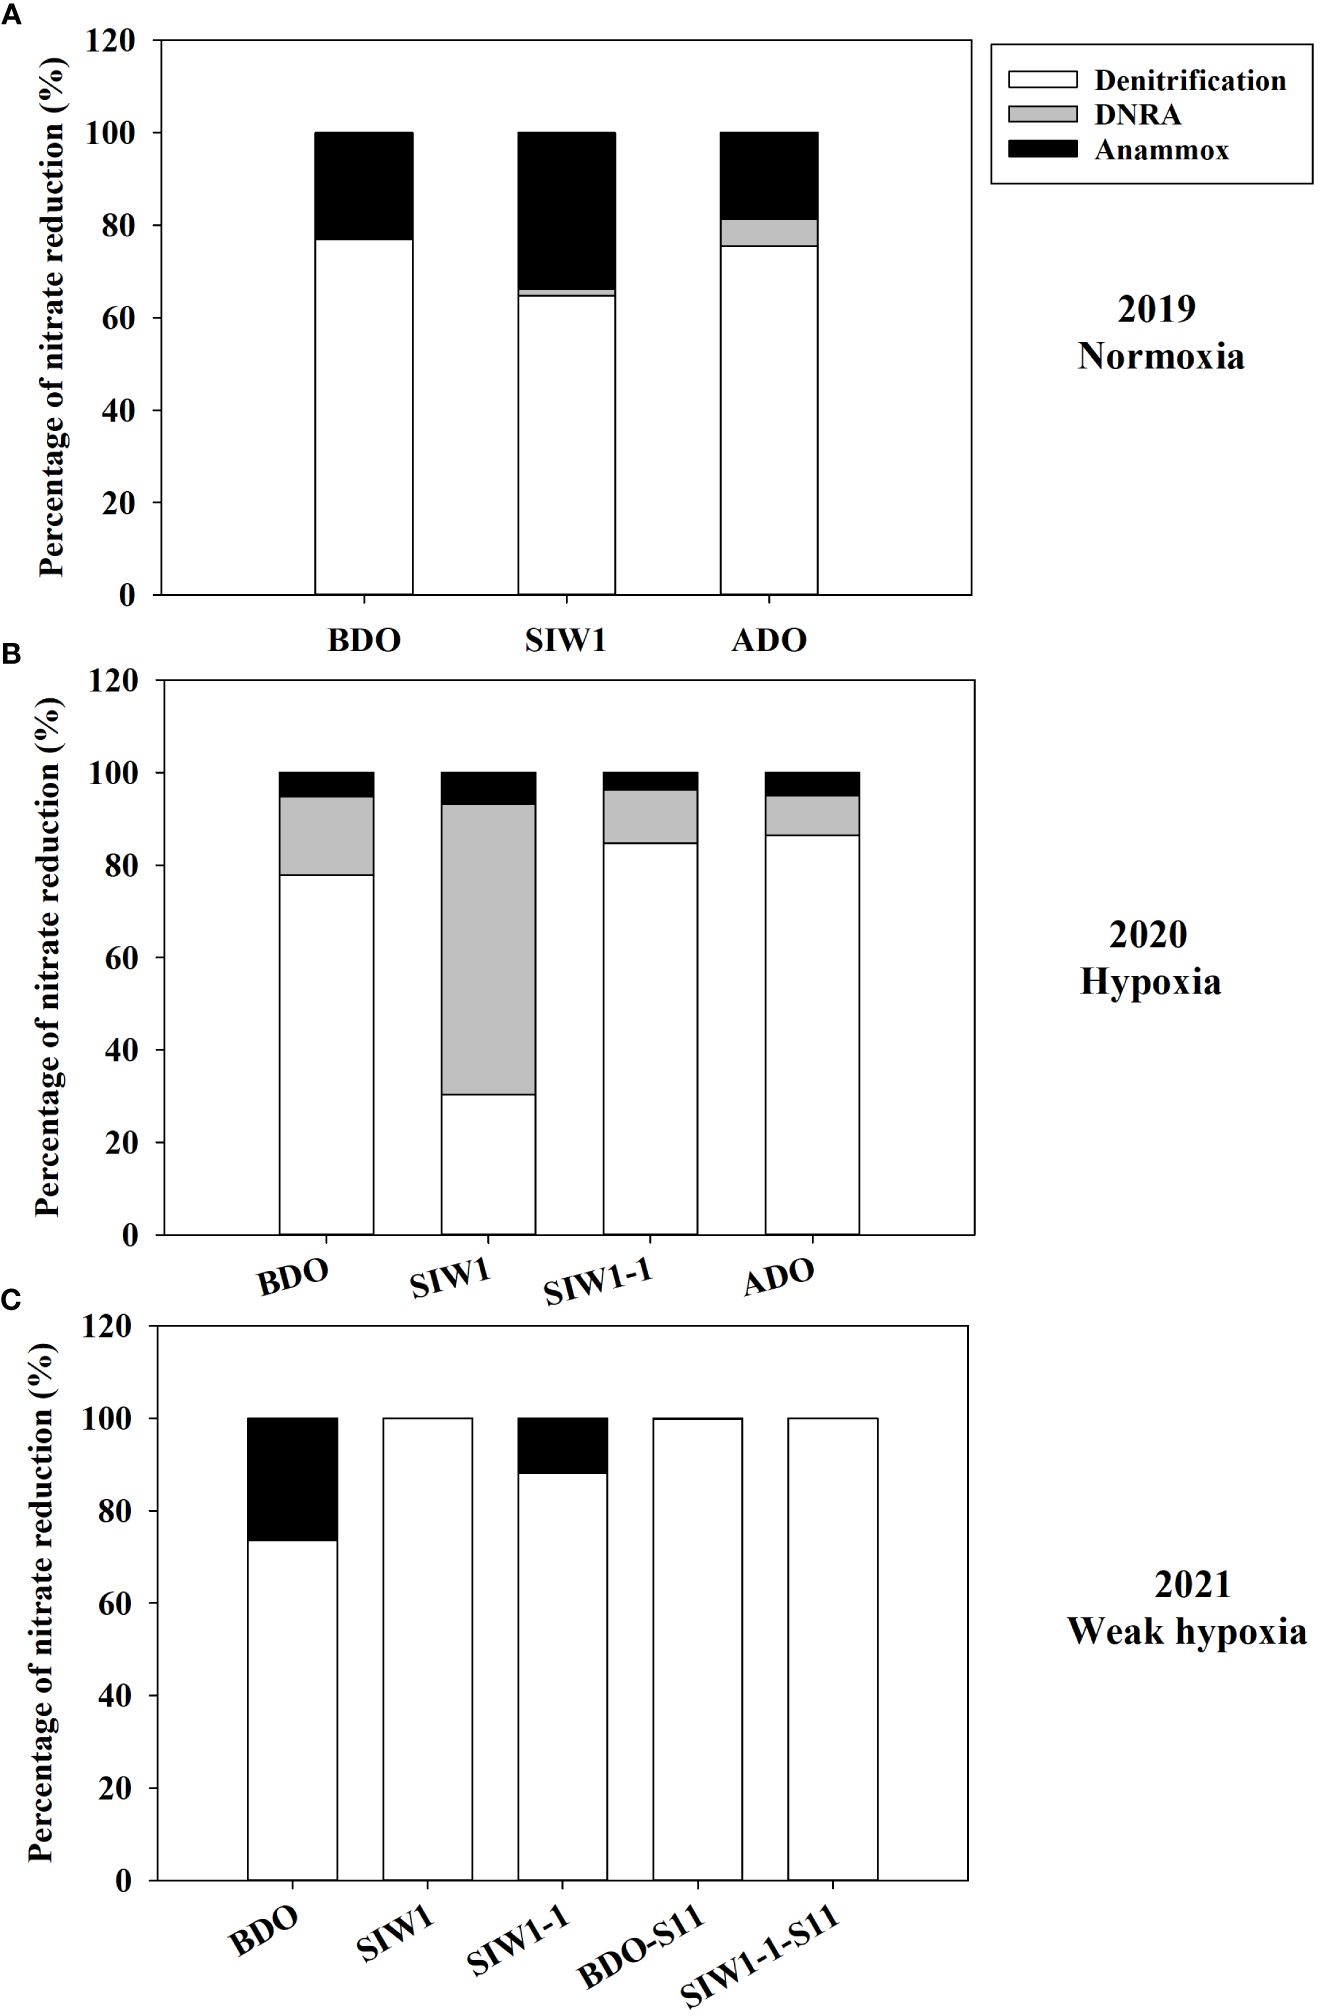
Figure 5 Respective contributions of denitrification (white bars), DNRA (gray bars), and anammox (black bars) to total nitrate reduction process in (A) 2019 (Normoxia), (B) 2020 (hypoxia), and (C) 2021 (weak hypoxia) during various phases of seawater intrusion BDO, SIW 1, SIW 1-1, and ADO for station S6.5 or BDO-S11, SIW 1-1-S11 for station S11.
In 2019 and 2020, denitrification decreased when bottom-water oxygen condition was normoxia and hypoxia, while it increased in 2021 when bottom-water oxygen was weak hypoxia (Figure 4A). The potential denitrification rates were 116.8 ± 5.7, 44.2 ± 0.4, and 10.6 ± 0.8 nmol N g-1 day-1 in 2019, and 297 ± 15.8, 150.1 ± 34.5, and 174 ± 16.9 nmol N g-1 day-1 in 2020, before, during, and after the dam opening, respectively (Figure 4A). The potential denitrification rates consistently responded to seawater intrusion in 2019 and 2020, during which time seawater intrusion significantly suppressed denitrification. The potential denitrification rate was enhanced after seawater intrusion in 2021 (211.2 ± 41, 569.8 ± 93.0, and 496 ± 81 nmol N g-1 day-1 before the dam opening, during SIW 1, and SIW 1-1, respectively; Figure 4A). Seawater intrusion reduced denitrification rates and its contribution to the total NO3- reduction process. Denitrification dominated the NO3- reduction process from 2019–2021, regardless of seawater intrusion, except in 2020 after seawater intrusion (Figure 5).
The potential for DNRA in the sediment was nearly undetectable in 2021. In 2020 peak rates occurred at 310.3 ± 82.1 nmol N g-1 day-1 after seawater intrusion, with an overall mean of 43.1 ± 96.3 nmol N g-1 day-1 (all measurements conducted at S6.5) (Figure 4B). Overall, after seawater intrusion, potential DNRA increased from 22 ± 37.4 nmol N g-1 day-1 to 69.4 ± 135.6 nmol g-1 day-1, subsequently declining to 9.1 ± 11.7 nmol N g-1 day-1 after the dam opening. Our overall study findings indicated that neither the spatial variation nor the seawater intrusion effect on DNRA was statistically significant. However, a significant inter-annual variation was observed in the potential DNRA activity from 2019–2021 (Kruskal–Wallis test, p = 0.018). Potential DNRA was the highest in 2020 (107 ± 137 nmol N g-1 day-1), low in 2019 (0.9 ± 0.2 nmol N g-1 day-1), and 2021 (0.1 ± 0.0 nmol N g-1 day-1). DNRA accounted for 0–63% of total NO3- reduction, accounting for 6%, 15%, and 7% before, during, and after seawater intrusion, respectively (Figure 5).
Potential DNRA rates increased in 2019 and 2020 under bottom-water normoxia and hypoxia in response to seawater intrusion (Figure 4B). However, DNRA exhibited a more pronounced increase in 2020 (65.2 ± 13.8 nmol N g-1 day-1 before the dam opening and 310.3 ± 82.1 nmol N g-1 day-1 after seawater intrusion) compared to the change from 0.7 ± 0.1 nmol N g-1 day-1 before the dam opening to 1.1 ± 0.5 nmol N g -1 day-1 after seawater intrusion in 2019 (Figure 4B). In 2021, DNRA was almost undetected (maintaining approximately 0.1 nmol N g-1 day-1 before, during, and after the dam opening), and little change was observed (Figure 4B). Seawater intrusion significantly enhanced the DNRA rates in 2020 and improved the contribution of DNRA to the total NO3- reduction process. DNRA did not dominate the NO3- reduction process, except in 2020, after seawater intrusion (63% of total NO3- reduction, Figure 5).
Potential anammox activity in the sediment samples was low relative to denitrification and DNRA, it ranged from 0 in 2021 both at S6.5 and S11 to 75.7 ± 7.3 nmol N g-1 day-1 at S6.5 in 2021 (Figure 4C). Station S6.5 exhibited higher potential anammox (27.7 ± 25.7 nmol N g-1 day-1) compared to station S11 (0.8 ± 1.2 nmol N g-1 day-1). The highest potential anammox was recorded in 2021 (28.8 ± 38.8 nmol N g-1 day-1), 2019 (20.0 ± 16.1 nmol N g-1 day-1), and 2020 (18.7 ± 10.9 nmol N g-1 day-1). However, no significant spatial or inter-annual variation was observed in potential anammox rates (Kruskal–Wallis test, p > 0.05). Overall, potential anammox activity decreased from 32.9 ± 31.6 nmol N g-1 day-1 before the dam opening to 22.5 ± 25.3 nmol N g-1 day-1 after seawater intrusion, and it continued to decrease after the dam opening (6.3 ± 5.2 nmol N g-1 day-1); however, no significant seawater impact was observed. Generally, after seawater intrusion, potential anammox decreased in both 2019 bottom-water normoxia and 2021 bottom-water weak hypoxia, however, it increased in 2020 under severe bottom-water hypoxia (Figure 4C). Anammox accounted for 13% at S6.5, 0.1% at S11, and 14%, 9%, and 12% before, during, and after seawater intrusion, respectively, of total NO3- reduction (Figure 5). Overall, anammox did not contribute significantly to total NO3- reduction, whereas seawater intrusion reduced the contribution of anammox to NO3- reduction (Figure 5).
3.5 Nitrification, denitrification, anammox, and DNRA gene abundance
Overall, the nitrification gene abundance ranged from 0.04–0.18 effective fragment count per kg (efpkg). An obvious inter-annual variation was observed in nitrification gene abundance (ANOVA, p = 0.005), with an average value of 0.16 ± 0.3, 0.12 ± 0.02, and 0.06 ± 0.02 efpkg in 2021, 2020, and 2019, respectively (Figure 6A). The nitrification gene (amoA) abundance increased numerically in 2019 under bottom-water normoxia, and little changed in 2020 under severe bottom-water hypoxia after seawater intrusion. The nitrification differed among before, during, and after the dam opening, but this change in the gene abundance was not statistically significant.
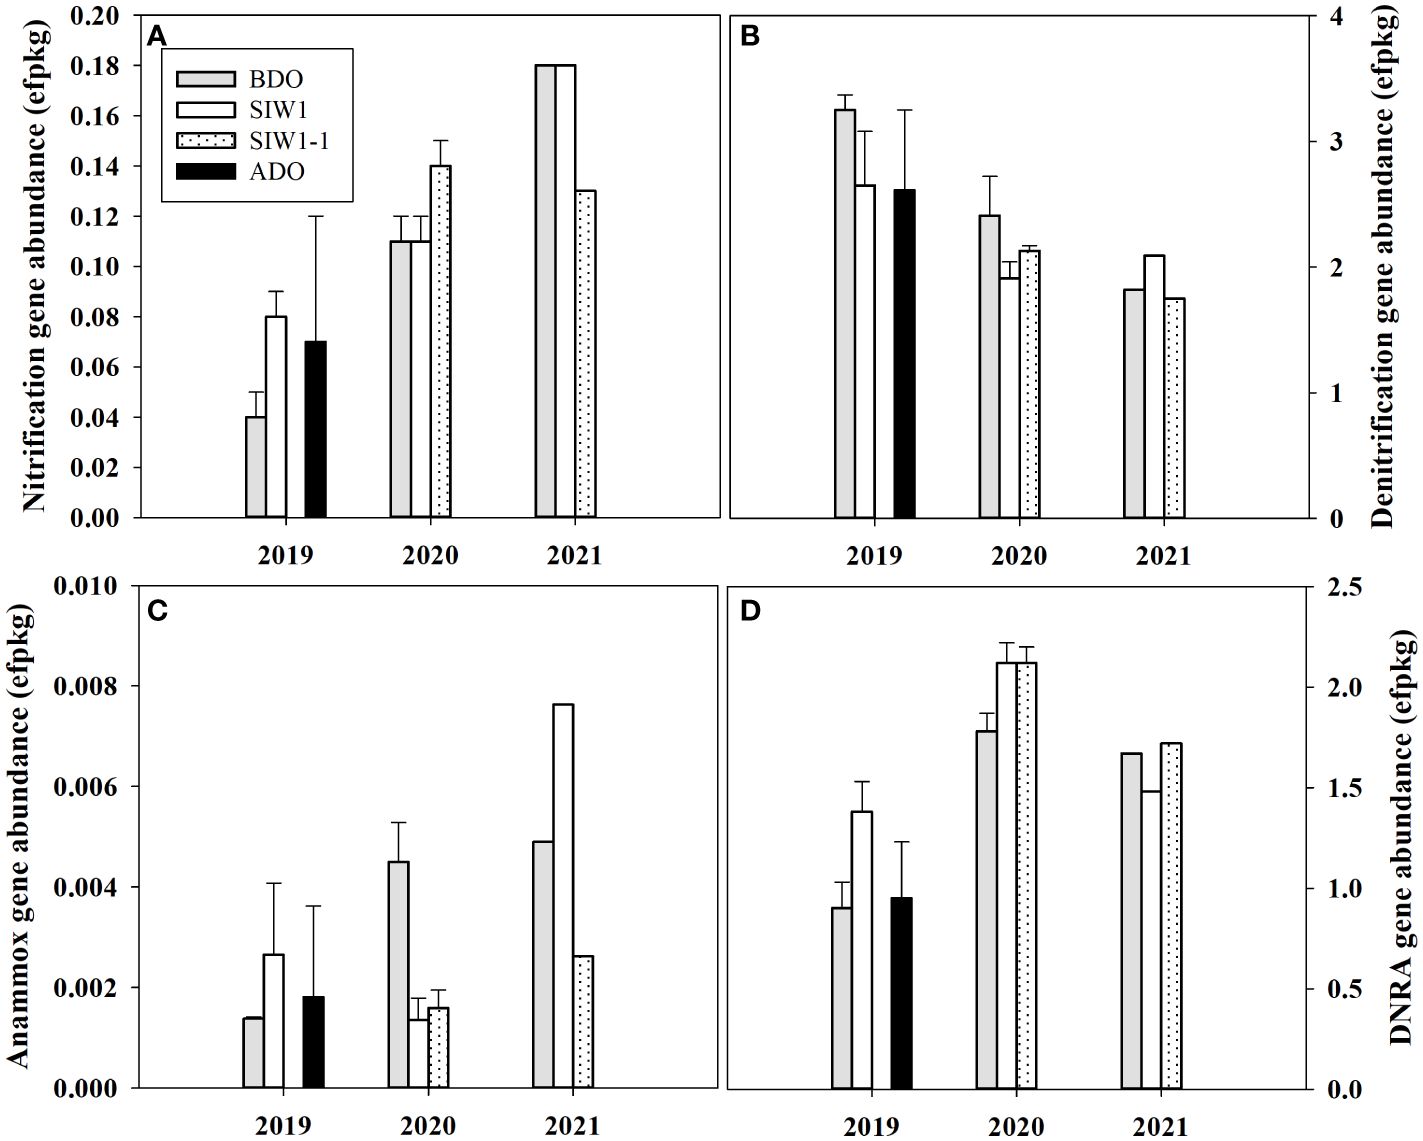
Figure 6 Gene abundance in the sediment communities for station S6.5 in 2019, 2020, and 2021. (A–D) denote nitrification, denitrification, anammox, and DNRA gene abundance variations during various phases of seawater intrusion in the order of BDO (gray bars), SIW 1 (white bars), SIW 1-1 (dotted bars), and ADO (black bars). The error bars represent the standard deviation of measurements from duplicate samples taken in 2019 and 2020. Only one measurement was taken in 2021.
The nitrogen reduction process was dominated by denitrification, as confirmed by the abundance of nitrogen cycling genes. The total abundance of denitrification (nirS and nirK), DNRA (nrfA), and anammox (hzo) gene ranged from 1.8–3.3, 0.9–2.1, 0–0.01 efpkg, respectively (Figures 6B-D). Significant inter-annual variations were found in DNRA gene abundance (ANOVA, p = 0.004), but not in denitrification nor anammox gene abundance (ANOVA, p > 0.1). The total gene abundance for denitrification was highest in 2019 (2.8 ± 0.4 efpkg), high in 2020 (2.1 ± 0.3 efpkg), and low in 2021 (1.9 ± 0.2 efpkg). The denitrification gene abundance both decreased in 2019 and 2020 and increased in 2021. Overall, this change in denitrification gene abundance is similar to the change in potential denitrification rates in the sediment slurry incubation. The DNRA gene abundance was highest in 2020 with an average value of 2.0 ± 0.2 efpkg similar to the highest potential DNRA rate in 2020 observed in sediment slurry incubation (Figures 4B, 6D). The total gene abundance for DNRA both increased in 2019 and 2020 after seawater intrusion, similar to the potential DNRA response found in sediment slurry incubation. The DNRA gene abundance did not differ much numerically in 2021 after seawater intrusion, at the same time, little change was observed in potential DNRA. The total anammox gene abundance was almost negligible when compared to denitrification and DNRA gene abundance. Generally, it increased both in 2019 and 2021 after seawater intrusion, but decreased in 2020, which differed from the potential anammox response observed in sediment slurry incubation.
3.6 Correlations between environmental parameters and benthic N transformation rates
Pearson’s correlation analysis revealed that the bottom-water DO was negatively correlated with bottom-water salinity (Table 3). A positive relationship was observed between bottom-water DO and Chl-a levels. Bottom-water NOX was positively correlated with bottom-water DO content, but negatively correlated with bottom-water salinity. Bottom-water NH4+ concentrations were positively correlated to bottom-water salinity; however, they were negatively correlated to bottom-water DO, and bottom-water NOX. No significant correlations were observed between bottom-water salinity and potential denitrification, anammox, or DNRA rates. However, potential sediment denitrification rates were negatively correlated with bottom-water PO43- concentrations and positively correlated with bottom-water Chl-a levels. Potential anammox activity in the sediment was not correlated with any bottom-water environmental parameters. Potential DNRA in the sediment was negatively correlated with bottom-water DO concentrations. Nitrification gene abundance in the sediment was negatively correlated with bottom-water PO43- concentrations, and positively related to denitrification. Denitrification gene abundance in the sediment was negatively correlated with nitrification gene abundance, and positively correlated with bottom-water PO43- concentrations. In contrast, DNRA gene abundance in the sediment was negatively correlated with bottom-water DO, and denitrification gene abundance. The abundance of the Anammox gene did not significantly correlate with any bottom-water environmental parameters or with the abundance of other nitrogen cycling genes in the sediment.
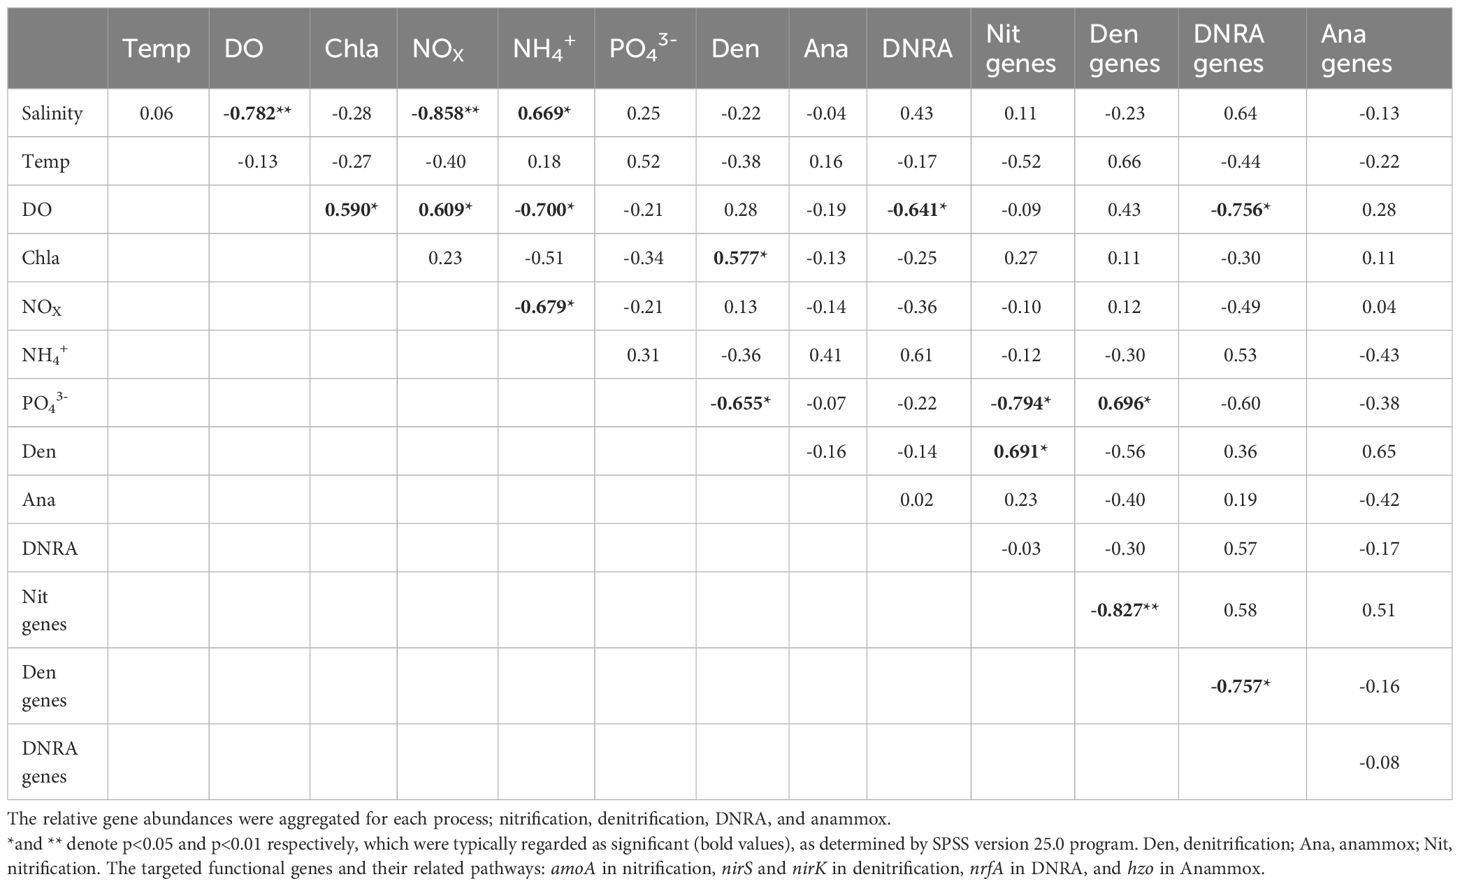
Table 3 Pearson’s correlation analyses coefficients for ambient bottom-water conditions, nitrogen transformation rates, and gene abundance from slurry incubation using Nakdong River Estuary sediments.
4 Discussion
4.1 Bottom-water oxygen differs due to the extent of seawater trapping after seawater intrusion
After the dam opening and seawater intrusion, there was an immediate and rapid increase in bottom-water salinity (Figure 2). At the S6.5 station, located upstream from the dam and deeper than S11, seawater accumulated and became trapped due to density disparities between seawater and freshwater (An, 2021). Consequently, the trapped bottom seawater restricted the exchange with the overlying freshwater, resulting in a decline in dissolved oxygen (DO) levels. Pearson correlation analyses conducted (Table 3) revealed a significantly negative correlation between bottom-water salinity and oxygen concentration (P=0.003). This correlation indicates that as salinity increased post-seawater intrusion, the DO concentration gradually decreased. For instance, in 2020, bottom-water DO levels dropped to 6.9 μmoL L-1 and 1.6 μmoL L-1 during SIW 1 and SIW 1-1, respectively, indicating substantial hypoxia in contrast to the levels before the dam opening (218.1 μmoL L-1). Jia et al. (2021) extensively discussed the effects of seawater intrusion on water density stratification in the Modaomen Estuary, China, highlighting frequent occurrences of bottom-water hypoxia linked to substantial water-column stratification due to the interplay of high freshwater discharge and saltwater intrusion. Additionally, Poirrier (2013) reported instances of bottom-water hypoxia and anoxia in Lake Pontchartrain, attributed to salinity stratification resulting from saltwater intrusion via the Mississippi River Gulf Outlet through the Inner Harbor Navigation Canal.
In addition to water stratification, an increase in sediment oxygen demand (SOD) for organic matter decomposition may also contribute to the oxygen decline following seawater intrusion. This was confirmed by our intact core incubation result conducted in 2019, SOD increased from 4.4 ± 0.4 before the dam opening to 4.6 ± 1.0 mmol O2 m-2 day-1 after seawater intrusion (Figure 3A). The increased SOD did not result in bottom-water hypoxia in 2019, we hypothesize this is because seawater trapping was negligible as the dam only keep open for 1 hour (Table 2). The degree of seawater trapping was dependent on the duration of the dam opening and subsequent seawater intrusion (An, 2021). After these intrusion events, bottom-water oxygen levels showed different states, ranging from normoxic to anoxic or weakly anoxic. Seawater trapping was severe in 2020, weak in 2021, and negligible in 2019. Consequently, bottom-water oxygen levels were anoxic or hypoxic in 2020, weakly hypoxic in 2021, and normal in 2019 (Table 2). These varying bottom-water oxygen conditions might impact benthic nitrogen cycling.
4.2 How seawater intrusion influences N transformations
4.2.1 Denitrification
Benthic sediment biogeochemistry incubations provided evidence that seawater intrusion significantly affects the processes associated with N cycling. We have observed that the denitrification rate at S11 was significantly higher at S6.5, and the spatial difference was quite pronounced (233 ± 181.6 nmol N g-1 day-1 at S6.5 and 613.9 ± 440.3 at S11 nmol N g-1 day-1, ANOVA, p = 0.051). This spatial difference can be attributed to seawater intrusion. Several studies have shown that denitrification is sensitive to fluctuating salinity in coastal zones (Seitzinger et al., 1991; Seo et al., 2008; Marks et al., 2016). In aerobic freshwater sediments, the majority of NH4+ generated from organic matter decomposition (approximately 80–100%) undergoes nitrification and denitrification processes, whereas in marine sediments, this proportion is only 40–60% (Seitzinger et al., 1991). Marks et al. (2016) reported that full salinity seawater introduction (35 ppt) significantly led to 73% potential denitrification suppression in fresh marsh soil and demonstrated denitrifying microbial consortia sensitivity to rapid shifts in salinity. Seo et al. (2008) found that sediment denitrification potential was highest under freshwater conditions (salinity close to 0‰) in the Mississippi River and seawater addition immediately inhibited sediment denitrification activity. Consistent with this, the highest denitrification rate (925.2 ± 80.7 nmol N g-1 day-1) was recorded at S11 in 2021, before the dam opening. In addition, denitrification contribution to the total NO3- reduction process was more significant at S11 (99.9%, freshwater site) when compared to that of S6.5 (75.8%) (Figure 5).
Both the intact sediment core and slurry incubations indicated that seawater intrusion reduced denitrification activity in 2019 and 2020. The actual denitrification rates (den14) were 0.22 ± 0.09, 0.01 ± 0.01, and 0.28 ± 0.15 mmol N m-2 day-1 before, during, and after the dam opening in 2019, respectively (Figure 3B). The potential denitrification rates were 116.8 ± 5.7, 44.2 ± 0.4, and 10.6 ± 0.8, and 297 ± 15.8, 150.1 ± 34.5, and 174 ± 16.9 nmol N g-1 day-1 in 2019 and 2020 before, during, and after the dam opening, respectively (Figure 4A). Actual and potential denitrification rates decreased in response to seawater intrusion in 2019 and 2020; however, these reductions were not significant. However, in 2021, potential denitrification rates increased in response to seawater intrusion. Potential denitrification rates in the sediment were 211.2 ± 41, 569.8 ± 93, and 496 ± 81 nmol N g-1 day-1 before the dam opening, during SIW 1, and SIW 1-1, respectively (Figure 4A).
Denitrification activity was either suppressed (in 2019 and 2020) or enhanced (in 2021) in response to seawater intrusion, which was attributed to the different extents of bottom-water oxygen conditions caused by varying degrees of seawater-trapping. Oxygen content is a crucial regulatory factor in denitrification (Rivett et al., 2008). Denitrification is the primary process responsible for NO3- reduction in estuarine and coastal environments. Owing to the widespread presence of denitrifying bacteria underground, the critical limiting factors are reduced concentrations and electron donor availability (Rivett et al., 2008). The effect of oxygen concentration on denitrification activity was also demonstrated by the positive correlation between denitrification gene abundance and bottom-water DO in our study (Table 3). In 2019, minimal seawater-trapping was observed and the bottom-water remained normoxic; however, altered salinity was observed (causing a shift from denitrification to DNRA) (Giblin et al., 2010). Under severe seawater-trapping in 2020, bottom-water hypoxia was observed, and denitrification decreased significantly. We speculated that this decrease in denitrification was due to a reduction in nitrification activity. The potential nitrification rates were 46.8 ± 20.3, 15.5 ± 1.4, and 8.3 ± 4.2 nmol N g-1 day-1 before, during, and after the dam opening, respectively (Figure 3C). Correspondingly, potential denitrification rates in the sediment were 297 ± 15.8, 205 ± 22.5, and 174 ± 16.9 nmol N g-1 day-1, respectively (Figure 4A). Under severe hypoxia, both nitrification and denitrification decreased in response to seawater intrusion in 2020. Nitrification, an aerobic process in the sediment’s upper layer, regulates denitrification in estuarine and coastal sediments by providing the necessary substrate (NO3−) (Hansen et al., 1981). Hypoxia inhibits nitrification, leading to a decrease in the coupled denitrification rate. The positive correlation between denitrification and the abundance of nitrification genes indicates that denitrification is tightly correlated with nitrification and is regulated by nitrifying bacteria (Table 3). In 2021, when seawater-trapping was weak, weak hypoxia supported enhanced nitrification-coupled denitrification. Weak hypoxia provides ideal conditions for nitrifying and denitrifying bacterial growth, and denitrification was enhanced under weak hypoxia in Jinhae Bay (Huang and An, 2022).
Numerous studies have documented decreased denitrification activity from seawater intrusion in field (Giblin et al., 2010) and laboratory (Seo et al., 2008; Osborne et al., 2015) experiments. Rysgaard et al. (1999) reported clear evidence of the salinity inhibitory effect on both nitrification and denitrification. Osborne et al. (2015) reported that prolonged exposure to high salinity in Piermont Marsh increased sulfide retention. High sulfide concentrations can potentially reduce denitrification activity by inhibiting both denitrifying and nitrifying bacteria. Our research indicates a strong increase in the relative abundance of bottom-water sulfate-reducing bacteria (SRB) following seawater intrusion in 2020 (Figure 3C). This increase, observed in the hypoxic conditions after seawater intrusion in 2020, suggests increased availability of sulfide, which may have inhibited nitrification-coupled denitrification. The nitrification activity showed the opposite trend to SRB abundance (Figure 3C). We hypothesized that the decreased denitrification rates in 2020 resulted from the suppressed nitrification-coupled denitrification activity under hypoxic/anoxic and high-sulfide conditions when seawater-trapping was severe. Research indicates that NO3- availability as a denitrification substrate influences the denitrification rate (Luo et al., 1999). High NO3- availability can stimulate denitrification (Luo et al., 1999). However, we did not find a significant correlation between the bottom-water NO3- concentrations and denitrification rates (Table 3). This suggests that NO3- availability in the Nakdong River does not limit denitrification activity regardless of seawater intrusion. Although opening of the dam resulted in a decrease in the NOx concentration in both 2019 and 2020 (Table 2), this was unlikely to suppress denitrification activity.
Our results demonstrated that changes in denitrification activity corresponded to variations in denitrification gene abundance in both 2019 and 2020. The decrease in denitrification rate corresponded to a decrease in total denitrifying bacterial abundance (Figures 4A, 6B). In 2021, the elevated denitrification activity after seawater intrusion was consistent with denitrifying bacterial abundance (Figures 4A, 6B). Neubauer et al. (2019) found that the reduction of denitrification rates occurred after soils were exposed to elevated salinities, leading to shifts in the denitrifying bacterial community. Our study in the Nakdong River Estuary yielded similar results in 2019 and 2020 showing consistency between changes in denitrification rates and denitrification gene abundance. This consistency suggests that the expansion or contraction of the denitrifying bacterial community might directly influence the denitrification rate, possibly independent of changes in denitrifying bacterial activity (Neubauer et al., 2019).
4.2.2 DNRA
Several studies have reported high DNRA rates relative to denitrification or maximum DNRA values in response to elevated- or high-salinity conditions (An and Gardner, 2002; Laverman et al., 2007; Giblin et al., 2010). Laverman et al. (2007) observed enhanced DNRA rates when the bottom-water salinity increased in coastal freshwater sediments at Haringvliet Lake, The Netherlands. Giblin et al. (2010) investigated salinity gradient effects on N cycling in Parker River Estuary oligohaline estuarine sediments. They observed that the DNRA rate was 0.1 mmol m−2 d −1 at low salinity, whereas it increased to 2 mmol m−2 d −1 at high salinity. Previous studies have indicated that high salinity can significantly enhance DNRA activity. Santoro (2010) suggested that seawater intrusion alters the microbial community composition of all functional groups involved in N cycling and may lead to increases in DNRA and coupled denitrification/nitrification. In Nakdong River Estuary, DNRA peaked at 310.3 ± 82.1 nmol N g-1 day-1 at S6.5 (mean value 43.1 ± 96.3 nmol N g-1 day-1) when salinity increased to 6 PSU in 2020 (Figure 4A), which is higher than the DNRA observed at the freshwater site (S11, 5.0 ± 3.4 nmol N g-1 day-1, data not shown, measurement in 2022). Although statistically insignificant owing to the limited measurements at the freshwater site, our results indicate that seawater intrusion can significantly enhance potential benthic DNRA activity in sediments.
As observed in the denitrification measurement, the degree of seawater-trapping was important for the redox conditions, which in turn regulated anaerobic processes, including DNRA (Jäntti et al., 2021). We observed a significantly negative correlation (P< 0.05) between the potential DNRA rates (as well as the nrfA gene abundance) in the sediments and the bottom-water DO (Table 3). This indicates that DNRA is activated under hypoxic conditions. In 2019, with little seawater-trapping, potential DNRA increased slightly (0.7–1.1 nmol g-1 day-1) under normoxic conditions. We speculate that this mild increase was a shift from denitrification to DNRA under elevated salinity (An and Gardner, 2002; Giblin et al., 2010). In 2020, DNRA increased substantially (from 65.2 ± 13.8 to 310.3 ± 82.1 nmol N g-1 day-1) under severe bottom-water hypoxic conditions. Seawater-trapping was most severe in 2020, and bottom-water hypoxic/anoxic conditions provided a favorable environment for DNRA. In Changjiang Estuary, Song et al. (2020) found that actual DNRA increased from 0.02–0.1 mmol N m-2 day-1 when ambient bottom-water oxygen decreased from 193–100 µmol L-1. Furthermore, both the DNRA rate and the DNRA contribution to total NO3- reduction increased under severe hypoxia. Caffrey et al. (2019) observed a significant increase in potential DNRA in sediments after a short exposure to anoxic conditions in the shallow Roskilde Fjord Estuary in Denmark. Jäntti and Hietanen (2012) found that DNRA dominated NO3- reduction in low oxygen conditions (O2< 110 μmol L-1) in the Baltic Sea.
Organic matter content, although not statistically significant according to ANOVA analysis due to the small sample size (P=0.09), exhibited higher levels in 2020 (ranging from 1.1% to 6.3%, with an average value of 3.1%) compared to 2019 (ranging from 0.8% to 1.9%, with an average value of 1.2%) and 2021 (ranging from 0.9% to 1.0%, with an average value of 0.9%). Deng et al. (2015) reported a significant relationship (p<0.0001) between potential DNRA rates in sediment and organic matter in the Chanjiang Estuary. The correlation between DNRA rates and organic matter potentially results from organic matter serving as a structural support for DNRA bacteria, while also acting as a substrate to provide electrons for NO3- reduction (Ståhl and Davidsson, 2000; Burgin and Hamilton, 2007). Nizzoli et al. (2006) found a DNRA predominance over denitrification in sediments below the mussel ropes, where 94% of NO3- was reduced to NH4+ at a mussel farm site during summer. DNRA is favored in organically enriched sediments, particularly in metabolically active sediments with high labile organic carbon to NO3- (electron donor:electron acceptor) ratios (Tiedje, 1988).
Although we did not directly measure the hydrogen sulfide concentration in the sediments or bottom -water, an increase in sulfide concentration under hypoxia and abundant organic matter is inevitable. The increase in the relative abundance of bottom-water sulfate-reducing bacteria (SRB) following seawater intrusion in 2020 also indicates a rise in sulfide concentration (Figure 3C). Considering hypoxia and sulfide concentrations increasing in conjunction with salinity, sulfide concentrations in coastal marine sediments are typically higher than those in freshwater sediments. Pressurized (chronic) seawater can directly enhance sulfate concentration in pore water (Herbert et al., 2018). Seawater intrusion-induced bottom-water hypoxia and sediment organic matter enrichment may increase sulfate reduction, leading to sulfide accumulation (Murphy et al., 2020). DNRA activity enhancement by sulfide has been confirmed in previous field and laboratory experiments (Joye and Hollibaugh, 1995; An and Gardner, 2002; Caffrey et al., 2019; Murphy et al., 2020). A laboratory experiment conducted by Caffrey et al. (2019) demonstrated that potential DNRA under a high-sulfide treatment was significantly higher than that under all oxygen treatments, which were almost zero. Murphy et al. (2020) reported that sulfide significantly shifted DNRA and denitrification relative contributions to total NO3- reduction, ultimately favoring bioavailable N retention in the form of NH4+ over N loss through N2 production. They found that while the total bacterial community was not strongly affected by the presence of sulfide, sulfide promoted greater activity in a more diverse bacterial community (Murphy et al., 2020). DNRA bacteria appear to depend on sulfide for NO3- reduction; generally, sulfide serves as a potential electron donor and increases DNRA rates via denitrification inhibition in sediments (Myers, 1972). Consistent with these studies, a notable increase in the DNRA rates was observed under severe bottom-water hypoxia/high sulfide concentrations after seawater intrusion in 2020. In addition, research has suggested that DNRA has a competitive advantage over denitrification at low NO3- concentrations. The NO3- concentration in the bottom-water after seawater intrusion exhibited the greatest decline in 2020 (35 versus 142 µmol L-1) when compared to that in both 2019 (30 versus 85 µmol L-1) and 2021 (91 versus 99 µmol L-1). Therefore, the high DNRA activity in 2020 appears to be a result of high-sulfide environments (bottom-water hypoxia/annoxia) when labile carbon concentrations are high and NO3- availability is limited (Tiedje, 1988; Burgin and Hamilton, 2007). Seawater-trapping was weak in 2021, and there was almost no change in DNRA under weak hypoxia (maintained approximately 0.1 nmol g-1 day-1 before, during and, after the dam opening). A study in Jinhae Bay showed that weak hypoxia favored denitrification over DNRA (Huang and An, 2022).
Overall, potential DNRA rate changes were consistent with variations in total DNRA-related gene abundance, which increased in 2019 and 2020 and slightly changed in 2021 after seawater intrusion (Figures 4B, 6D). Significant annual differences were observed in potential DNRA; high in 2020 (107 ± 137 nmol g-1 day-1), low in 2019 (0.9 ± 0.2 nmol g-1 day-1), and lowest in 2021 (0.1 ± 0 nmol N g-1 day-1). Consistently, overall DNRA-related gene abundance (nrfA gene) was higher in 2020 than in 2021 or 2019. Neubauer et al. (2019) studied seawater intrusion effects on N cycling in tidal freshwater marsh sediments. Following seawater intrusion, the authors observed a significant increase in DNRA gene abundance (particularly nrfA), suggesting enhanced DNRA activity. Researchers have proposed that seawater intrusion can affect the microbial community responsible for DNRA, leading to increases in associated gene abundance and alterations in microbial community composition. Total DNRA-related gene abundance (nrfA gene) was higher after seawater intrusion in both 2019 and 2020 (Figure 6D), which is consistent with Neubauer et al. (2019).
4.2.3 Nutrient dynamics
After the dam opening, NOX concentrations in the bottom-water decreased especially in 2020. Overall, a strong inverse correlation was observed between bottom-water NOX and salinity (Table 3). Marks et al. (2016) also reported a reverse correlation and attributed the decrease in NO3- concentration to increased denitrification induced by increased salinity. However, denitrification was not enhanced in this study. The reduced nitrification rate may have been responsible for the decrease in bottom-water NOx in 2020. The change in total nitrifying bacterial abundance was consistent with the change in nitrification activity (Figures 3C, 6A). Nitrification is an oxygen-dependent process in which oxygen concentration plays a crucial regulatory role (Stenstrom and Poduska, 1980). Nitrifying bacteria are highly sensitive to decreased oxygen levels following seawater intrusion, and hypoxia can lead to a significant reduction in the nitrification rate. The DNRA increased significantly in 2020 after seawater intrusion. Combined with inhibited nitrification, the enhanced DNRA may be responsible for decreased NOx. Xie et al. (2020) identified a strong inverse correlation between salinity and NO3- levels in the Minjiang River and attributed this decrease to enhanced DNRA activity.
Bottom-water NH4+ increased after seawater intrusion (Kruskal–Wallis test, P = 0.041) (Table 3). The variation in NH4+ was also attributed to inhibited nitrification and elevated DNRA and SOD levels under high trapping conditions. Nitrification consumes NH4+, whereas DNRA produces NH4+. The reduced nitrification activity and significantly enhanced DNRA activity under anaerobic conditions led to decreased NH4+ consumption and increased NH4+ production, which is consistent with the observed increase in bottom-water NH4+ concentration. Intact core incubation in 2019 revealed an increase in SOD following seawater intrusion, indicating an accelerated organic matter mineralization rate (Figure 3A). We also observed an increase in sedimentary organic matter content after seawater intrusion, which was consistent with increased SOD. Increased organic matter decomposition released NH4+ into the water-column, promoting an increase in the NH4+ concentration in the bottom-water. Seawater pulses lead to ammonia release from estuarine sediments (Seitzinger et al., 1991; Rysgaard et al., 1999; Weston et al., 2010; Jun et al., 2013). Seawater intrusion can alter soil physicochemical properties and stimulate NH4+ exchange as well as organic matter mineralization in sediments (Scott and Binkley, 1997). Weston et al. (2011) reported that seawater intrusion into tidal freshwater marshes led to elevated organic matter decomposition rates via sulfate reduction.
In general, the decreased NOX concentration and increased NH4+ concentrations observed at S6.5 are consistent with the activated DNRA and SOD, inhibited nitrification and denitrification, enriched organic matter, and bottom-water hypoxic conditions when seawater-trapping was high in 2020. However, we cannot rule out the possibility that the changes in nutrient dynamics after seawater intrusion were due to sea- and freshwater mixing. Wang et al. (2017) reported a strong inverse correlation between salinity and NOx when performing real-time monitoring in the Changjiang Estuary. This negative correlation was attributed to temporal and spatial variations in N speciation.
5 Conclusions
The Nakdong River Estuary underwent experimental seawater intrusions from 2019–2021. Bottom-water salinity increased significantly, whereas bottom DO decreased after seawater intrusion, indicating that seawater was trapped in the bottom layer at deeper stations (S6.5). The varying seawater intrusion quantities and different gate operational methods in 2019, 2020, and 2021 may explain the differences in the extent of seawater-trapping. Seawater-trapping was severe in 2020, weak in 2021, and negligible in 2019. Correspondingly, the bottom-water oxygen levels were anoxic or hypoxic in 2020, weakly hypoxic in 2021, and normal in 2019.
After seawater intrusion, the potential denitrification in the sediment decreased in 2019 and 2020 but increased in 2021. Conversely, the potential DNRA in the sediment increased in 2019 and 2020, whereas no change was observed in 2021. The increase in denitrification in 2019 was a shift from denitrification to DNRA under elevated salinity and normoxic bottom-water conditions. Meanwhile, a slight increase was observed in the potential DNRA in 2019. In 2020, both denitrification and nitrification decreased and bottom-water hypoxia inhibited denitrification by inhibiting coupled nitrification and denitrification. The strong increase in potential DNRA activity in 2020 may be a result of high-sulfide environments (bottom-water hypoxia/annoxia) when the organic matter content is high and NOx availability is limited under severe seawater-trapping. In 2021, when seawater-trapping was weak, weakly hypoxic bottom-water conditions supported enhanced coupled nitrification and denitrification but not DNRA. Overall, denitrification was dominant in the NO3-reduction process, except in 2020 after seawater intrusion under bottom-water hypoxic and severe seawater-trapping conditions. At this time, the DNRA dominated. However, although DNRA dominated during this time, it was mostly negligible during other times. The seawater intrusion effect on N transformation was temporary; it quickly reset after opening the dam. In coastal zones, the degree of seawater-trapping, which is a result of bottom morphology, appears to determine the seawater intrusion effect on N transformation. The impact of seawater intrusion on environments related to nitrogen (N) cycling depends on the degree of seawater-trapping (geometry). When seawater trapping is high, N is preserved, potentially increasing eutrophication; conversely, when seawater trapping is low, N is lost through denitrification. To observe the long-term seawater intrusion effects on N transformations after the dam opening, it is essential to conduct extended monitoring for a 10-year period or even over several decades.
Data availability statement
The original contributions presented in the study are included in the article/supplementary material. Further inquiries can be directed to the corresponding author.
Author contributions
YH: Software, Writing – original draft, Writing – review & editing, Methodology. BS: Writing – review & editing, Methodology. QZ: Software, Writing – review & editing. YP: Software, Writing – review & editing. SW: Methodology, Writing – review & editing. CT: Methodology, Writing – review & editing. SA: Writing – review & editing, Funding acquisition, Methodology, Project administration, Supervision.
Funding
The author(s) declare financial support was received for the research, authorship, and/or publication of this article. This research was supported by the Jointed Korean government ministries for Nakdong River Estuary Restoration Project (2019~2020), awarded to S. An. Additionally, this research received support from the Korea Institute of Marine Science & Technology Promotion (KIMST), funded by the Ministry of Oceans and Fisheries (20220023), and the U.S. National Science Foundation (2016246). This study was also supported by the BK21 School of Earth and Environmental Systems and Pusan National University Basic Research Support Project (2 years).
Acknowledgments
We thank Seoyoung Kim, Suhyun Kim, Dongho Kim, and Dongyoung Back for their help. We also thank the captain and the diver for their support during sampling.
Conflict of interest
The authors declare that the research was conducted in the absence of any commercial or financial relationships that could be construed as a potential conflict of interest.
Publisher’s note
All claims expressed in this article are solely those of the authors and do not necessarily represent those of their affiliated organizations, or those of the publisher, the editors and the reviewers. Any product that may be evaluated in this article, or claim that may be made by its manufacturer, is not guaranteed or endorsed by the publisher.
References
An S. (2021). Nakdong River estuary dam operation improvement and ecological restoration plan research service (1) report (1) 2021-WR-RR-127-475 P1644.
An S., Gardner W. S. (2002). Dissimilatory nitrate reduction to ammonium (DNRA) as a nitrogen link, versus denitrification as a sink in a shallow estuary (Laguna Madre/Baffin Bay, Texas). Mar. Ecol. Prog. Ser. 237, 41–50. doi: 10.3354/meps237041
An S., Joye S. B. (2001). Enhancement of coupled nitrification-denitrification by benthic photosynthesis in shallow estuarine sediments. Limnol. Oceanogr. 46, 62–74. doi: 10.4319/lo.2001.46.1.0062
Baird I. G., Manorom K., Phenow A., Gaja-Svasti S. (2020). Opening the gates of the Pak Mun Dam: fish migrations, domestic water supply, irrigation projects and politics. Water AlternAltern. 13, 141–159.
Brevé N. W. P., Vis H., Breukelaar A. W. (2019). Escape from the North Sea: the possibilities for pikeperch (Sander lucioperca L. 1758) to re-enter the Rhine and Meuse estuary via the Haringvlietdam, as revealed by telemetry. J. Coast. Conserv. 23, 239–252. doi: 10.1007/s11852-018-0654-5
Burgin A. J., Hamilton S. K. (2007). Have we overemphasized the role of denitrification in aquatic ecosystems? A review of nitrate removal pathways. Front. Ecol. Environ. 5, 89–96. doi: 10.1890/1540-9295(2007)5[89:HWOTRO]2.0.CO;2
Caffrey J. M., Bonaglia S., Conley D. J. (2019). Short exposure to oxygen and sulfide alter nitrification, denitrification, and DNRA activity in seasonally hypoxic estuarine sediments. FEMS Microbiol. Lett. 366, 1–10. doi: 10.1093/femsle/fny288
Casciotti K. L., Sigman D. M., Hastings M. G., Böhlke J. K., Hilkert A. (2002). Measurement of the oxygen isotopic composition of nitrate in seawater and freshwater using the denitrifier method. Anal. Chem. 74, 4905–4912. doi: 10.1021/ac020113w
Choy E. J., An S., Kang C. K. (2008). Pathways of organic matter through food webs of diverse habitats in the regulated Nakdong River estuary (Korea). Estuar. Coast. Shelf Sci. 78, 215–226. doi: 10.1016/j.ecss.2007.11.024
Deng F., Hou L., Liu M., Zheng Y., Yin G., Li X., et al. (2015). Dissimilatory nitrate reduction processes and associated contribution to nitrogen removal in sediments of the Yangtze Estuary. J. Geophys. Res. Biogeosci. 120, 1521–1531. doi: 10.1002/2015JG003007
Eugster O., Gruber N. (2012). A probabilistic estimate of global marine N-fixation and denitrification. Global Biogeochem. Cycles 26:GB4013. doi: 10.1029/2012GB004300
Fear J. M., Thompson S. P., Gallo T. E., Paerl H. W. (2005). Denitrification rates measured along a salinity gradient in the eutrophic Neuse River Estuary, North Carolina, USA. Estuaries 28, 608–619. doi: 10.1007/BF02696071
Feng L., Zhang Z., Yang G., Wu G. Y., Yang Q., Chen Q. (2023). Microbial communities and sediment nitrogen cycle in a coastal eutrophic lake with salinity and nutrients shifted by seawater intrusion. Environ. Res. 225:115590. doi: 10.1016/j.envres.2023.115590
Giblin A. E., Tobias C. R., Song B., Weston N., Banta G. T., Rivera-Monroy V. H. (2013). The importance of dissimilatory nitrate reduction to ammonium (DNRA) in the nitrogen cycle of coastal ecosystems. Oceanography 26, 124–131. doi: 10.5670/oceanog
Giblin A. E., Weston N. B., Banta G. T., Tucker J., Hopkinson C. S. (2010). The effects of salinity on nitrogen losses from an oligohaline estuarine sediment. Estuaries Coasts 33, 1054–1068. doi: 10.1007/s12237-010-9280-7
Hansen J. I., Henriksen K., Blackburn T. H. (1981). Seasonal distribution of nitrifying bacteria and rates of nitrification in coastal marine sediments. Microb. Ecol. 7, 297–304. doi: 10.1007/BF02341424
Helali M. A., Zaaboub N., Oueslati W., Added A., Aleya L. (2016). Nutrient exchange and oxygen demand at the sediment–water interface during dry and wet seasons off the Medjerda River Delta (Tunis Gulf, Tunisia). Environ. Earth Sci. 75, 1–12. doi: 10.1007/s12665-015-4820-x
Herbert E. R., Schubauer-Berigan J., Craft C. B. (2018). Differential effects of chronic and acute simulated seawater intrusion on tidal freshwater marsh carbon cycling. Biogeochemistry 138, 137–154. doi: 10.1007/s10533-018-0436-z
Hines D. E., Lisa J. A., Song B., Tobias C. R., Borrett S. R. (2015). Estimating the effects of seawater intrusion on an estuarine nitrogen cycle by comparative network analysis. Mar. Ecol. Prog. Ser. 524, 137–154. doi: 10.3354/meps11187
Holmes R. M., Aminot A., Kérouel R., Hooker B. A., Peterson B. J. (1999). A simple and precise method for measuring ammonium in marine and freshwater ecosystems. Can. J. FISH AQUAT Sci. 56, 1801–1808. doi: 10.1139/f99-128
Huang Y., An S. (2022). Weak hypoxia enhanced denitrification in a dissimilatory nitrate reduction to ammonium (DNRA)-dominated shallow and eutrophic coastal waterbody, Jinhae Bay, South Korea. Front. Mar. Sci. 9. doi: 10.3389/fmars.2022.897474
Hussain M. S., Abd-Elhamid H. F., Javadi A. A., Sherif M. M. (2019). Management of seawater intrusion in coastal aquifers: a review. Water 11, 2467. doi: 10.3390/w11122467
Jang S. T., Kim K. C. (2006). Change of oceanographic environment in the nakdong estuary. Sea 11, 11–20.
Jäntti H., Aalto S. L., Paerl H. W. (2021). Effects of ferrous iron and hydrogen sulfide on nitrate reduction in the sediments of an estuary experiencing hypoxia. . Estuaries Coasts 44, 1–12. doi: 10.1007/s12237-020-00783-4
Jäntti H., Hietanen S. (2012). The effects of hypoxia on sediment nitrogen cycling in the Baltic Sea. Ambio 41, 161–169. doi: 10.1007/s13280-011-0233-6
Jeen S. W., Kang J., Jung H., Lee J. (2021). Review of seawater intrusion in western coastal regions of South Korea. Water 13, 761. doi: 10.3390/w13060761
Jensen M. M., Kuypers M. M. M., Gaute L., Thamdrup B. (2008). Rates and regulation of anaerobic ammonium oxidation and denitrification in the Black Sea. Limnol. Oceanogr. 53, 23–36. doi: 10.4319/lo.2008.53.1.0023
Jia Z., Li S., Liu Q., Jiang F., Hu J. (2021). Distribution and partitioning of heavy metals in water and sediments of a typical estuary (Modaomen, South China): the effect of water density stratification associated with salinity. Environ. pollut. 287, 117277. doi: 10.1016/j.envpol.2021.117277
Joye S. B., Hollibaugh J. T. (1995). Influence of sulfide inhibition of nitrification on nitrogen regeneration in sediments. Science 270, 623–625. doi: 10.1126/science.270.5236.623
Jun M., Altor A. E., Craft C. B. (2013). Effects of increased salinity and inundation on inorganic nitrogen exchange and phosphorus sorption by tidal freshwater floodplain forest soils, Georgia (USA). Estuaries Coasts 36, 508–518. doi: 10.1007/s12237-012-9499-6
Kana T. M., Darkangelo C., Hunt M. D., Oldham J. B., Bennett G. E., Cornwell J. C. (1994). Membrane inlet mass spectrometer for rapid high-precision determination of N2, O2, and Ar in environmental water samples. Anal. Chem. 66, 4166–4170. doi: 10.1021/ac00095a009
Kang C.-K., Choy E. J., Paik S.-K., Park H. J., Lee K.-S., An S. (2007). Contributions of primary organic matter sources to macroinvertebrate production in an intertidal salt marsh (Scirpus triqueter) ecosystem. Mar. Ecol. Prog. Ser. 334, 131–143. doi: 10.3354/meps334131
Ketabchi H., Mahmoodzadeh D., Ataie-Ashtiani B., Simmons C. T. (2016). Sea-level rise impacts on seawater intrusion in coastal aquifers: review and integration. J. Hydrol. 535, 235–255. doi: 10.1016/j.jhydrol.2016.01.083
Kim Y. H., Hong S., Song Y. S., Lee H., Kim H.-C., Ryu J., et al. (2017). Seasonal variability of estuarine dynamics due to freshwater discharge and its influence on biological productivity in Yeongsan River Estuary, Korea. Chemosphere 181, 390–399. doi: 10.1016/j.chemosphere.2017.04.085
Kim H. G., Recknagel F., Kim H. W., Joo G. J. (2021). Implications of flow regulation for habitat conditions and phytoplankton populations of the Nakdong River, South Korea. Water Res. 207, 117807. doi: 10.1016/j.watres.2021.117807
Laverman A. M., Canavan R. W., Slomp C. P., Van Cappellen P. (2007). Potential nitrate removal in a coastal freshwater sediment (Haringvliet Lake, The Netherlands) and response to salinization. Water Res. 41, 3061–3068. doi: 10.1016/j.watres.2007.04.002
Li L., Qiu S. J., Chen Y. P., Zhao X. M., Liu J. T., Lu Z. H. (2014). Response of active nitrogen to salinity in a soil from the Yellow River Delta. Huan Jing Ke Xue 35, 2358–2364.
Little C. (2000). The biology of soft shores and estuaries Vol. 17 (Oxford: Oxford University Press), 647–654. doi: 10.1093/oso/9780198504276.001.0001
Luo J., Tillman R. W., Ball P. R. (1999). Factors regulating denitrification in a soil under pasture. Soil Biol. Biochem. 31, 913–927. doi: 10.1016/S0038-0717(99)00013-9
Mai Y., Peng S., Lai Z., Wang X. (2022). Saltwater intrusion affecting NO2– accumulation in demersal fishery species by bacterially mediated N-cycling. Sci. Total Environ. 827:154371. doi: 10.1016/j.scitotenv.2022.154371
Manivannan V., Elango L. (2019). Seawater intrusion and submarine groundwater discharge along the Indian coast. Environ. Sci. pollut. Res. 26, 31592–31608. doi: 10.1007/s11356-019-06103-z
Marchant H. K., Lavik G., Holtappels M., Kuypers M. M. M. (2014). The fate of nitrate in intertidal permeable sediments. PloS One 9, e104517. doi: 10.1371/journal.pone.0104517
Marks B. M., Chambers L., White J. R. (2016). Effect of fluctuating salinity on potential denitrification in coastal wetland soil and sediments. Soil Sci. Soc Am. J. 80, 516–526. doi: 10.2136/sssaj2015.07.0265
Moore W. S., Joye S. B. (2021). Saltwater intrusion and submarine groundwater discharge: acceleration of biogeochemical reactions in changing coastal aquifers. Front. Earth. Sci. (Lausanne) 9. doi: 10.3389/feart.2021.600710
Murphy A. E., Bulseco A. N., Ackerman R., Vineis J. H., Bowen J. L. (2020). Sulphide addition favours respiratory ammonification (DNRA) over complete denitrification and alters the active microbial community in salt marsh sediments. Environ. Microbiol. 22, 2124–2139. doi: 10.1111/1462-2920.14969
Myers R. J. K. (1972). The effect of sulphide on nitrate reduction in soil. Plant Soil 37, 431–433. doi: 10.1007/BF02139987
Neubauer S. C., Piehler M. F., Smyth A. R., Franklin R. B. (2019). Saltwater intrusion modifies microbial community structure and decreases denitrification in tidal freshwater marshes. Ecosystems 22, 912–928. doi: 10.1007/s10021-018-0312-7
Nizzoli D., Welsh D. T., Fano E. A., Viaroli P. (2006). Impact of clam and mussel farming on benthic metabolism and nitrogen cycling, with emphasis on nitrate reduction pathways. Mar. Ecol. Prog. Ser. 315, 151–165. doi: 10.3354/meps315151
Osborne R. I., Bernot M. J., Findlay S. E. G. (2015). Changes in nitrogen cycling processes along a salinity gradient in tidal wetlands of the Hudson River, New York, USA. Wetlands 35, 323–334. doi: 10.1007/s13157-014-0620-4
Park S. R., Kim J.-H., Kang C.-K., An S., Chung I. K., Kim J. H., et al. (2009). Current status and ecological roles of Zostera marina after recovery from large-scale reclamation in the Nakdong River estuary, Korea. Estuar. Coast. Shelf Sci. 81, 38–48. doi: 10.1016/j.ecss.2008.10.003
Park S., Lee J., Choi J. U., Heo N., An S. (2016). Study on the long-term changes in water quality and benthic ecology and evaluation on effect of the barrage in Nakdong River estuary. J. wetlands Res. 18, 58–67. doi: 10.17663/JWR.2016.18.1.058
Park H. K., Lee H. J., Heo J., Yun J. H., Kim Y. J., Kim H. M., et al. (2021). Deciphering the key factors determining spatio-temporal heterogeneity of cyanobacterial bloom dynamics in the Nakdong River with consecutive large weirs. Sci. Total Environ. 755, 143079. doi: 10.1016/j.scitotenv.2020.143079
Poirrier M. A. (2013). Effects of closure of the Mississippi River Gulf Outlet on saltwater intrusion and bottom-water hypoxia in Lake Pontchartrain. Gulf Caribb. Res. 25, 105–109. doi: 10.18785/gcr.2501.07
Pulido-Leboeuf P. (2004). Seawater intrusion and associated processes in a small coastal complex aquifer (Castell de Ferro, Spain). Appl. Geochem. 19, 1517–1527. doi: 10.1016/j.apgeochem.2004.02.004
Risgaard-Petersen N., Nielsen L. P., Rysgaard S., Dalsgaard T., Meyer R. L. (2003). Application of the isotope pairing technique in sediments where anammox and denitrification coexist. Limnol. Oceanogr. Methods 1, 63–73. doi: 10.4319/lom.2003.1.63
Rivett M. O., Buss S. R., Morgan P., Smith J. W., Bemment C. D. (2008). Nitrate attenuation in groundwater: a review of biogeochemical controlling processes. Water Res. 42, 4215–4232. doi: 10.1016/j.watres.2008.07.020
Rysgaard S., Thastum P., Dalsgaard T., Christensen P. B., Sloth N. P. (1999). Effects of salinity on NH+4 adsorption capacity, nitrification, and denitrification in Danish estuarine sediments. Estuaries Coasts 22, 21–30. doi: 10.2307/1352923
Santoro A. E. (2010). Microbial nitrogen cycling at the saltwater-freshwater interface. Hydrogeol. J. 18, 187–202. doi: 10.1007/s10040-009-0526-z
Scott N. A., Binkley D. (1997). Foliage litter quality and annual net N mineralization: comparison across North American forest sites. Oecologia 111, 151–159. doi: 10.1007/s004420050219
Seitzinger S. P., Gardner W. S., Spratt A. K. (1991). The effect of salinity on ammonium sorption in aquatic sediments: implications for benthic nutrient recycling. Estuaries 14, 167–174. doi: 10.2307/1351690
Seo D. C., Yu K., Delaune R. D. (2008). Influence of salinity level on sediment denitrification in a Louisiana estuary receiving diverted Mississippi River water. Arch.Agron. Soil Sci. 54:249–257. doi: 10.1080/03650340701679075
Shan J., Zhao X., Sheng R., Xia Y., Ti C., Quan X., et al. (2016). Dissimilatory nitrate reduction processes in typical Chinese paddy soils: rates, relative contributions, and influencing factors. Environ. Sci. Technol. 50, 9972–9980. doi: 10.1021/acs.est.6b01765
Shi L., Jiao J. J. (2014). Seawater intrusion and coastal aquifer management in China: a review. Environ. Earth Sci. 72, 2811–2819. doi: 10.1007/s12665-014-3186-9
Song G., Liu S., Zhang J., Zhu Z., Zhang G., Marchant H. K., et al. (2020). Response of benthic nitrogen cycling to estuarine hypoxia. Limnol. Oceanogr. 66, 652–666. doi: 10.1002/lno.11630
Ståhl M., Davidsson T. E. (2000). The influence of organic carbon on nitrogen transformations in five wetland soils. Soil Sci. Soc Am. J. 64, 1129–1136. doi: 10.2136/sssaj2000.6431129x
Stenstrom M. K., Poduska R. A. (1980). The effect of dissolved oxygen concentration on nitrification. Water Res. 14, 643–649. doi: 10.1016/0043-1354(80)90122-0
Strickland J. D. H., Parsons T. R. (1972). A practical handbook of seawater analysis (Ottawa: Fisheries Research Board of Canada).
Thamdrup B., Dalsgaard T. (2002). Production of N2 through anaerobic ammonium oxidation coupled to nitrate reduction in marine sediments. Appl. Environ. Microbiol. 68, 1312–1318. doi: 10.1128/AEM.68.3.1312-1318.2002
Tiedje J. M. (1988). “Ecology of denitrification and dissimilatory nitrate reduction to ammonium,” in Environmental Microbiology of Anaerobes. Ed. Zehnder A. J. B. (John Wiley and Sons, New York, NY), 179–244.
van den Tweel B., Kösters R., Boer C., Schokker A., Verbrugge M., Verweij L., et al. (2021). Turning the tides in the Haringvliet.
Wang K., Chen J., Ni X., Zeng D., Li D., Jin H., et al. (2017). Real-time monitoring of nutrients in the Changjiang Estuary reveals short-term nutrient-algal bloom dynamics. J. Geophys. Res. Oceans. 122, 5390–5403. doi: 10.1002/2016JC012450
Wang H., Gilbert J. A., Zhu Y., Yang X. (2018). Salinity is a key factor driving the nitrogen cycling in the mangrove sediment. Sci. Total Environ. 631–632, 1342–1349. doi: 10.1016/j.scitotenv.2018.03.102
Wang J., Li L., He Z., Kalhoro N. A., Xu D. (2019). Numerical modelling study of seawater intrusion in Indus River Estuary, Pakistan. Ocean Eng. 184, 74–84. doi: 10.1016/j.oceaneng.2019.05.029
Wang S., Pi Y., Song Y., Jiang Y., Zhou L., Liu W., et al. (2020). Hotspot of dissimilatory nitrate reduction to ammonium (DNRA) process in freshwater sediments of riparian zones. Water Res. 173, 115539. doi: 10.1016/j.watres.2020.115539
Werner A. D. (2010). A review of seawater intrusion and its management in Australia. Hydrogeol. J. 1, 281–285. doi: 10.1007/s10040-009-0465-8
Werner A. D., Bakker M., Post V. E. A., Vandenbohede A., Lu C., Ataie-Ashtiani B., et al. (2013). Seawater intrusion processes, investigation and management: Recent advances and future challenges. Adv. Water Resour. 51, 3–26. doi: 10.1016/j.advwatres.2012.03.004
Weston N. B., Giblin A. E., Banta G. T., Hopkinson C. S., Tucker J. (2010). The effects of varying salinity on ammonium exchange in estuarine sediments of the Parker River, Massachusetts. Estuaries Coasts. 33, 985–1003. doi: 10.1007/s12237-010-9282-5
Weston N. B., Vile M. A., Neubauer S. C., Velinsky D. J. (2011). Accelerated microbial organic matter mineralization following salt-water intrusion into tidal freshwater marsh soils. Biogeochemistry 102, 135–151. doi: 10.1007/s10533-010-9427-4
Widney S. E., Smith D., Herbert E. R., Schubauer-Berigan J. P., Li F., Pennings S. C., et al. (2019). Chronic but not acute saltwater intrusion leads to large release of inorganic N in a tidal freshwater marsh. Sci. Total Environ. 695, 133779. doi: 10.1016/j.scitotenv.2019.133779
Xie R., Rao P., Pang Y., Shi C., Li J., Shen D. (2020). Salt intrusion alters nitrogen cycling in tidal reaches as determined in field and laboratory investigations. Sci. Total Environ. 729, 138803. doi: 10.1016/j.scitotenv.2020.138803
Xiong G., Zhu X., Wu J., Liu M., Yang Y., Zeng X. (2023). Seawater intrusion alters nitrogen cycling patterns through hydrodynamic behavior and biochemical reactions: Based on Bayesian isotope mixing model and microbial functional network. Sci. Total Environ. 867:161368. doi: 10.1016/j.scitotenv.2022.161368
Yin G., Hou L., Liu M., Liu Z., Gardner W. S. (2014). A novel membrane inlet mass spectrometer method to measure 15NH4+ for isotope-enrichment experiments in aquatic ecosystems. Environ. Sci. Technol. 48, 9555–9562. doi: 10.1021/es501261s
Keywords: seawater intrusion, seawater trapping, denitrification, nitrification, anammox, dissimilatory nitrate reduction to ammonium, Nakdong River Estuary
Citation: Huang Y, Song B, Zhang Q, Park Y, Wilson SJ, Tobias CR and An S (2024) Seawater intrusion effects on nitrogen cycling in the regulated Nakdong River Estuary, South Korea. Front. Mar. Sci. 11:1369421. doi: 10.3389/fmars.2024.1369421
Received: 12 January 2024; Accepted: 18 April 2024;
Published: 14 May 2024.
Edited by:
Siyuan Ye, Qingdao Institute of Marine Geology (QIMG), ChinaReviewed by:
Chunyu Zhao, Dezhou University, ChinaCui-Yun Zhang, Chinese Academy of Geological Sciences, China
Copyright © 2024 Huang, Song, Zhang, Park, Wilson, Tobias and An. This is an open-access article distributed under the terms of the Creative Commons Attribution License (CC BY). The use, distribution or reproduction in other forums is permitted, provided the original author(s) and the copyright owner(s) are credited and that the original publication in this journal is cited, in accordance with accepted academic practice. No use, distribution or reproduction is permitted which does not comply with these terms.
*Correspondence: Soonmo An, sman@pusan.ac.kr