


Abstract
Theoretical models predict that z ≳ 6 quasars are hosted in the most massive halos of the underlying dark matter distribution and thus would be immersed in protoclusters of galaxies. However, observations report inconclusive results. We investigate the 1.1 proper-Mpc2 environment of the z = 7.54 luminous quasar ULAS J1342+0928. We search for Lyman-break galaxy (LBG) candidates using deep imaging from the Hubble Space Telescope (HST) in the Advanced Camera for Surveys (ACS)/F814W, Wide Field Camera 3 (WFC3)/F105W/F125W bands, and Spitzer/Infrared Array Camera at 3.6 and 4.5 μm. We report a  LBG with magF125W = 26.41 at 223 projected proper kpc (pkpc) from the quasar. We find no HST counterpart to one [C ii] emitter previously found with the Atacama Large millimeter/submillimeter Array (ALMA) at 27 projected pkpc and z[C II]=7.5341 ± 0.0009 (Venemans et al. 2020). We estimate the completeness of our LBG candidates using results from Cosmic Assembly Near-Infrared Deep Extragalactic Legacy Survey/GOODS deep blank field searches sharing a similar filter setup. We find that >50% of the z ∼ 7.5 Lyman-break galaxies (LBGs) with magF125W > 25.5 are missed due to the absence of a filter redward of the Lyman break in F105W, hindering the UV color accuracy of the candidates. We conduct a QSO-LBG clustering analysis revealing a low LBG excess of
  in this quasar field, consistent with an average or low-density field. Consequently, this result does not present strong evidence of an LBG overdensity around ULAS J1342+0928. Furthermore, we identify two LBG candidates with a zphot matching a confirmed z = 6.84 absorber along the line of sight to the quasar. All these galaxy candidates are excellent targets for follow-up observations with JWST and/or ALMA to confirm their redshift and physical properties.
Export citation and abstract BibTeX RIS

Original content from this work may be used under the terms of the Creative Commons Attribution 4.0 licence. Any further distribution of this work must maintain attribution to the author(s) and the title of the work, journal citation and DOI.
1. Introduction
Understanding the formation of the first massive galaxies and black holes and their role in reionizing the universe is one of the main problems in modern cosmology. However, it is still challenging to identify these distant sources and subsequently characterize their properties. Quasars are the most luminous nontransient sources known and can be studied in detail at the earliest cosmic epochs (e.g., Fan et al. 2023). Despite quasars being very rare sources (∼1 Gpc−3 at tage < 1 Gyr, Schindler et al. 2023), multiple observational efforts during the past decade have revealed a significant (>400) population of quasars in the epoch of reionization within the first billion years of the universe, at redshift z > 5.5 (e.g., Venemans et al. 2013, 2015; Bañados et al. 2016; Mazzucchelli et al. 2017b; Matsuoka et al. 2019; Reed et al. 2019; Yang et al. 2019, 2023; Gloudemans et al. 2022). These observations evidence a dramatic decline of the spatial density of luminous quasars at z > 6 and suggest that we are closing in on the epoch when the first generation of supermassive black holes (SMBHs) emerged in the early universe (Wang et al. 2019a).
Only eight quasars are known at z > 7, and three are at z > 7.5: J0313-1806 at z = 7.64 (Wang et al. 2021), J1342+0928 at z = 7.54 (Bañados et al. 2018a), and J1007+2115 at z = 7.52 (Yang et al. 2020). These early quasars are powered by ≳108 M⊙ black holes (e.g., Yang et al. 2021; Farina et al. 2022) and the large majority reside in extremely star-forming galaxies (>100–1000 M⊙ yr−1; e.g., Venemans et al. 2020). In order to sustain both the tremendous black hole growth and the intense star formation, current theoretical models posit that these systems lie in highly biased regions of the universe at that time, where gas can fragment and form a large number of surrounding galaxies (e.g., Springel et al. 2005; Volonteri & Rees 2006; Costa et al. 2014). These quasar environments could possibly host powerful sources of ionizing photons such as bright Lyα emitters, or have nearby halos hosting these galaxies (Overzier et al. 2009). Consequently, these massive quasars are thought to be indicators of protoclusters defined as galaxy overdensities that will evolve by z ∼ 0 into the most massive (≥1014 M⊙) virialized clusters (Overzier 2016). Studying the environment of quasars hosting SMBHs as early as at z ∼ 7.5 is crucial to understanding the large-scale structure and the feeding of gas in the first massive galaxies and black holes in the universe. To probe the presence of such protoclusters, one can perform deep imaging observations to select galaxy candidates, and compare their number density to that observed in blank fields, i.e., a field without a quasar. However, whether quasars at z ∼ 6 reside in overdense regions is heavily debated in the observational side of the literature. Discrepancies in these findings can be explained by the different observational techniques used to identify galaxies around quasars. This includes photometric searches for Lyman-break galaxies (LBGs; Zheng et al. 2006; Morselli et al. 2014; Simpson et al. 2014; Champagne et al. 2023), for Lyα emitters (LAEs; Mazzucchelli et al. 2017a), or for a combination of both (e.g., Ota et al. 2018). Also, spectroscopic confirmations of galaxies (e.g., Bosman et al. 2020; Mignoli et al. 2020), or [C ii] emitters and submillimeter galaxy searches (e.g., Decarli et al. 2017; Champagne et al. 2018; Meyer et al. 2022) have been undertaken in the literature. Recently, leveraging the capabilities of JWST near-infrared (NIR) spectra, a substantial influx of [O iii]-emitting galaxies has been unveiled in the environments of z ≳ 5 quasars (Kashino et al. 2023; Wang et al. 2023). Moreover, these studies encompass diverse physical areas and rely on different methods for evaluating the presence of an overdensity (e.g., Overzier 2022). Finally, the results are affected by cosmic variance given the handful of z ∼ 6 quasar fields inspected (García-Vergara et al. 2019).
The highest-redshift simulations available from Costa et al. (2014) demonstrate that overdensities of LBGs and young LAEs around quasars up to z ∼ 6.2 can be probed within a 1.2 proper-Mpc2 (pMpc2) environment using the HST Advanced Camera for Surveys (ACS) Wide Field Channel. The highest-redshift quasar whose environment has been studied so far, and using this observational strategy, is ULAS J1120+0641 at z = 7.1 (Simpson et al. 2014). Given the rapidly decreasing number density of luminous quasars at z > 7 (Wang et al. 2019a) where the formation of SMBHs posits challenges not only on theories of black hole formation but also on large-scale structure assembly (e.g., Habouzit et al. 2016a, 2016b), it is crucial to observationally inspect the environments of quasars at the highest redshift known, i.e., z ∼ 7.5. In this work, we search for Lyman-break galaxy (LBG) candidates at z ∼ 7.5 in the immediate ∼1 pMpc2 environment of the z = 7.54 quasar ULAS J1342+0928, using deep imaging data collected with the Hubble Space Telescope (HST), and Spitzer/Infrared Array Camera (IRAC). This quasar hosts one of the earliest and most massive SMBHs with a mass of ∼0.9 × 10⁹
M⊙ that is actively accreting at near Eddington rates with Lbol/LEdd ∼ 1.1 (Onoue et al. 2020). The host galaxy has already evolved with a high amount of gas and dust resulting in a star formation rate (SFR) of ∼150 M⊙ yr−1, with a metallicity comparable to the solar neighborhood (Novak et al. 2019). Additionally, a study of the optical/NIR spectrum of ULAS J1342+0928 identified a strong absorber at z = 6.8 on its line of sight (Simcoe et al. 2020). This massive and active quasar in the early universe is an ideal candidate to now look for a galaxy overdensity and trace its large-scale structure. This paper is organized as follows: we describe the HST data and their reduction in Section 2, followed by the HST photometry, noise calculation, and aperture corrections in Section 3. We also include available Spitzer/IRAC photometry (Section 3.3). The selection criterion and photometric-redshift analysis to create the final catalog of LBG candidates are described in Section 4. Details on the properties of the resulting galaxy candidates are discussed in Section 5. The results, catalog completeness, and the interpretation of findings in relation to the density of the quasar field are discussed in Section 6. Finally, we summarize our results and provide a further outlook in Section 7. Throughout this article, we adopt a cosmology with H0 = 70 km s−1 Mpc−1, ΩM
= 0.3, ΩΛ = 0.7. Using this cosmology, the age of the Universe is 679 Myr at the redshift of ULAS J1342+0928, and 1 0 corresponds to 4.99 proper-kpc (pkpc). All magnitudes provided are in the AB system.
2. Observations
Usually, at least three filters are occupied to identify galaxies in the epoch of reionization using the Lyman-break technique. The bluest filter serves to spot the spectral break in the galaxy continuum emission produced by the intergalactic medium (IGM) absorption. Hence, no or very little flux is expected to be detected in this filter. A contiguous filter is centered on the expected wavelength of the Lyman break serving as the dropout and detection band, and redder filters are used to observe the continuum emission. In this section, we describe the HST data obtained to select LBG candidates in the environment of ULAS J1342+0928 and the reduction process.
2.1. HST Data and Reduction
We use observations obtained with the ACS and Wide Field Camera 3 (WFC3) on board HST between 2018 June and 2019 June (PI: Bañados, Prog ID:1165). We obtained data in the F814W (ACS, 13 orbits) serving as the nondetection filter, and the F105W and F125W filters (WFC3, eight and four orbits each, respectively). To maximize the ACS surveyed area, WFC3 NIR imaging was observed in a 2 × 2 mosaic strategy. The final effective area covered to search for LBGs is computed based on the ACS/F814W image, as this area is covered by all three filters. The calculation masks out bad pixels in the weight map, resulting in an area of  . All filter transmission curves are presented in Figure 1, with the rest-frame UV spectrum of ULAS J1342+0928 overlaid (Bañados et al. 2018a). The presented observations achieve 5σ limiting AB magnitudes of 28.20, 27.83, and 27.46 in the F814W, F105W, and F125W bands, respectively, as calculated with a 04 diameter circular aperture.
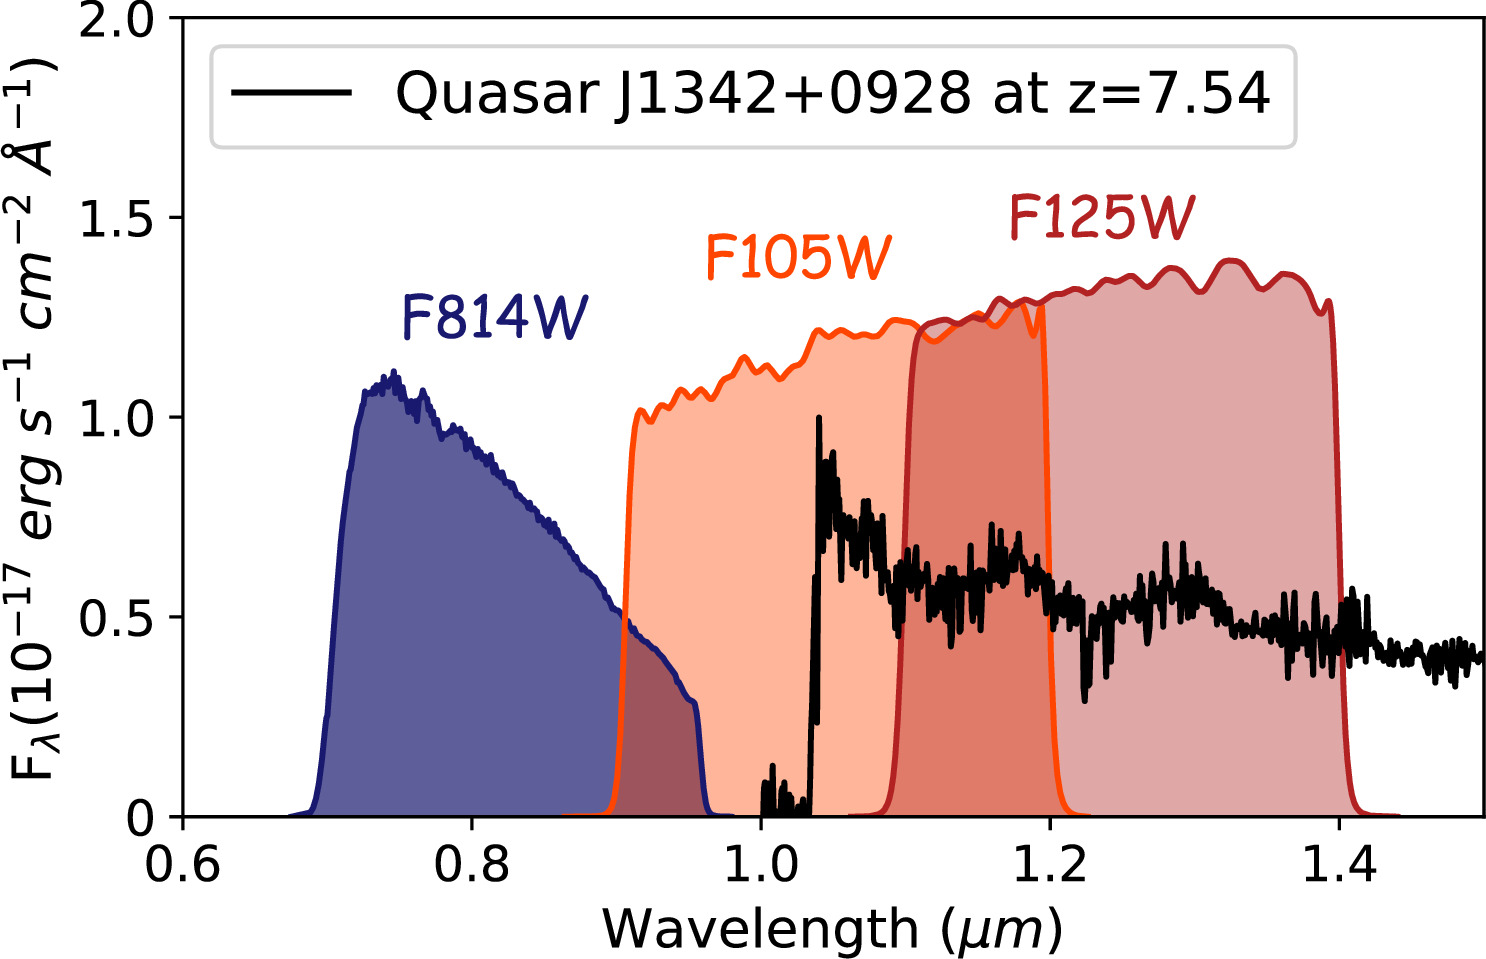
Figure 1. The HST filter coverage used to look for galaxy candidates in the field of ULAS J1342+0928 is depicted, with the spectrum of the quasar from Bañados et al. (2018a) overlaid. Galaxy candidates laying in close proximity to the quasar at z ∼ 7.5 are expected to be undetected in the WFC/F814W, begin to drop completely halfway through the WFC3/IR F105W filter, and be fully detected in the WFC3/F125W filter.
Download figure:
Standard image High-resolution imageWe use the bias subtracted, flat-fielded, and cosmic-ray cleaned, reduced images provided by STScI, and implement an ad hoc method to ensure a good astrometric match between the different filters using DrizzlePac.
15
Indeed, such an alignment is nontrivial due to the small number of stars found in the field, which complicates standard reduction routines. We start by considering the HST WFC/F814W pipeline-reduced flc.fits files, downloaded from the MAST archive.
16
In order to create reference catalogs with enough sources, we run Source Extractor (Bertin & Arnouts 1996) on each image, after cleaning them from cosmic-ray contamination using the astrodrizzle routine with cosmic_ray_cr_clean = True. We use tweakreg to align the uncleaned, original flc.fits images, utilizing these Source Extractor-created reference catalogs, each containing ∼1000 sources. The final combined image in F814W is obtained using astrodrizzle, with skymethod = "match" and combine_type = "median." We run Source Extractor again on the final, drizzled F814W image, and use this new catalog (4544 sources) as a reference to match the WFC3/F105W and F125W images to the F814W. In detail, we use tweakreg on the F105W and F125W HST pipeline-reduced flt.fits files, with the F814W catalog as reference, searchrad = 3. and minobj = 6. We drizzled the matched files to obtain the final F125W and F105W images, with the same astrodrizzle parameters used for the F814W filter, and final_scale = 005, in order to match the pixel scale of the WFC3 images to that of ACS.
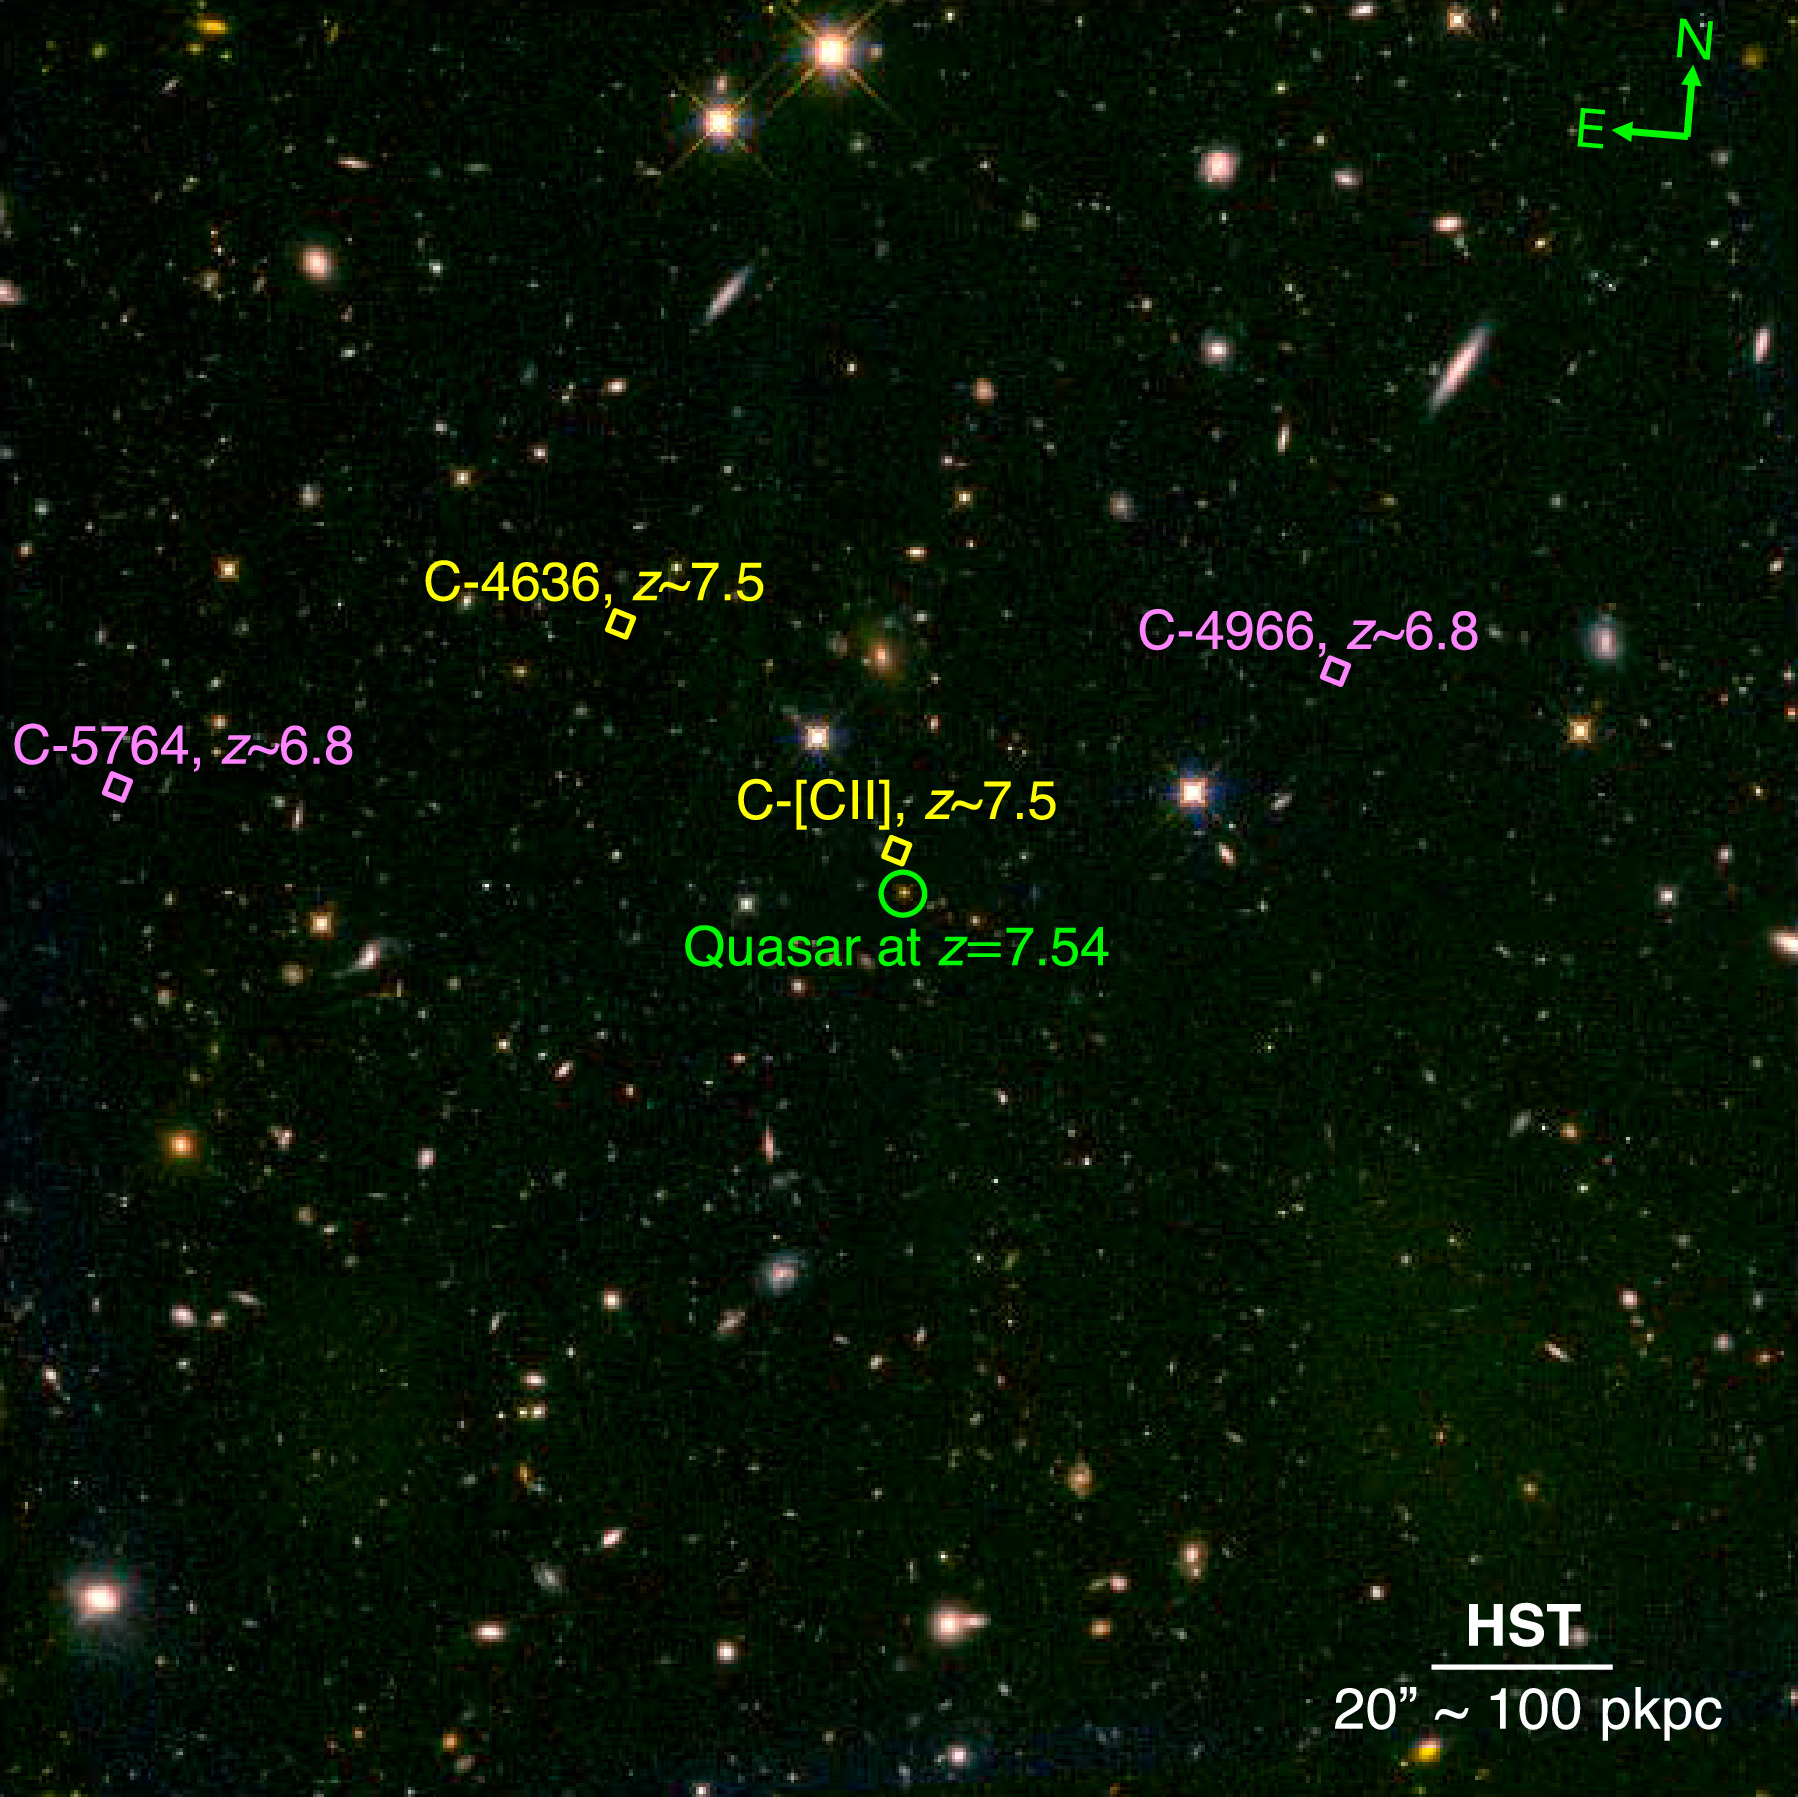
In order to check the goodness of our match, we compared the coordinates of sources recovered in all three HST final images, considering only the 30 brightest objects. The final mean deviation within the astrometric solutions of the filters is ∼003. If instead we compare their astrometry with the GAIA DR2 catalog (Gaia Collaboration et al. 2018), the mean difference in the coordinates of the recovered sources (10 in F814W, 13 in both F105W and F125W) is ∼005. We note that the final F105W image is affected by an artifact, due to the presence of a satellite trail in one of the flt exposures. We decided not to discard this exposure to obtain the deepest image, but caution is needed when examining sources close to the trail. The final reduced images F814W, F105W, and F125W (hereafter i814, Y105, and J125) are presented in Figure 2 as a red, green, and blue (RGB) color image created with JS9-4L v2.2 (Mandel & Vikhlinin 2018).

Figure 2. HST iYJ RGB color image of the field around the quasar ULAS J1342+0928. The quasar is in the center as presented in the circled region. Overlaid are the high-redshift galaxy candidates selected in this work as described in Section 5. The source C-4636 is identified as an LBG candidate with a photometric redshift of zphot = 7.69. Candidate C-[C ii] is a [C ii] emitter previously identified in Venemans et al. (2020) to be at z[C II] = 7.5341 ± 0.0009. This candidate lacks HST or Spitzer counterpart emission, making it a dust-obscured candidate in the environment of the quasar. Additional LBG candidates in the observed field, C-4966 and C-5764are at zphot = 6.91 and 6.89, respectively.
Download figure:
Standard image High-resolution image2.1.1. Point-spread Function Matching
Finding high-redshift galaxies requires very accurate colors from photometric measurements in different bands. We calculate the photometry in fixed aperture diameters of 04, as later discussed in Section 4, and therefore, imaging in all bands needs to be matched to the same point-spread function (PSF). The size in pixels of the PSF in the i814, Y105, and J125 images are 2.6, 4.45, and 4.55, respectively. The reference matching image is the one with the largest PSF full width at half-maximum (FWHM), which in this case is the J125 band. We decided against using stars to build the PSF in each band because of their scarcity. Hence, to perform the PSF matching we therefore relied on the standard HST PSFs produced with a high level of precision by STScI
17
from the _flt/_flc frame. The matching kernel for image convolution is produced with pyPHER (Boucaud et al. 2016) to make the final PSF-matched images.
3. Making the Catalogs
This analysis follows closely the procedure for Lyman-break detection in Rojas-Ruiz et al. (2020). We utilize the software Source Extractor v2.25.0 to measure the photometry of the sources in all three HST filters in dual mode with a coadded Y105 + J125 as the detection image, which serves to maximize the signal-to-noise ratio (S/N) and minimize the number of spurious sources resulting in the catalogs. The errors provided by Source Extractor depend on the rms map. We build this rms map for each band from the sky flux measurements in the science image (SCI) found with a 2.5σ clipping, and the reduced weight image (WHT) as follows:

The flux of the objects is measured in a small Kron elliptical aperture (PHOT_AUTOPARAMS 1.2, 1.7), which is subsequently corrected up to total magnitudes using the flux measured in a larger Kron aperture (PHOT_AUTOPARAMS 2.5, 3.5), as previously done in high-redshift galaxy studies (e.g., Bouwens et al. 2010; Finkelstein et al. 2010; Bouwens et al. 2021; Finkelstein et al. 2022). To identify pointlike sources in our catalog, we avoid relying solely on the CLASS_STAR parameter from Source Extractor, which can be misleading when investigating high-redshift sources (see Finkelstein et al. 2015; Morishita et al. 2018). We also perform photometry in a 04 diameter circular aperture. Comparing the ratio between the Kron elliptical aperture and the 04 circular aperture sizes helps identify pointlike sources such as stars or bad pixels. This circular aperture also serves as a high S/N measurement of the source at the targeted wavelengths and is thus relevant for the S/N cuts in our criteria for selecting candidates at z ∼ 7.5 as described in Section 4.
Upon visual inspection of the segmentation map produced from the Source Extractor run, the combination of parameters DETECT_THRESH = 1.5 and DETECT_MINAREA = 7 maximizes the number of sources detected while lowering the spurious fraction.
3.1. Noise Calculation
We perform an empirical noise calculation of the images to account for the partially correlated noise characteristic of drizzled HST images (Casertano et al. 2000). While Source Extractor calculates the flux uncertainties from individual uncorrelated pixels in the rms map, the procedure described in Papovich et al. (2016) accounts for correlated and uncorrelated noise. We closely follow this empirical noise estimate as described below.
For images with exclusively uncorrelated pixels, the noise is measured in a circular aperture of N pixels, which scale following  , where σ1 is the pixel-to-pixel standard deviation of the background. Conversely, the noise from completely correlated pixels is measured as σn
= σ1 × N. In our HST images, the noise truly varies among both correlations as Nβ
where 0.5 < β < 1, and this can be estimated for the whole image with the parameterized equation:
, where σ1 is the pixel-to-pixel standard deviation of the background. Conversely, the noise from completely correlated pixels is measured as σn
= σ1 × N. In our HST images, the noise truly varies among both correlations as Nβ
where 0.5 < β < 1, and this can be estimated for the whole image with the parameterized equation:

where α has to be a positive value. Note that we do not include the Poisson correction of the equation from Papovich et al. (2016) as it did not contribute to the calculation of the noise in the HST images. We measure the noise in each of the three HST images by first placing randomly distributed apertures in the sky background with growing sizes from 01–10 in diameter. Then, we use the curve_fit Python function with the Levenberg–Marquardt least-squares method to fit for the noise found in the random apertures with increasing size (see Figure 3). The calculated noise values in each image are applied to estimate the flux errors for the Kron and 04 apertures. For the Kron aperture, N is calculated as the number of pixels in the ellipse defined by the semimajor (A_IMAGE) and semiminor (B_IMAGE) axes measured by Source Extractor.
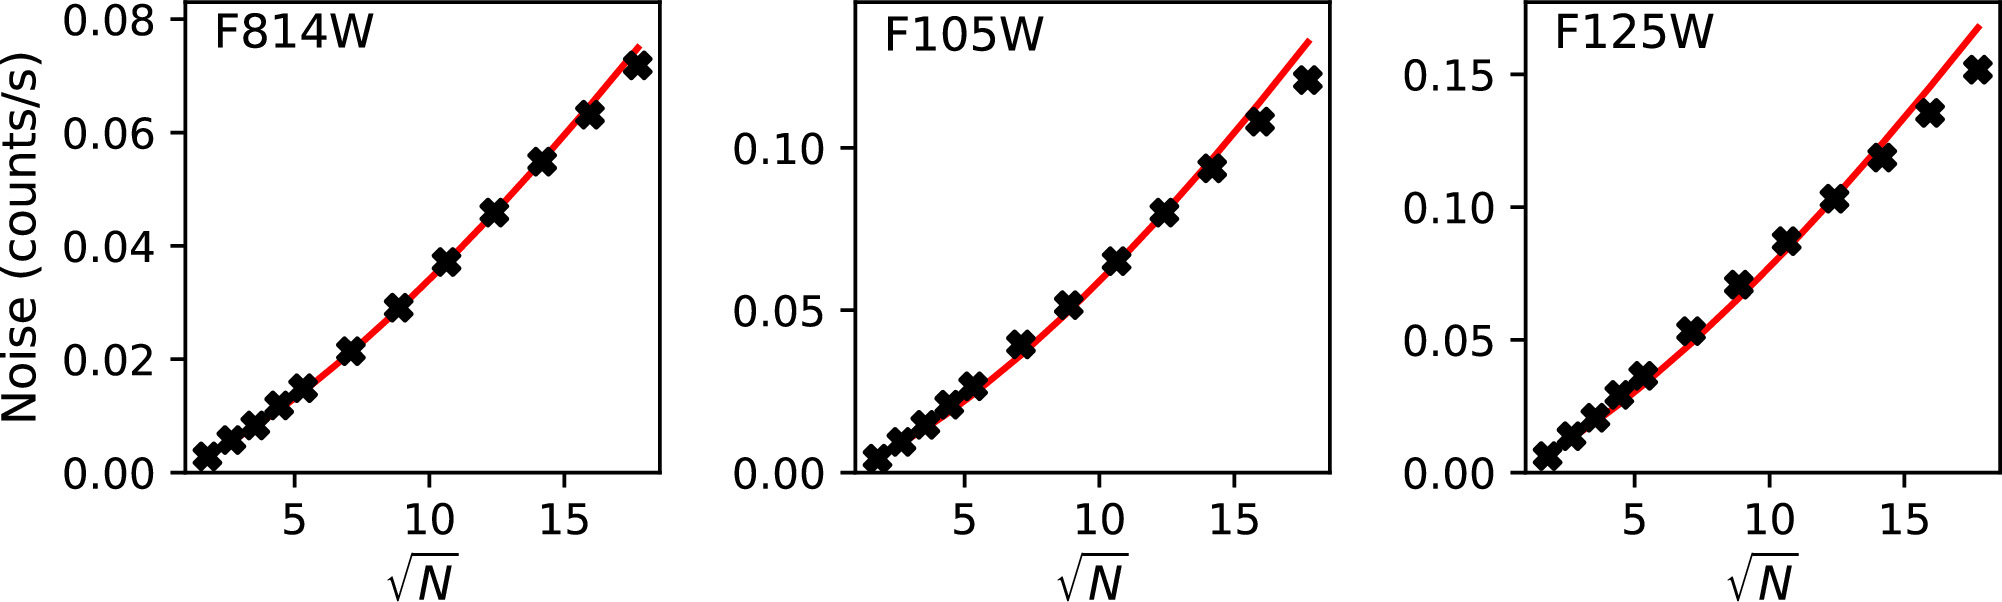
Figure 3. Noise calculation for the field in the three HST bands following Equation (2). N is the number of pixels in the area of the aperture with diameters 2.0, 3.0, 4.0, 5.0, 6.0, 8.0, 10, 12, 14, 16, 18, and 20 (pixel scale is 005). Note how the noise grows with a bigger aperture, as expected from the equation. The red line shows the best fit correlating the noise and aperture size N, which is used to find the α and β free parameters that contribute to the noise estimate.
Download figure:
Standard image High-resolution image3.2. Corrections to the Photometry Catalogs
The resulting Source Extractor catalogs with the calculated flux errors are then corrected for Galactic dust attenuation following the Cardelli et al. (1989) extinction curve with an Rv = 3.1, as motivated in similar studies of high-redshift galaxies (e.g., Rojas-Ruiz et al. 2020; Finkelstein et al. 2022; Tacchella et al. 2022). We use Schlafly & Finkbeiner (2011) to correct for galactic extinction and find a color excess E(B − V) = 0.025. The zero-points for the final catalog are calculated according to the newest 2020 HST photometric calibrations for ACS and WFC3, which apply to the observed dates of the images. The zero-points in AB magnitude are 25.9360, 26.2646, and 26.2321 for i814, Y105, and J125, respectively. We also apply in all filters an aperture correction from the large (2.5, 3.5) to small (1.2, 1.7) Kron aperture photometry measured in the J125, to account for the missing PSF flux in the smaller aperture.
3.3. Spitzer/IRAC Photometry
Additional Spitzer/IRAC 3.6 and 4.5 μm images covering the same area of the quasar environment explored with HST are available from Cycle 16 archival database (PI: Decarli). Each of the IRAC mosaics has an exposure time of 3.4 hr, and the 3σ limiting depth for point sources is ≈0.8 μJy in both Channels 1 and 2. These additional photometric bands provide crucial information to distinguish true high-redshift galaxies from lower-redshift contaminants. These IRAC bands allow for better building of the spectral energy distribution (SED), and hence to better differentiate between a dusty Balmer-break galaxy at z ∼ 2 and a high-redshift candidate of interest at z ∼ 7.5. The FWHM of the IRAC point response function is ≈18 in Channels 1 and 2;
18
this is about 2 orders of magnitude larger than in HST. Therefore, in order to match the sources from the two data sets the IRAC PSFs need to be modeled in order to correct for deblending of sources and calculate accurate flux and flux errors. The mosaics and modeling are performed following Kokorev et al. (2022), and are briefly described here.
To obtain photometry from the IRAC imaging, a PSF model method is produced using the tools from the Great Observatories Legacy Fields IR Analysis Tools (GOLFIR; Brammer 2022). This modeling method uses a high-resolution prior, which is built by combining the HST/ACS and WFC3 images. This resulting image is combined with the IRAC PSF using a matching kernel to finally obtain the low-resolution templates. The original IRAC images are divided into homogeneous 4 × 4 patches of 1200, which are allowed to overlap to improve the modeling. The brightest stars and sources with high S/Ns in the IRAC and HST images are manually masked to avoid large residuals from the fit. IRAC model imaging is first generated for the brightest objects in the J125 catalog doing a least-squares fit of the low-resolution IRAC patches to the original IRAC data to obtain the modeled fluxes. The flux errors are simply the diagonal of the covariance matrix of the model. Similarly, for the fainter sources in the catalog but the least-squares fit normalizations are then adopted as the IRAC flux densities. The resulting photometry from this PSF modeling method is used for the rest of the analysis.
4. Selection of Galaxy Candidates
Galaxy candidates neighboring the quasar ULAS J1342+0928 are found with a similar method as previous work in the literature (Rojas-Ruiz et al. 2020; Finkelstein et al. 2022; Bagley et al. 2024). We rely on the photometric-redshift technique by fitting the best SED model to the HST and Spitzer photometry. We refine the catalog of candidates by applying S/N cuts, quality checks between the low and high-redshift fitting, and color–color comparisons to low-redshift interlopers and MLT brown dwarfs (see Section 5.1). The different steps to obtain the catalog of galaxy candidates are described in this section.
4.1. Photometric Redshifts with EAZY
We use the Easy and Accurate Zphot from Yale (EAZY; Brammer et al. 2008) version 2015-05-08 to calculate the photometric redshifts of all sources in our catalogs. EAZY calculates the probability distribution function of photometric redshifts P(z) based on a minimized χ2 fit of the observed photometry in all given filters to different SED models of known galaxy types. EAZY includes the 12 tweak_fsps_QSF_12_v3 Flexible Stellar Population Synthesis models (Conroy et al. 2009; Conroy & Gunn 2010), the template from Erb et al. (2010) of the young, low-mass, and blue galaxy BX418 at z = 2.3 exhibiting high equivalent width (EW) of nebular lines and Lyα, and a version of this galaxy without the Lyα emission to mimic attenuation from the IGM while preserving strong optical emission lines. All these 14 templates are fed equally into EAZY so that it constructs the best-fitting models from a linear combination of the templates to the flux and flux errors of the source measured in the Kron 1.2, 1.7 elliptical aperture (see Section 3). For each source, EAZY applies IGM absorption following Inoue et al. (2014) for redshift steps of Δz = 0.01. Initially, we consider the redshift probability distribution when giving the templates freedom from z = 0.01 − 12 and assume a flat luminosity prior, as galaxy colors at z ≳ 6 are not yet well understood (Salmon et al. 2018). This wide redshift range is chosen to allow the comparison between the probability of galaxies to be at high (z > 5) and low (z < 5) redshifts.
4.2. Selection Criteria for Catalog
We build the final catalog of galaxy candidates applying the following selection criteria to the results of the photometric-redshift fits from EAZY:
- 1.
 measured in the 04 circular aperture, implying a nondetection in i814.
 - 2. or also measured in the 04 circular aperture, to ensure the source is detected at high redshift while also potentially selecting strong Lyα emitters where the flux would only be detected in the Y105, or galaxies with strongly absorbed Lyα producing continuum emission only in the J125.
- 3.The integrated redshift probability P(z) calculated from EAZY at P(6 < z < 12) > 60%, securing that a high-redshift solution dominates over the total probability distribution.
- 4.The integral of the primary peak of the total integrated distribution P(zpeak) > 50%.
- 5.The redshift probability distribution at z = 7.5 is higher than the neighboring distributions, in Δz = 1 bins: P(6 < z < 7) < P(7 < z < 8) ∧ P(8 < z < 9) < P(7 < z < 8).


We do not place a cut in the half-light radius of the source in order to include in the catalog possible active galactic nuclei (AGN) sources, which would exhibit a more pointlike morphology. However, this parameter is reported in Table 2 and is considered during the visual inspection step. Note that the half-light radius r0.5 of a star in our survey in the J125 band is 2.65 pixels, or 013.
Using the above criteria, we find five LBG candidates where one is the quasar ULAS J1342+0928, and two are identified as diffraction spikes from visual inspection. The succeeding catalog is thus composed of the recovered quasar and two galaxy candidates. We note that decreasing the S/N threshold so that  or
or  results in large contamination due to sources with a marginal detection in just one band (25), diffraction spikes (13), bad pixels, or other detector artifacts (25).
An additional test fitting only a lower-redshift solution was performed to better discriminate among possible low-redshift contaminants. For this, we set EAZY to freely fit the 14 SED templates over a redshift span of z = 0.01–5. We then compared the χ2 of the best-fit template from this lower-redshift solution  to that at higher redshift
  with the redshift span of z = 0.01–12. If
  the goodness of the fit is lower than the threshold of 95% confidence interval, which means the source can be similarly fit with a high- and a lower-redshift solution (see, e.g., Finkelstein et al. 2022; Bagley et al. 2024). We discarded one candidate that did not pass this test, as it had a
  with a redshift solution of zlow = 2.5 and zhigh = 7.9. The final catalog thus contains the quasar and one LBG candidate at z ∼ 7.5 passing the test with
5. Galaxy Candidates in the Quasar Field
In this section, we present the results from our search of galaxy candidates associated with the quasar ULAS J1342+0928 environment at z ∼ 7.5. We further comment on the inspection of our HST+Spitzer/IRAC data at the position of gas-rich [C ii] emitter at z ∼ 7.5 previously identified in Venemans et al. (2020). Finally, we explore additional galaxy candidates at a slightly lower redshift than that of the quasar at z ∼ 7. Figure 4 shows the postage stamps of the LBG candidates, their SED, and photometric-redshift solution from EAZY with both the high-redshift and lower-redshift fits. Table 1 summarizes the properties of these LBGs and the [C ii] emitter.

Figure 4. Galaxy candidates resulting from our search including the quasar ULAS J1342+0928 at z = 7.54, and a new LBG candidate in its environment. Left: postage stamps of each candidate in the iYJ HST filters (30 × 30), and the two Spitzer/IRAC bands(120 × 120). Middle: the best-fit SED of the high-redshift solution of the candidate is presented in blue, with nondetections in red as 1σ upper limits. We present the SED of the low-redshift solution with a dotted gray line. Right: the P(z) vs. z from EAZY with the best-fitting redshift (za) in blue, and a vertical pink line indicating the redshift of the quasar for reference. Note that the redshift probability distributions are highly favored at z = 7–8 for the top two panels, where the quasar is ID: 6381. The LBG candidate C-4636 has a slightly higher-redshift solution at zphot = 7.69 because of the flat P(z) across z = 7.5–8. The bottom two candidates favor a slightly lower-redshift solution at z ∼ 7.
Download figure:
Standard image High-resolution imageTable 1. EAZY Fit of Galaxy Candidates in the Quasar Field
| ID | α | δ | P(z > 6) | P(6.5 < z < 7.5) | P(7 < z < 8) | zphot |

| zspec | d |
|---|---|---|---|---|---|---|---|---|---|
| (deg) | (deg) | (%) | (%) | (%) | (arcsec) | ||||
| QSO-6381 | 205.5337428 | 9.4773167 | 100 | 17 | 100 |

| 483.16 | 7.5400 ± 0.0003 a | ⋯ |
| C-4636 | 205.5435057 | 9.4851103 | 100 | 20 | 80 |

| 16.51 | ⋯ | 44.6 |
| C-[C ii] | 205.5343208 | 9.4787250 | ⋯ | ⋯ | ⋯ | ⋯ | ⋯ | 7.5341 ± 0.0009 b | 5.44 |
| C-4966 | 205.5207121 | 9.4853401 | 95 | 71 | 39 |

| 6.48 | ⋯ | 90.4 |
| C-5764 | 205.5591434 | 9.4785146 | 98 | 79 | 29 |

| 14.05 | ⋯ | 55 |
Note. This table presents the catalog of galaxy candidates in the quasar field, selected here with EAZY using HST and Spitzer photometry. The reported values at the top correspond to the recovered quasar ULAS J1342+0928 with confirmed systemic redshift z = 7.54 a , candidate C-4636 at z ∼ 7.5, and dust-obscured candidate C–[C ii] identified with a systemic redshift z[C II] b . For the bottom two candidates, our fit preferred a solution at z ∼ 6.8–6.9, in the redshift range of an absorber at z = 6.84 in the line of sight of the quasar Simcoe et al. (2020). Column (1) is the candidate ID. Columns (2)–(3) are the R.A. and decl. calculated in degrees. Columns (4)–(6) present the integral of the redshift probability distribution in three redshift bins (see Section 4.2). Column (7) presents the photometric redshift with the highest probability and its 68% confidence interval as calculated with EAZY. Column (8) shows the difference in the best-fit χ2 for the low- (z < 5) and high- (z < 12) redshift solutions. Column (9) is the spectroscopic redshift of the sources when available. Column (10) is the projected distance of the candidate to the quasar.
a Systemic redshift measured using ALMA observations of the [C ii]−158 μm emission line from the quasar's host galaxy in Bañados et al. (2019). b Systemic redshift calculated from [C ii]−158 μm observations with ALMA in Venemans et al. (2020).Download table as: ASCIITypeset image
5.1. A Galaxy Candidate at z ∼ 7.5
We recover the quasar with a photometric redshift of zphot = 7.59, where its systemic redshift measured from [C ii] emission is z = 7.5400 ± 0.0003 (Bañados et al. 2019). We find a new LBG candidate, C-4636, at zphot = 7.69 (see Figure 4). This photometric redshift is slightly higher than that of the quasar given the very flat redshift probability distribution between z = 7.5 and 8, but the solution dominates among the other redshift distributions with P(7 < z < 8) = 80%, constraining its association with the environment of the quasar. Moreover, C-4636 is at a projected distance of 223 pkpc from the quasar. This distance is similar to that of galaxies found around other high-z quasars in the literature, which showed strong quasar-galaxy clustering (e.g., Morselli et al. 2014; Farina et al. 2017; Mignoli et al. 2020; Meyer et al. 2022). Further exploration of the QSO-LBG clustering for quasar ULAS J1342+0928 and this candidate is described in Section 6.2.
We examine the candidate's i814 − Y105 and Y105 − J125 colors to evaluate possible stellar contamination. We take MLT-dwarf stars from the IRTF SpeX Library developed by Burgasser (2014) and compare their colors to those of LBGs and quasars at z = 6.5 − 8.5. The color of candidate C-4636 in Y105 − J125 = 0.7 and its compact morphology with a half-light radius r0.5 = 010 is comparable with the average radius of stars in this field of r0.5 = 013 ± 001, make it a possible MLT-dwarf contaminant (see Figure 6). However, the ratio of the flux in the total Kron to the 04 aperture of 1.45 ± 0.07, and the Source Extractor stellarity parameter of CLASS_STAR =0.08 do not classify this source as a star. Additionally, galaxies at this redshift would show a distinct SED from MLT contaminants at λ > 2 μm, which can be determined even with shallow IRAC imaging (e.g., Finkelstein et al. 2022; Bagley et al. 2024). The nondetection in our IRAC/3.6 and 4.5 μm imaging supports the high-redshift nature of this candidate. Thus, we still consider this source as a good LBG candidate in the physical environment of ULAS J1342+0928. We recognize that additional filter information redder than the J125 band would provide further insights into the characterization of this source.
The compact morphology could suggest that C-4636 is an AGN. This is consistent with theoretical simulations, which show that AGNs tend to cluster near quasars with an SMBH of 108–109 M⊙ (Costa et al. 2014), and some observational cases already seen at z > 5 (e.g., McGreer et al. 2016; Connor et al. 2019; Yue et al. 2021; Maiolino et al. 2023; Scholtz et al. 2023). Existing 45 ks Chandra observations of this field do not show any X-ray signal at this location. (Bañados et al. 2018b). Future JWST NIRSpec spectrum targeting strong nebular emission lines could be used for a Baldwin–Philips–Terlevich diagnostic diagram (Baldwin et al. 1981) to distinguish whether this source is an AGN.
5.2. Dusty Star-forming Galaxy
A galaxy candidate at 27 projected pkpc from the quasar ULAS J1342+0928 had been previously identified in Venemans et al. (2020). This candidate was recovered with Atacama Large Millimeter/submillimeter Array (ALMA) observations targeting the rest-frame [C ii]-158 μm emission of the quasar and found to be at z[C II] = 7.5341 ± 0.0009. In order to study the properties of this source in other wavelengths, we looked for any counterpart emission in the HST and Spitzer/IRAC data. However, we did not detect this galaxy in any of the five images (see Figure 5). Since no flux is recovered up to S/N ∼2, the possibility of this galaxy being a low-redshift interloper is strongly disfavored. Furthermore, many studies have concluded that there is a significant population of dust-obscured galaxies that have no rest-frame optical counterpart detected at the current observational limits (e.g., Wang et al. 2019b; Mazzucchelli et al. 2019; Meyer et al. 2022). Therefore, this [C ii] emitter could be one of these dusty star-forming galaxies (DSFG) in the environment of ULAS J1342+0928. Currently, the only detection available of this galaxy is from ALMA 223 GHz observations of its [C ii] emission at 0.10 ± 0.03 Jy km s−1, and no dust continuum was recovered (fcont < 0.06 mJy; Venemans et al. 2020). Given the information at hand, we are not able to place meaningful constraints or predictions on the SED of this source. Further ALMA or JWST observations are necessary to confirm the nature of this source and study its properties. The current ALMA observations of this field cover only a field of view of ∼39'', i.e., ∼194 kpc, around the quasar. Hence, we are not able to investigate any counterpart for the LBG candidates found in this work.

Figure 5. Postage stamps in the HST (20 × 20) and Spitzer (40 × 40) filters used in this work at the position of the DSFG previously identified with ALMA at z = 7.5341 ± 0.0009 (Venemans et al. 2020). The rest-frame [C ii]-158 μm emission is presented with the contours at levels of −2σ, 2σ, 3σ, 4σ, 5σ where the rms value is σ = 0.04 mJy beam−1. The ALMA 222.7 GHz beam with a size of 026 × 019 is shown in white at the bottom-left corner. This [C ii] emitter is not detected in any of the NIR filters we use.
Download figure:
Standard image High-resolution image5.3. Additional Candidates at z ∼ 7
Simcoe et al. (2020) inspected the optical/NIR spectrum of ULAS J1342+0928, and identified a strong metal absorber at z = 6.84 spanning ∼150 km s−1 on its line of sight. This galaxy has not been directly observed in emission yet. Hence, we also explore candidates at z ∼ 7 to search for any counterparts (e.g., Neeleman et al. 2019). We begin by selecting all sources with P(6 < z < 12) > 60%, and a P(6 < z < 7) higher than neighboring distributions in Δz = 1 bins. After visually inspecting the candidates and evaluating the best fits for the high- and lower-redshift solutions  , similar to the process used for the z ∼ 7.5 galaxy candidates search, we identify two galaxy candidates. C-4966 has a photometric redshift of zphot = 6.91 and a probability distribution of P(6 < z < 7) = 55% and P(6.5 < z < 7.5) = 71%. C-5764 is found at zphot = 6.89 and has a P(6 < z < 7) = 68% and P(6.5 < z < 7.5) = 79% (see Figures 2, 4, and Table 1). Both candidates favor a redshift solution closer to z = 6.5 − 7.5. Evaluating different Lyα properties for these candidates using our color models for LBGs at z = 6.5 − 8.5 in Figure 6, we find that similar colors would be reproduced with either (FWHM =1000 Å; EW =15Å) or (FWHM = 2000 Å; EW =15 Å), rather than a more typical narrow Lyα line for LAEs (FWHM = 200 Åand EW = 100 Å or lower). Spectroscopically confirming these galaxies could point to galaxy clustering in the field at z ∼ 6.8, near the absorber.
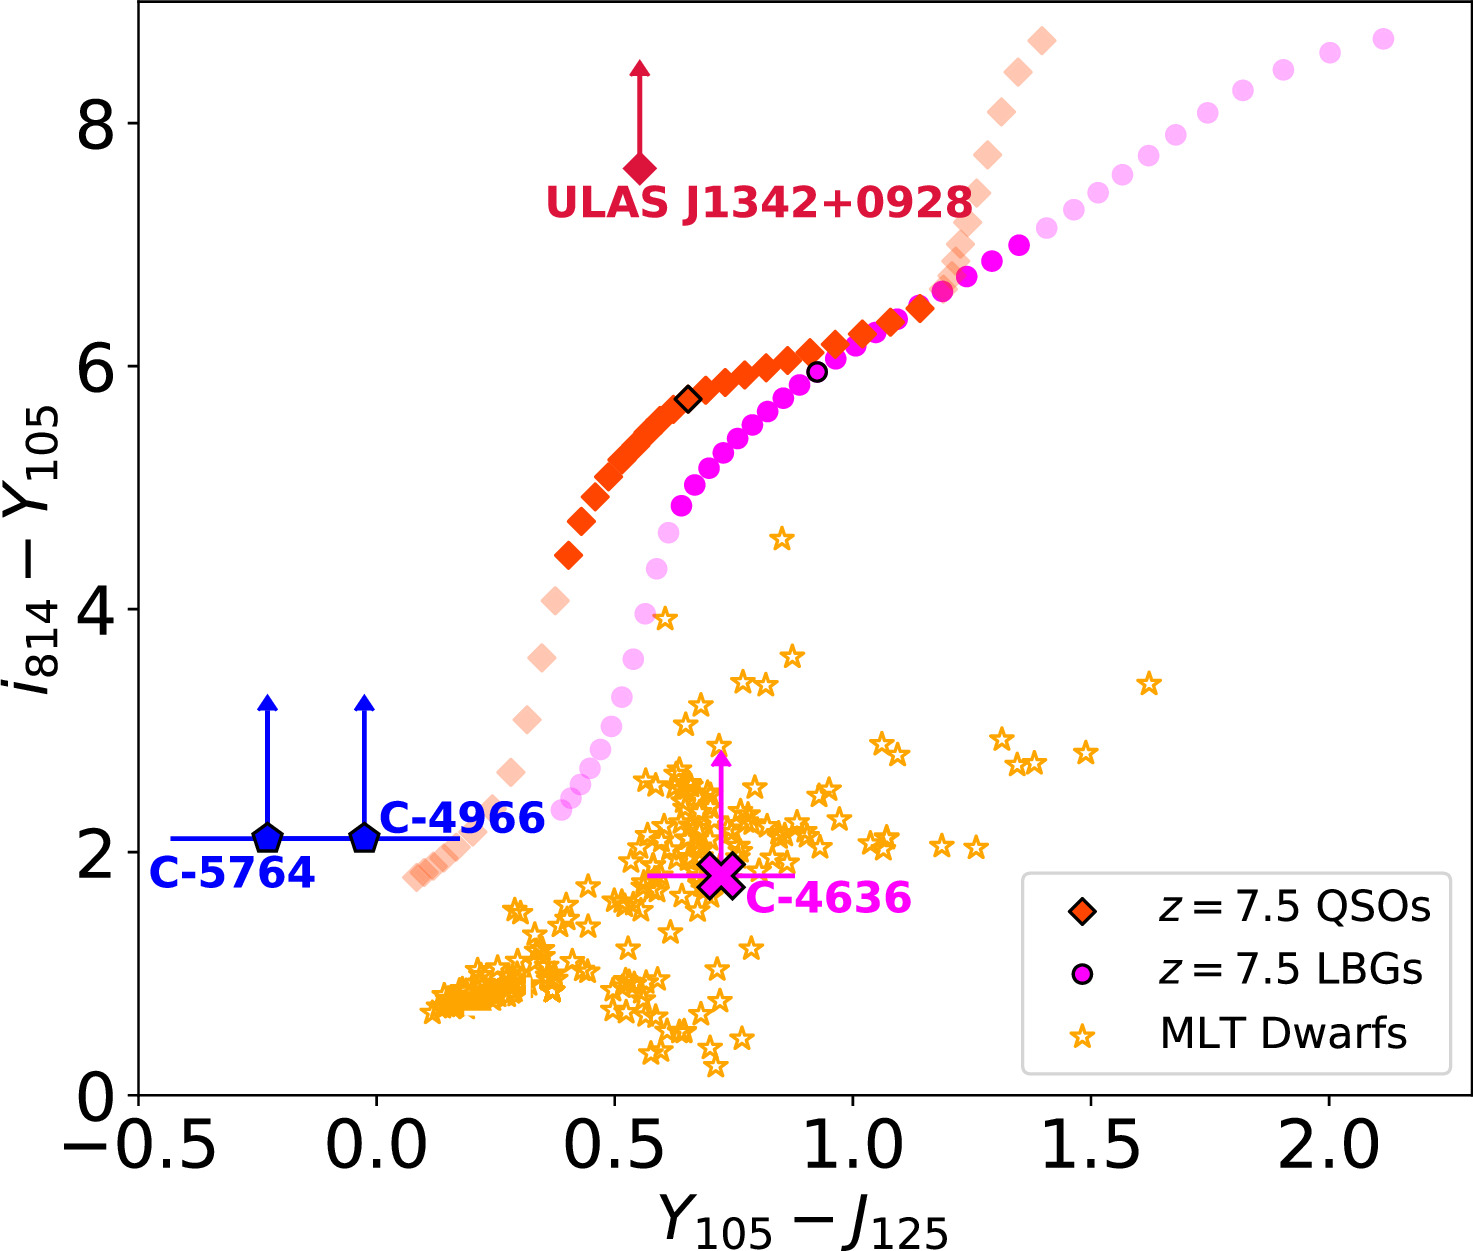
Figure 6. Color–color diagram using the HST bands. The quasar ULAS J1342+0928 is marked with a crimson diamond, indicating a strong Lyman break in the i814 − Y105 color. We show typical quasar (red diamonds) and LBG (magenta circles) colors in the redshift range of z = 6.5–8.5, with a redshift step of Δz = 0.05. The MLT-dwarf stars are denoted by yellow stars. LBG candidate C-4636 identified at zphot = 7.69 with EAZY, is marked with a magenta cross. Blue pentagons represent the z ∼ 7 LBG candidates, showing distinctively bluer Y105 − J125. colors compared to the z ∼ 7.5 LBGs in the diagram.
Download figure:
Standard image High-resolution image6. Discussion
6.1. Completeness
The Lyman break of LBG candidates at z ∼ 7.5 falls at the observed wavelength of λ ∼ 1μm, which is positioned right in the middle of the Y105 band used in this work (see Figure 1). This implies that even if the source is detected in Y105, its Y105 − J125 color would be red. No contiguous filter (e.g., HST JH140 or H160) is available to us to robustly measure the rest-frame UV color redward of the Lyα break. Although our photometry in the Spitzer/IRAC 3.6 and 4.5 μm bands complement the galaxy SED and help determine its dust components to rule out low-redshift contaminants, this is only possible for galaxies already robustly selected at high redshift with HST imaging up to λ ∼ 2μm. Our data currently has a wider gap in the wavelength coverage (1.4–3.6 μm, or J125 − IRAC/3.6 μm), causing a considerable number of galaxies to never enter the selection catalog. Taking into account all these limitations, we compare the found number density (one new LBG) to what we would recover with a consistent selection of galaxy candidates in the same redshift span of z ∼ 7–8, using comparable data from blank fields.
The Cosmic Assembly Near-Infrared Deep Extragalactic Legacy Survey GOODS North and South Deep survey presented in Finkelstein et al. (2015) provides a similar filter coverage (I814, Y105, J125, H160) at comparative depths to our HST survey around ULAS J1342+0928. This filter coverage helps to assess the completeness of our data since we can attempt to reproduce the number density of LBGs in a blank field, but using just the I814, Y105, and J125 bands and our selection criteria for high-redshift galaxies. We build the photometry catalog for EAZY using the fluxes from the GOODS catalog, and the flux errors from our limiting magnitudes in the HST filters to match the noise to that of our images. We run EAZY in the same setup and select LBG candidates with the criteria employed for the analysis of the quasar field (see Section 4.2). Using these three HST filters alone, we recover 31 sources. This is much lower than the 125 sources with a photometric redshift between z = 7 and 8 in the GOODS catalog that are selected when including the additional photometry in H160. Hence, we recover in total only 31/125, i.e., ∼25% of the sources.
This test shows that the selection of z ∼ 7.5 galaxies based on our HST filter set is strongly incomplete. The recovered fraction of galaxies and their magnitudes in J125 is shown in bins of Δ0.5 mag in Figure 7. Note that the faintest galaxy candidate recovered from this catalog has J125 = 27.53, whereas the GOODS catalog from Finkelstein et al. (2015) has sources as dim as J125 = 28.76. For galaxies in GOODS at J125 < 26.5, i.e., in the range of C-4636 (J125 = 26.41; see Table 2), we obtain the highest recovery rate of 43%. The completeness drops to ∼10% between J125 = 27.5 and 28.0. However, we note that our 5σ limiting magnitude in this band is deeper reaching up to J125,5σ = 27.46 (see the dashed line in Figure 7).

Figure 7. Assessment of the completeness of our selection technique of high-redshift galaxy candidates around ULAS J1342+0928 presented in magnitude bins of  and 1σ Poisson errors calculated with Gehrels (1986). The 5σ J125 limiting magnitude from this work is denoted with the dashed red line.
Download figure:
Standard image High-resolution imageTable 2. Photometry of HST and Spitzer Selected Galaxy Candidates
| ID | S/Ni | S/NY | S/NJ | S/N3.6μm | S/N4.5μm | i814 | Y105 | J125 | 3.6 μm | 4.5 μm | r0.5 |
|---|---|---|---|---|---|---|---|---|---|---|---|
| (AB mag) | (AB mag) | (AB mag) | (AB mag) | (AB mag) | (arcsec) | ||||||
| QSO-6381 | −0.01 | 3461.1 | 3772 | 100.87 | 118.14 | >28.62 | 21.18 | 20.61 | 20.16 | 20.15 | 014 |
| C-4636 | −1.20 | 8.63 | 12.03 | −1.0 | 0.09 | >28.71 | 27.11 | 26.41 | >24.14 | >24.22 | 010 |
| C-4966 | 1.88 | 9.45 | 6.62 | 0.26 | 0.98 | >28.77 | 26.34 | 26.43 | >23.96 | >24.04 | 014 |
| C-5764 | 0.24 | 10.64 | 6.16 | 0.90 | 0.19 | >28.80 | 26.93 | 27.08 | >23.68 | >23.73 | 015 |
Note. This table presents the photometry of the high-redshift galaxy candidates. Column (1) is the candidate ID. Columns (2)–(6) are the calculated S/N values from the 04 diameter circular aperture in the HST bands, and from the Spitzer photometry. Columns (7)–(11) are the calculated AB magnitudes, where the limiting magnitudes correspond to 3σ estimates. Column (12) is the half-light radius of the object in arcseconds.
Download table as: ASCIITypeset image
6.2. Exploring the Environment of ULAS J1342+0928
In the context of clustering, the probability of finding an excess of LBGs around a quasar is determined by the two-point correlation function, represented as 1 + ξQG(r). Here, the quasar and LBG (QSO-LBG) cross-correlation is expressed in a power-law form  , where rQG
0 signifies the cross-correlation length and γ denotes the slope of the function. The highest redshift at which the QSO-LBG clustering has been studied is z ∼ 4 (García-Vergara et al. 2017), resulting in
, where rQG
0 signifies the cross-correlation length and γ denotes the slope of the function. The highest redshift at which the QSO-LBG clustering has been studied is z ∼ 4 (García-Vergara et al. 2017), resulting in  comoving Mpc (cMpc) with a fixed slope of γ = 2.0. We adopt these measurements and assume no evolution of the QSO-LBG cross-correlation between z = 4 and z = 7.5 (830 Myr). The resulting LBG excess as a function of the comoving radius around ULAS J1342+0928 is presented with the magenta curve in Figure 8. A quasar field presenting a QSO-LBG excess consistent or above this curve would be considered to reside in a high-density region, suggestive of an overdensity. We calculate the excess based on our observation of one QSO-LBG pair relative to the expected number of LBGs in the field. This expected number is calculated from the number density of LBGs at z = 7.5 as interpolated from the z = 7 and 8 rest-UV luminosity functions from Finkelstein et al. (2015); our completeness fraction from Section 6.1, and the comoving cylindrical volume with a radius equivalent to the comoving distance from the quasar to candidate C-4636, and a comoving line of sight from the quasar's redshift Δz = ± 0.3, corresponding to the redshift uncertainties on the C-4636 zphot estimated with EAZY (see Section 5.1 and Table 1). Note that in this estimation we do not account for candidate C-[C ii] identified with ALMA in the environment of the quasar, given that this galaxy is not UV bright. Figure 8 shows that at the comoving radius to C-4636 corresponding to 1.9 cMpc, we observe an LBG excess of
  (green circle with error bars), indicating that this quasar field is consistent with cosmic density (black-dashed line where LBG excess is = 1), or slightly underdense. This field is incompatible with an overdensity of UV-bright galaxies as our result is at least 1.4 times below the clustering expectations (magenta curve) around z = 4 quasars from García-Vergara et al. (2017). Note that this measurement is limited by low number statistics. Therefore, a larger area coverage or optimal set of filters to improve the completeness of LBGs, and spectroscopic follow-ups, would be necessary to fully characterize the environment of this quasar.

Figure 8. Predicted LBG excess as a function of radius around our quasar at z = 7.54. The pink curve represents the LBG excess taking into account the uncertainty on the determination of the QSO-LBG clustering cross-correlation rQG
0 from García-Vergara et al. (2017), assuming no evolution between z = 4 and z = 7.5 (see Section 6.2). Uncertainties due to cosmic variance are not considered. Accounting for our completeness and the LBG we found at z = 7.69 with a projected distance to the quasar of 223 pkpc (1.9 cMpc), we calculate an LBG excess of  (green circle with 1σ errors from Gehrels 1986), consistent with an average or low-density field. We note that our result is limited by low Poisson statistics.
Download figure:
Standard image High-resolution image
JWST observations from program GTO 1219 (PI: Luetzgendorf) aim at confirming the LBG candidate C-4636 at z ∼ 7.5 using NIRSpec MSA spectroscopy. The observations cover 0.7–3.1 μm with the G140H/F070LP and G235H/F170LP grating and filter combination. This setup offers a high-resolution power of ∼1000 and ∼2700, respectively, enabling sensitivity to UV metal emission lines such as C iv λ1549, C iii] λ λ 1907,1909, and Mg ii λ2798. These lines would characterize the ionization and chemical enrichment of the galaxy (e.g., Hutchison et al. 2019). The Lyman break at z ∼ 7.5 from the galaxy would potentially be observed providing additional confirmation of the candidate. Recent studies using JWST NIRCam/WFSS spectra have demonstrated overdensities around quasars at slightly lower redshifts. Wang et al. (2023) found 10 [O iii] emitting galaxies in the environment of the quasar J0305-3150 at z = 6.6, probing an overdensity of galaxies in this field. Furthermore, Kashino et al. (2023) compiled a comprehensive catalog of [O iii] emitting galaxies at 5.3 < z < 7.0 in the field of the quasar J0100+2802 at z = 6.327. Among the 117 [O iii] emitters, 24 were associated with the quasar environment, revealing a clear overdensity of galaxies. These findings therefore demonstrate the efficacy of investigating quasar environments by observing strong UV-rest emission lines of galaxies. Applying a similar strategy to the z = 7.54 quasar ULAS J1342+0928, the use of NIRCam/WFSS with the F430M filter would be suitable for identifying such [O iii]-emitting galaxies.
Even though simulations show that massive quasars such as ULAS J1342+0928 are good indicators of galaxy overdensities, the opposite has also been observed (e.g., Bañados et al. 2013; Simpson et al. 2014; Mazzucchelli et al. 2017a). There is no evidence for an evolutionary trend of overdensities with redshift, as, for example, Mignoli et al. (2020) found both LBGs and LAEs in the environment of a quasar at z = 6.31. On the contrary, Goto et al. (2017) did not find any LAEs around a z = 6.4 quasar and pointed to the possibility that the quasar formation drains out the available matter within ∼1 pMpc. There are indeed many physical processes at play in the formation of a quasar and its environment. A possible method to suppress or delay star/galaxy formation within a few proper megaparsecs from the quasar is its UV radiation (e.g., Ota et al. 2018; Costa et al. 2019; Lambert et al. 2024).
In a different scenario, supernova-driven galactic winds could simply sparse the galaxies further away from the quasar and thus reduce the number density observed (e.g., by a factor of up to 3.7 in the HST/ACS area; Costa et al. 2014). Finally, there is also the possibility of the environment being fully dominated by dust-obscured galaxies, and no LBGs or LAEs can be found with traditional photometric techniques. In order to probe this scenario for the ULAS J1342+0928 field, further ALMA observations covering a larger area could unveil this population of galaxy candidates. One can further explore their chemical properties by, e.g., rest-frame optical observations with JWST (e.g., Decarli et al. 2017; García-Vergara et al. 2022).
6.3. Galaxy Absorber Association at z ∼ 6.8
Analysis of the z = 6.84 absorber detected in the spectrum of ULAS J1342+0928 by Simcoe et al. (2020) suggests that this system may be classified as a damped Lyα system, with a fiducial column density of NHI = 1020.6 cm−2 (Simcoe et al. 2020). Galaxies originating such absorbers at z ∼ 4 are typically located at impact parameters of ≲50 pkpc (e.g., Neeleman et al. 2017, 2019). However, recent studies based on z < 2 Mg ii (λ λ2796, 2803 Å) absorbers, showed that group environment may give rise to stronger and more widespread absorption systems within a projected distance of ≲480 pkpc (e.g., Nielsen et al. 2018; Fossati et al. 2019; Dutta et al. 2020). If this behavior holds at high redshift (see Doughty & Finlator 2023, for the implication of the end of the reionization on absorption systems), this can explain the relatively large impact parameters observed for our two candidates C-4966 and C-5764 (290 pkpc, 476 pkpc, assuming z = 6.9, respectively). The two z ∼ 6.9 galaxy candidates need to be spectroscopically confirmed to establish the physical link with the metal absorption system detected at z ∼ 6.8 by Simcoe et al. (2020).
7. Summary
We present the results of a search for LBG candidates in the environment of the z = 7.54 quasar ULAS J1342+0928. We used HST+Spitzer/IRAC observations designed to look for LBGs in the ∼1 pMpc2 environment of the quasar. Here, we present newly obtained deep HST ACS/WFC i814 and WFC3 Y105 and J125 bands. We use the HST observations to select LBG candidates with a photometric redshift at z ∼ 7.5. Shallower Spitzer/IRAC 3.6 and 4.5 μm observations are utilized to constrain the high-redshift solution of the galaxies selected.
The final catalog results in the recovery of the quasar and one LBG at z = 7.69, with magnitude J125 = 26.4 and at a projected distance of only 223 pkpc from the quasar. An additional candidate previously identified in the environment of ULAS J1342+0928 using ALMA band 6 observations and with z[C II] = 7.5341 ± 0.0009 (Venemans et al. 2020) is not detected in any of the five bands used in this work. This is a potential dust-obscured star-forming galaxy candidate at z = 7.5 just 27 pkpc in projection from the quasar.
Galaxy candidates at lower-photometric redshifts z = 6.91 and z = 6.89 are identified in the data set, and interestingly, are at a redshift that is consistent with a z = 6.84 absorber in the line of sight previously identified in the quasar spectrum in Simcoe et al. (2020).
The completeness of galaxy candidates found at z ∼ 7.5 in our survey compared to blank fields from GOODS (Finkelstein et al. 2015), proves to be low even at the brightest magnitudes of J125 < 26.5 (∼40%). This low completeness can be explained by the fact that a z ∼ 7.5 LBG begins to drop out halfway through the Y105, leading to biased results favoring candidates with redder Y − J colors. Taking into account this caveat, we investigate the quasar-LBG clustering in this field following the studies at z ∼ 4 in García-Vergara et al. (2017) and assuming no evolution for clustering. We find that this quasar field is not consistent with an overdensity of LBGs, but instead with cosmic density or even an underdense region, noting that this result is heavily influenced by the limitations imposed by Poisson statistics given the sample of only one LBG candidate. This outcome is puzzling considering the recent findings of overdense quasar environments at z = 6.3 and 6.6 in Kashino et al. (2023) and Wang et al. (2023), respectively. The limitations show that spectroscopy might be crucial as these studies looked for galaxies emitting [O iii] rather than relying on the Lyα signature. The quasar ULAS J1342+0928 is one of the most extreme objects in the universe and there are truly several strategies to further explore its environment. First, our work demonstrates that it is expected to find more LBG galaxy candidates using further HST or JWST with a more complete set of filters in the NIR. Alternatively, ALMA mosaic observations covering the quasar field could reveal a potential population of dust-obscured galaxies. Additionally, we could rely on the power of JWST spectra to find galaxies in the field of ULAS J1342+0928 by looking for their [O iii] emission. Finally, expanding the search of galaxies to a wider area of up to 10 cMpc could probe necessary to thoroughly investigate the environment of this z = 7.54 quasar (Chiang et al. 2013; Overzier 2016).
Acknowledgments
We thank the anonymous referee for the valuable comments and inquiries that enriched this manuscript. Acknowledgment is extended to the help desk at Space Telescope Science Institute for their support in data reduction. S.R.R. acknowledges financial support from the International Max Planck Research School for Astronomy and Cosmic Physics at the University of Heidelberg (IMPRS–HD). S.R.R and C.M. acknowledge the Science Support Discretionary Fund at the European Southern Observatory, Vitacura, Chile. E.P.F. is supported by the international Gemini Observatory, a program of NSF's NOIRLab, which is managed by the Association of Universities for Research in Astronomy (AURA) under a cooperative agreement with the National Science Foundation, on behalf of the Gemini partnership of Argentina, Brazil, Canada, Chile, the Republic of Korea, and the United States of America. We would like to thank Nina Hatch for sharing her expertize in protoclusters and overdensities of galaxies at high redshift. This paper makes use of HST data from program cy15/GO 1165 that can be found in MAST at doi:10.17909/q77c-8j50, Spitzer/IRAC cy16/13201, 19 and ALMA#2017.1.00396.S
Facility: HST - Hubble Space Telescope satellite, Spitzer/IRAC - , ALMA - Atacama Large Millimeter Array.
Software: Astropy (The Astropy Collaboration et al. 2013), DrizzlePac (Hack et al. 2013), EAZY (Brammer et al. 2008), GOLFIR (Brammer 2022) JS9-4L, 20 Matplotlib (Hunter 2007), NumPy (Harris et al. 2020), PyPHER (Boucaud et al. 2016), SciPy (Virtanen et al. 2020), Source Extractor (Bertin & Arnouts 1996).
Footnotes
- 15
- 16
- 17
- 18
- 19
- 20